Relationship between Body Mass Index,
C-Peptide, and Delta-5-Desaturase Enzyme
Activity Estimates in Adult Males
C. Austin Pickens, Karen H. Matsuo, Jenifer I. Fenton*
Department of Food Science and Human Nutrition, Michigan State University, East Lansing, MI, 48824, United States of America
Abstract
Obesity, in particular abdominal obesity, alters the composition of plasma and tissue fatty acids (FAs), which contributes to inflammation and insulin resistance. FA metabolism is modulated by desaturases and may affect adipokine and insulin secretion. Therefore, we examined relationships between adipokines, a marker of insulin production, and plasma FA desaturase enzyme activity estimates (EAEs) in obesity. Plasma phospholipid (PPL) FAs were isolated from 126 males (ages 48 to 65 years), derivatized, and analyzed using gas chromatography. Delta-6 desaturase (D6D) and delta-5 desaturase (D5D) EAEs were cal-culated as the ratio of PPL 20:3/18:2 and 20:4/20:3, respectively. In body mass index (BMI) and waist circumference (WC) adjusted polytomous logistic regression analyses, PPL FAs and FA desaturase EAEs were associated with C-peptide and adiponectin. Individuals with elevated D6D EAEs were less likely (OR 0.33) to have serum adiponectin concentra-tions>5.37μg/mL, compared with adiponectin concentrations3.62μg/mL. Individuals with increased D5D EAEs were less likely (OR 0.8) to have C-peptide concentrations 3.32 ng/mL, and>1.80 and3.29 ng/mL, compared with those with C-peptide 1.76 ng/mL. The proinflammatory cytokine tumor necrosis factor-α(TNF-α) was posi-tively associated with C-peptide, but TNF-αwas not associated with the D5D EAE. C-peptide and adiponectin concentrations are associated with specific PPL FAs and FA desaturase EAEs. The relationship between C-peptide concentrations and D5D EAEs remained significant after adjusting for BMI, WC, and TNF-α. Thus, future research should investigate whether D5D inhibition may occur through a C-peptide mediated pathway.
Introduction
Obesity is a chronic disease affecting over one-third of US adults [1]. Obesity is associated with excess lipid storage in white adipose tissue (WAT), adipokine dysregulation, insulin resistance, and chronic low-grade inflammation [2]. Adipokines are adipose-derived cytokines, which have functions in regulating metabolism and inflammation. The expansion of WAT alters adi-pokine secretion and fatty acid (FA) metabolism, and also influences low-grade inflammation associated with insulin resistance and type-2 diabetes (T2D) [3]. In obesity, circulating OPEN ACCESS
Citation:Pickens CA, Matsuo KH, Fenton JI (2016) Relationship between Body Mass Index, C-Peptide, and Delta-5-Desaturase Enzyme Activity Estimates in Adult Males. PLoS ONE 11(3): e0149305. doi:10.1371/journal.pone.0149305
Editor:Jonathan Peterson, East Tennessee State University, UNITED STATES
Received:November 30, 2015
Accepted:January 30, 2016
Published:March 29, 2016
Copyright:© 2016 Pickens et al. This is an open access article distributed under the terms of the
Creative Commons Attribution License, which permits unrestricted use, distribution, and reproduction in any medium, provided the original author and source are credited.
Data Availability Statement:The authors may release a sub-set of data to interested parties upon request. Requests should be made to Dr. Frederik Derksen, Michigan State University, Food Science and Human Nutrition Department, Chair. Dr. Derksen can be contacted by email [email protected].
concentrations of anti-inflammatory adipokines are lower (i.e. adiponectin) and pro-inflam-matory adipokines (i.e. leptin) are elevated compared with lean individuals [4].
Adipokines are necessary for normal cellular function, but dysregulated adipokine secretion can have pathological effects. Leptin is important for regulating body fat [2], but in obesity, lep-tin concentrations are elevated and individuals can become“leptin resistant”resulting in increased weight gain [reviewed in detail [5]]. Leptin and adiponectin concentrations have an inverse relationship in obese individuals. Adiponectin is an adipokine that increases FA oxida-tion and glucose utilizaoxida-tion in tissues [6]. In obesity-associated insulin resistance, adiponectin concentrations are lower and adiponectin receptors are downregulated [7]. C-peptide, a pro-tein cleaved from pro-insulin, is inversely associated with adiponectin, and C-peptide is posi-tively associated with leptin secretion [8]. While C-peptide is not an adipokine, it is used as a biomarker of insulin secretion which is altered in obesity [9]. Increases in several plasma FAs trigger inflammation, which contributes to insulin resistance and results in increased C-peptide concentrations. There is a relationship between FAs, obesity, adipokines, and insulin resistance, however, it is unknown whether adipokines are associated with specific FAs.
FAs are classified into 3 categories: saturated FAs (SatFAs), monounsaturated FAs
(MUFAs), and polyunsaturated FAs (PUFAs). PUFAs can be of the omega-3 (ω-3) or omega-6 (ω-6) family, and obese individuals tend to have lower blood concentrations ofω-3s and greater blood concentrations ofω-6s [10]. FAs such as PUFAs are obtained through dietary intake, or endogenously synthesized by elongating and desaturating enzymes. Obesity-associ-ated inflammation may alter enzyme activity and this altered enzymatic expression can modify lipid metabolism [11]. For instance, obese individuals with insulin resistance have decreased expression of the enzyme delta-5-desaturase (D5D) in skeletal muscle [12]. Obesity is also asso-ciated with lipid changes such as increased plasma SatFAs [13], in particular, palmitic acid (PA) and stearic acid (SA) [14]. Elevated circulating concentrations of SatFAs can increase inflammation and affect secretion of pro-inflammatory cytokines [15], in particular, tumor necrosis factor-α(TNF-α) which impairs insulin receptor downstream signaling [16]. Because
FAs may influence adipokine secretion and insulin resistance, determining associations between FAs and FA desaturase enzymes, adipokines, and markers of insulin production may lead to a better understanding of obesity-associated pathologies and lead to discovery of poten-tial therapeutic targets.
Most studies investigating the role of lipids in obesity focus on altered dietary FA intake [13] or red blood cell FA concentrations [17]. Similarly, numerous studies investigate the asso-ciation of obesity with adipokines or insulin resistance [3,18]. However, there is limited infor-mation on specific plasma FA associations with adiponectin, leptin, and C-peptide after adjusting (i.e. statistically) for obesity. Determining whether changes in FAs and FA metabo-lism occur independent of obesity and abdominal adiposity may allude to unknown biological relationships between FAs and adipokine dysregulation. Therefore, in this study we examined the relationship between C-peptide, adiponectin, leptin, and plasma FAs and FA desaturase enzyme activity estimates (EAEs) in overweight adults.
Materials and Methods
Ethics Statement
The study was approved by the Biomedical and Health Institutional Review Board of Michigan State University (IRB# 08–786). The Biomedical and Health Institutional Review Board is one of three IRB committees on the Michigan State University East Lansing campus. Michigan State University's IRBs were established to advance the goal of conducting research with dili-gence and integrity. The purpose of the committee is to protect the rights, welfare and privacy Competing Interests:The authors have declared
that no competing interests exist.
Abbreviations:WAT, White adipose tissue; FA, Fatty acid; T2D, Type-2 diabetes; SatFAs, Saturated fatty acids; MUFAs, Monounsaturated fatty acids; PUFAs, Polyunsaturated fatty acids;ω-3, Omega-3;ω-6, Omega-6; PA, Palmitic acid; SA, Stearic acid; TNF-α,
of human subjects who participate in research conducted by students and/or faculty affiliated with MSU. At the time of enrollment, written informed consent was obtained from each participant.
Study Population
Male subjects (n = 126,>96% Caucasian) 50–65 years of age were previously recruited from
the Tri-County Gastroenterology P.C., Clinton, MI, as previously reported [19]. In brief, nurses at the GI center were responsible for recruitment, explaining the study, and obtaining consent. Patient exclusion was performed, as previously reported [19]. In brief, patients were excluded for: 1) current immunosuppressants or antibiotics, 2) allergic disorders such as eosinophilic or mast cell disorders, severe asthma, 3) severe co-morbidities like end stage renal disease or liver disease with cirrhosis, autoimmune illness, chronic hepatitis, other chronic infections, 4) diabe-tes. At time of enrollment, trained staff collected anthropometric measurements and venous blood of study participants. These measurements were used to calculate BMI (kg/m2). Patients reported fasting before venous blood was collected, so lipid results will not be altered by dietary intake. Study participants were classified as lean (BMI<25), overweight (25BMI<30), or
obese (BMI30). Serum and plasma fractions were separated from venous blood after collec-tion, stored at -80°C. In addicollec-tion, the samples were blinded and coded so there are no unique identifiers. Clinical metadata on subject co-morbidities, current medications, family history and tumor characteristics was also collected.
Serum Adipokine and C-peptide Analysis
Adipokines and C-peptide were analyzed using ELISA or multiplex cytokine kits as previously reported [20]. A commercially available leptin ELISA kit was performed per manufacturer’s instructions (R&D Systems, DY398; Minneapolis, MN). C-peptide concentrations were mea-sured as directed by the manufacturer (Calbiotech, Spring Valley, CA, REF; CP1795). Total adiponectin measurements were performed following the manufacturer’s instructions (Alpco Diagnostics, Salem, NH).
Plasma Phospholipid Extraction, Isolation and Analysis
In brief, approximately 200 mg plasma per subject was weighed and extracted using a modified Rose and Oaklander extraction [21]. Phospholipids (PLs) were isolated using Isolute-XL1
SPE aminopropyl columns (500 mg; Bioatage, Charlotte, NC) as described by Agren et al [22]. Fatty acid methyl esters (FAMEs) were prepared as previously described [23,24]. Plasma PL
(PPL) FAMEs were analyzed using HS-Omega-3 Index1methodology at OmegaQuant
Ana-lytics, LLC (Sioux Falls, SD) as previously described [25].
Statistical analyses
Frequencies, means, and standard deviations were calculated for descriptive analyses (Table 1). Each FA was expressed as a percentage of total PPL. FA enzyme activity estimates (EAE) were cal-culated as the ratio of product-to-substrate for delta-5-desaturase (D5D) and delta-6-desaturase (D6D) as follows: D5D = arachidonic (AA)/dihomo-γ-linolenic acid (DGLA); D6D =
DGLA/lino-leic acid (LA). The total PPLω-3, herein referred to as totalω-3, was calculated as∑alpha-linolenic
acid (ALA) + eicosapentaenoic acid (EPA) + docosapentaenoic acidω-3 (DPAω-3) + docosahexa-enoic acid (DHA); The total PPLω-6, herein referred to as totalω-6, was calculated as∑LA +
C-peptide, adipokines, and FAs and EAEs, but since several variables were non-normally distrib-uted, Spearman correlations are presented (S1 Table).
Odds ratios (OR) and 95% confidence intervals were calculated using polytomous logistic regression models for categorical outcome data. Categories were defined by dividing the popu-lation into tertiles based on serum adipokine and C-peptide concentration. In all logistic regression models, adipokines and C-peptide were analyzed categorically as dependent vari-ables, with the reference category defined as individuals in the first tertile; or the third of popu-lation with the lowest concentration leptin, adiponectin, and C-peptide, respectively. FAs were analyzed as continuous independent variables in logistic regression models. We have
Table 1. Age, anthropometric, serum adipokines and insulin marker, and plasma phospholipid fatty acid percentagesa.
Overall
n 126
Age (years) 56.9±4.7
Age rangeb (48
–65)
BMI (kg/m^2) 29.7±5.2
BMI rangeb (19.20
–45.57)
WC (inches) 41.4±6.1
WC rangeb (29.75
–57.50)
Leptin (ng/mL) 9.9±10.5
Leptin rangeb (0.31
–49.47)
Adiponectin (μg/mL) 4.8±2.3
Adiponectin rangeb (1.02
–13.20)
C-peptide (ng/mL) 2.9±1.8
C-peptide rangeb (0.72
–9.90)
PA 29.2±3.1
SA 14.5±2.2
LGCA 1.6±0.5
NA 0.4±0.1
ALA 0.2±0.4
EPA 0.8±0.7
DHA 3.0±1.3
DPAω-3
totalω-3 4.9±2.0
LA 19.6±3.7
DGLA 2.7±0.9
AA 10.3±2.8
DTA 0.4±0.1
DPAω-6 0.3±0.1
totalω-6 34.1±3.9
ω-6:ω-3 8.1±3.0
D5D 4.1±1.6
D6D 0.14±0.05
aValues expressed as mean±standard deviation unless otherwise noted. PPL measurements expressed as percentage of total.
bValues listed in parenthesis expressed as range of values corresponding to age, BMI, WC, leptin, adiponectin, and C-peptide concentrations, respectively.
previously reported age is associated with several FAs and EAEs [24], therefore, all models were adjusted for age. Due to high correlation (>0.9, data not shown) between body mass
index (BMI) and waist circumference (WC), these anthropometric measurements could not be analyzed in the same model. Instead, two additional models were run, the first with the addi-tion of BMI and the second with the addiaddi-tion of WC. The odds ratios for ALA, DTA, DPAω-6, and D6D EAEs were calculated on the basis that there is a unit change of 0.1 for the respective beta coefficient for each given parameter. Statistically significant when p0.05 and a statistical trend was defined as 0.05<p0.09. Statistical analyses were conducted using SAS version 9.3 (Cary, NC).
Results
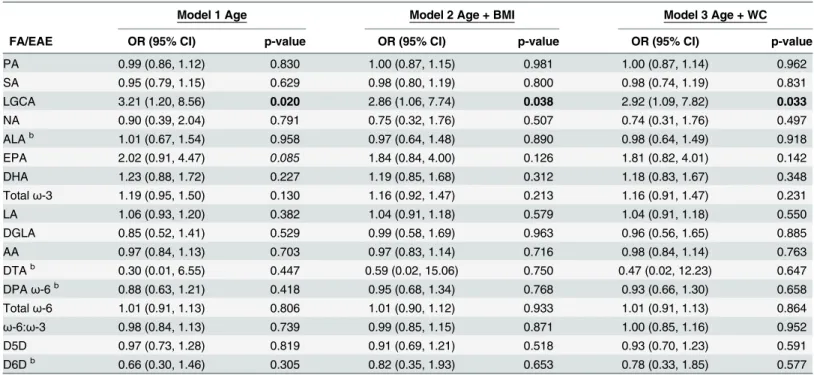
Participant characteristics and FA concentrations are displayed inTable 1. Serum adiponectin concentrations were significantly associated with PPL FAs (Tables2and3). Lignoceric acid (LGCA) was the only FA significantly associated with serum adiponectin concentrations in the second tertile,>3.64 and5.37μg/mL, when compared with individuals with adiponectin concentrations in the first tertile,3.62μg/mL (Table 2). For each unit increase in LGCA, individuals were approximately 3 times more likely to have serum adiponectin concentrations in the second tertile compared with the first tertile in all models. LGCA was not associated with serum adiponectin in the third tertile. Serum adiponectin concentrations in the third ter-tile,>5.37μg/mL, were significantly associated with several FAs across logistic regression
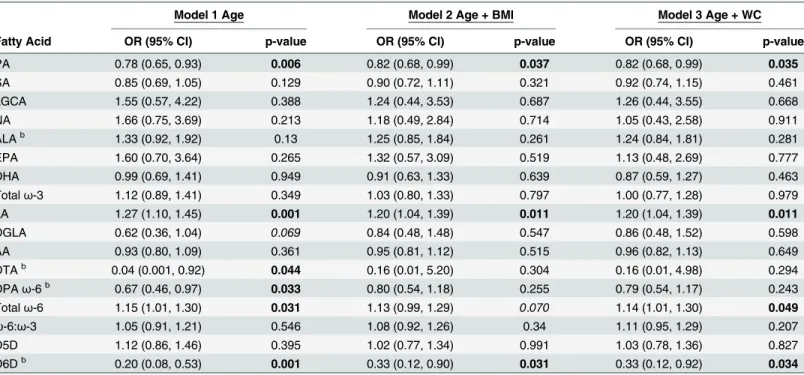
models when compared with individuals with adiponectin concentrations in the first tertile, 3.62μg/mL (Table 3). The only SatFA associated with the third tertile of adiponectin was PA. For each unit increase in PA, individuals were approximately 0.80 times as likely to have serum
Table 2. The second tertile of serum adiponectin concentrations is significantly associated with PPL LGCAa.
Model 1 Age Model 2 Age + BMI Model 3 Age + WC
FA/EAE OR (95% CI) p-value OR (95% CI) p-value OR (95% CI) p-value
PA 0.99 (0.86, 1.12) 0.830 1.00 (0.87, 1.15) 0.981 1.00 (0.87, 1.14) 0.962
SA 0.95 (0.79, 1.15) 0.629 0.98 (0.80, 1.19) 0.800 0.98 (0.74, 1.19) 0.831
LGCA 3.21 (1.20, 8.56) 0.020 2.86 (1.06, 7.74) 0.038 2.92 (1.09, 7.82) 0.033
NA 0.90 (0.39, 2.04) 0.791 0.75 (0.32, 1.76) 0.507 0.74 (0.31, 1.76) 0.497
ALAb 1.01 (0.67, 1.54) 0.958 0.97 (0.64, 1.48) 0.890 0.98 (0.64, 1.49) 0.918
EPA 2.02 (0.91, 4.47) 0.085 1.84 (0.84, 4.00) 0.126 1.81 (0.82, 4.01) 0.142
DHA 1.23 (0.88, 1.72) 0.227 1.19 (0.85, 1.68) 0.312 1.18 (0.83, 1.67) 0.348
Totalω-3 1.19 (0.95, 1.50) 0.130 1.16 (0.92, 1.47) 0.213 1.16 (0.91, 1.47) 0.231
LA 1.06 (0.93, 1.20) 0.382 1.04 (0.91, 1.18) 0.579 1.04 (0.91, 1.18) 0.550
DGLA 0.85 (0.52, 1.41) 0.529 0.99 (0.58, 1.69) 0.963 0.96 (0.56, 1.65) 0.885
AA 0.97 (0.84, 1.13) 0.703 0.97 (0.83, 1.14) 0.716 0.98 (0.84, 1.14) 0.763
DTAb 0.30 (0.01, 6.55) 0.447 0.59 (0.02, 15.06) 0.750 0.47 (0.02, 12.23) 0.647
DPAω-6b 0.88 (0.63, 1.21) 0.418 0.95 (0.68, 1.34) 0.768 0.93 (0.66, 1.30) 0.658
Totalω-6 1.01 (0.91, 1.13) 0.806 1.01 (0.90, 1.12) 0.933 1.01 (0.91, 1.13) 0.864
ω-6:ω-3 0.98 (0.84, 1.13) 0.739 0.99 (0.85, 1.15) 0.871 1.00 (0.85, 1.16) 0.952
D5D 0.97 (0.73, 1.28) 0.819 0.91 (0.69, 1.21) 0.518 0.93 (0.70, 1.23) 0.591
D6Db 0.66 (0.30, 1.46) 0.305 0.82 (0.35, 1.93) 0.653 0.78 (0.33, 1.85) 0.577
aModels de
fined as: Adiponectin = fatty acid + independent variable(s) next to model number. Fatty acids expressed as percent of total phospholipids. P-values bolded if p0.05 and italicized if 0.05<p0.09.
bOdds ratios calculated on the basis that there is a unit change of 0.1 for the respective beta coef
ficient for each given parameter.
adiponectin concentrations in the third tertile compared with the first tertile in all models (Table 3).
PPLω-6 PUFAs were not associated with adiponectin concentrations in the second tertile (Table 2). However, PPLω-6 PUFAs were significantly associated with adiponectin concentra-tions in the third tertile (Table 3). Mostω-6 PUFAs were inversely associated with the third adiponectin tertile when analyzed individually, except LA (Table 3). For each unit increase in LA, individuals were approximately 1.20 times more likely to have serum adiponectin concen-trations in the third tertile compared with the first tertile across all models. Totalω-6 was posi-tively associated with adiponectin (S1 Table). For each unit increase in totalω-6, individuals were approximately 1.14 times more likely to have serum adiponectin concentrations in the third tertile rather than the first, in all models (Table 3). The D6D EAE was inversely associated with adiponectin (Table 3). Specifically, for each unit increase in D6D, individuals were 0.20 (0.08, 0.53) times as likely in the age-adjusted model, and 0.33 times as likely in the BMI- and WC-adjusted models, to have serum adiponectin concentrations in the third tertile compared with the first.
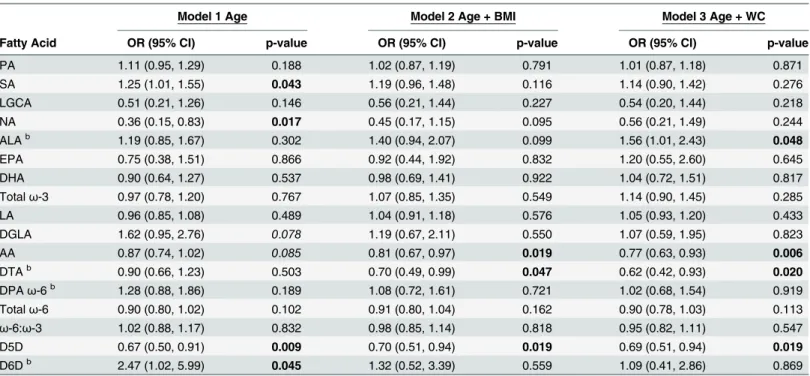
Serum C-peptide concentrations in the second tertile,>1.80 and3.29 ng/mL, were also
significantly associated with FAs, compared with C-peptide concentrations in the first tertile, 1.76 ng/mL (Table 4). Generally, PPL PUFAs were significantly associated with C-peptide only after adjusting for BMI or WC (Table 4). For each unit increase in theω-3 PPL ALA, indi-viduals were 1.56 (1.01. 2.43) times more likely in the Wadjusted model to have serum C-peptide concentrations in the second tertile compared with the first tertile. Theω-6s were also significantly associated with C-peptide only after adjusting for BMI and WC. For each unit increase in PPL AA, individuals were approximately 0.80 times as likely in the BMI- and WC-Table 3. The third tertile of serum adiponectin concentrations is significantly associated with PPL PA, LA, Totalω-6, and D6D EAEa.
Model 1 Age Model 2 Age + BMI Model 3 Age + WC
Fatty Acid OR (95% CI) p-value OR (95% CI) p-value OR (95% CI) p-value
PA 0.78 (0.65, 0.93) 0.006 0.82 (0.68, 0.99) 0.037 0.82 (0.68, 0.99) 0.035
SA 0.85 (0.69, 1.05) 0.129 0.90 (0.72, 1.11) 0.321 0.92 (0.74, 1.15) 0.461
LGCA 1.55 (0.57, 4.22) 0.388 1.24 (0.44, 3.53) 0.687 1.26 (0.44, 3.55) 0.668
NA 1.66 (0.75, 3.69) 0.213 1.18 (0.49, 2.84) 0.714 1.05 (0.43, 2.58) 0.911
ALAb 1.33 (0.92, 1.92) 0.13 1.25 (0.85, 1.84) 0.261 1.24 (0.84, 1.81) 0.281
EPA 1.60 (0.70, 3.64) 0.265 1.32 (0.57, 3.09) 0.519 1.13 (0.48, 2.69) 0.777
DHA 0.99 (0.69, 1.41) 0.949 0.91 (0.63, 1.33) 0.639 0.87 (0.59, 1.27) 0.463
Totalω-3 1.12 (0.89, 1.41) 0.349 1.03 (0.80, 1.33) 0.797 1.00 (0.77, 1.28) 0.979
LA 1.27 (1.10, 1.45) 0.001 1.20 (1.04, 1.39) 0.011 1.20 (1.04, 1.39) 0.011
DGLA 0.62 (0.36, 1.04) 0.069 0.84 (0.48, 1.48) 0.547 0.86 (0.48, 1.52) 0.598
AA 0.93 (0.80, 1.09) 0.361 0.95 (0.81, 1.12) 0.515 0.96 (0.82, 1.13) 0.649
DTAb 0.04 (0.001, 0.92) 0.044 0.16 (0.01, 5.20) 0.304 0.16 (0.01, 4.98) 0.294
DPAω-6b 0.67 (0.46, 0.97) 0.033 0.80 (0.54, 1.18) 0.255 0.79 (0.54, 1.17) 0.243
Totalω-6 1.15 (1.01, 1.30) 0.031 1.13 (0.99, 1.29) 0.070 1.14 (1.01, 1.30) 0.049
ω-6:ω-3 1.05 (0.91, 1.21) 0.546 1.08 (0.92, 1.26) 0.34 1.11 (0.95, 1.29) 0.207
D5D 1.12 (0.86, 1.46) 0.395 1.02 (0.77, 1.34) 0.991 1.03 (0.78, 1.36) 0.827
D6Db 0.20 (0.08, 0.53) 0.001 0.33 (0.12, 0.90) 0.031 0.33 (0.12, 0.92) 0.034
aModels de
fined as: Adiponectin = fatty acid + independent variable(s) next to model number. Fatty acids expressed as percent of total phospholipids. P-values bolded if p0.05 and italicized if 0.05<p0.09.
bOdds ratios calculated on the basis that there is a unit change of 0.1 for the respective beta coef
ficient for each given parameter.
adjusted models, to have serum C-peptide concentrations in the second tertile compared with the first tertile. For each unit increase in PPL DTA, individuals were 0.70 (0.49, 0.99) times as likely in the BMI-adjusted model, and 0.62 (0.42, 0.93) times as likely in the WC-adjusted model, to have serum C-peptide concentrations in the second tertile rather than the first. The D5D EAE was inversely associated with C-peptide across all logistic regression models. For each unit increase in D5D, individuals were approximately 0.69 times as likely to have serum C-peptide concentrations in the second tertile compared with the first tertile, across all models.
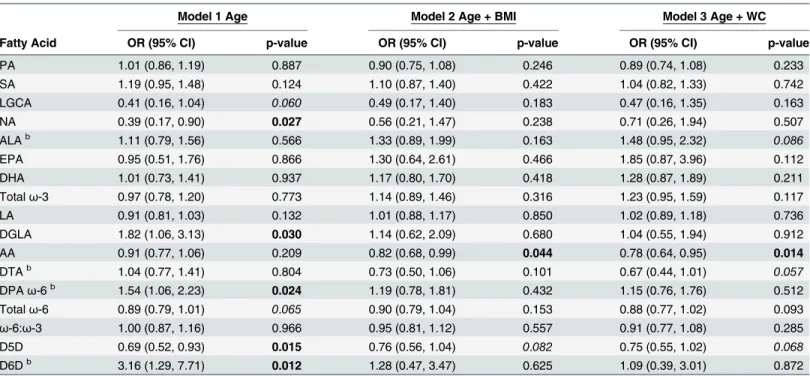
Serum C-peptide concentrations in the third tertile,3.32 ng/mL, were also significantly associated with FAs, compared with C-peptide concentrations in the first tertile,1.76 ng/mL, (Table 5). No PPL SatFAs were associated with the third tertile of C-peptide. PPLω-3 PUFAs were not associated with the third tertile of C-peptide. AA was the onlyω-6 PUFA associated with C-peptide after adjusting for BMI and WC. For each unit increase in AA, individuals were approximately 0.80 times as likely in the BMI- and WC-adjusted models, to have serum C-pep-tide concentrations in the third tertile compared with the first tertile, respectively. The D5D EAE was inversely associated with C-peptide across all logistic regression models. For each unit increase in D5D, individuals were approximately 0.73 times as likely across all models, to have serum C-peptide concentrations in the third tertile compared with the first tertile.
Discussion
In this cross-sectional study, we investigated associations between C-peptide, leptin, and adipo-nectin, and PPL FAs or EAEs in a population of 126 males (>96% Caucasian) ages 48–65.
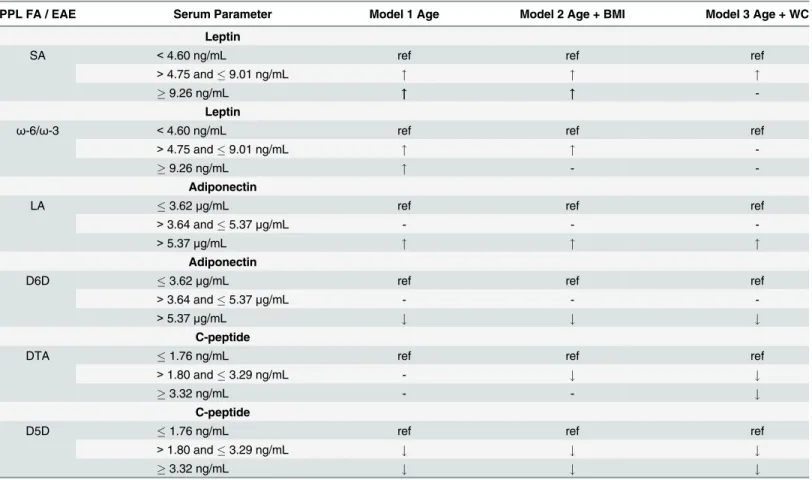
Summaries of our most significant results for leptin, adiponectin, and C-peptide across models are provided inTable 6. Leptin was positively associated with PPL SA and theω-6/ω-3 ratio Table 4. The second tertile of serum C-peptide concentrations is significantly associated with PPL AA, DTA, and D5D EAEa.
Model 1 Age Model 2 Age + BMI Model 3 Age + WC
Fatty Acid OR (95% CI) p-value OR (95% CI) p-value OR (95% CI) p-value
PA 1.11 (0.95, 1.29) 0.188 1.02 (0.87, 1.19) 0.791 1.01 (0.87, 1.18) 0.871
SA 1.25 (1.01, 1.55) 0.043 1.19 (0.96, 1.48) 0.116 1.14 (0.90, 1.42) 0.276
LGCA 0.51 (0.21, 1.26) 0.146 0.56 (0.21, 1.44) 0.227 0.54 (0.20, 1.44) 0.218
NA 0.36 (0.15, 0.83) 0.017 0.45 (0.17, 1.15) 0.095 0.56 (0.21, 1.49) 0.244
ALAb 1.19 (0.85, 1.67) 0.302 1.40 (0.94, 2.07) 0.099 1.56 (1.01, 2.43) 0.048
EPA 0.75 (0.38, 1.51) 0.866 0.92 (0.44, 1.92) 0.832 1.20 (0.55, 2.60) 0.645
DHA 0.90 (0.64, 1.27) 0.537 0.98 (0.69, 1.41) 0.922 1.04 (0.72, 1.51) 0.817
Totalω-3 0.97 (0.78, 1.20) 0.767 1.07 (0.85, 1.35) 0.549 1.14 (0.90, 1.45) 0.285
LA 0.96 (0.85, 1.08) 0.489 1.04 (0.91, 1.18) 0.576 1.05 (0.93, 1.20) 0.433
DGLA 1.62 (0.95, 2.76) 0.078 1.19 (0.67, 2.11) 0.550 1.07 (0.59, 1.95) 0.823
AA 0.87 (0.74, 1.02) 0.085 0.81 (0.67, 0.97) 0.019 0.77 (0.63, 0.93) 0.006
DTAb 0.90 (0.66, 1.23) 0.503 0.70 (0.49, 0.99) 0.047 0.62 (0.42, 0.93) 0.020
DPAω-6b 1.28 (0.88, 1.86) 0.189 1.08 (0.72, 1.61) 0.721 1.02 (0.68, 1.54) 0.919
Totalω-6 0.90 (0.80, 1.02) 0.102 0.91 (0.80, 1.04) 0.162 0.90 (0.78, 1.03) 0.113
ω-6:ω-3 1.02 (0.88, 1.17) 0.832 0.98 (0.85, 1.14) 0.818 0.95 (0.82, 1.11) 0.547
D5D 0.67 (0.50, 0.91) 0.009 0.70 (0.51, 0.94) 0.019 0.69 (0.51, 0.94) 0.019
D6Db 2.47 (1.02, 5.99) 0.045 1.32 (0.52, 3.39) 0.559 1.09 (0.41, 2.86) 0.869
aModels de
fined as: C-peptide = fatty acid + independent variable(s) next to model number. Fatty acids expressed as percent of total phospholipids. P-values bolded if p0.05 and italicized if 0.05<p0.09.
bOdds ratios calculated on the basis that there is a unit change of 0.1 for the respective beta coef
ficient for each given parameter.
(Table 6). However, significant associations between PPL FAs and leptin faded across tertiles, after adjusting for BMI and WC (Table 6). Elevated concentrations of adiponectin were posi-tively associated with PPL LA, and elevated concentrations of adiponectin were inversely asso-ciated with the D6D EAE. C-peptide was inversely assoasso-ciated with PPL DTA and the D5D EAE (Table 6). Together these data indicate specific PPL FAs and EAEs are associated with adi-ponectin and C-peptide concentrations even after adjusting for BMI and WC. These EAEs are generally reflective of FA metabolism, however, they may not completely represent enzyme kinetics in tissues. Therefore, reported altered EAEs could be related to other factors such as diet. We did not directly collect or assess dietary intake in this study, however, we used PPL FAs in our analysis which are correlated with dietary fat intake [26–28]. In addition, we recog-nize that the generalizability of these observations is limited and should be verified in larger populations.
Currently there are no clinically defined biological cutoffs for circulating adiponectin or C-peptide concentrations. However, previous researchers have used tertiles to investigate associa-tions with C-peptide concentraassocia-tions [29] and adiponectin [30] in their study populaassocia-tions. We report PPL FAs and EAE differences were specific to adiponectin tertile. Inflammation sup-presses adiponectin expression and secretion [31].ω-6 PUFAs are considered“ pro-inflamma-tory like”, especially AA derived eicosanoids. AA can be endogenously synthesized through elongation and desaturation of LA. Here we show PPL LA was positively associated with greater adiponectin concentrations (Table 3). Despite mostω-6 PUFAs having an inverse rela-tionship with adiponectin when analyzed individually, totalω-6 PUFAs were positively associ-ated with adiponectin (Table 3andS1 Table). LA is elongated and desaturated to form DGLA, which is dependent on the enzyme D6D. Inflammation is positively associated with the D6D Table 5. The third tertile of serum C-peptide concentrations are significantly associated with PPL AA and D5D EAEa.
Model 1 Age Model 2 Age + BMI Model 3 Age + WC
Fatty Acid OR (95% CI) p-value OR (95% CI) p-value OR (95% CI) p-value
PA 1.01 (0.86, 1.19) 0.887 0.90 (0.75, 1.08) 0.246 0.89 (0.74, 1.08) 0.233
SA 1.19 (0.95, 1.48) 0.124 1.10 (0.87, 1.40) 0.422 1.04 (0.82, 1.33) 0.742
LGCA 0.41 (0.16, 1.04) 0.060 0.49 (0.17, 1.40) 0.183 0.47 (0.16, 1.35) 0.163
NA 0.39 (0.17, 0.90) 0.027 0.56 (0.21, 1.47) 0.238 0.71 (0.26, 1.94) 0.507
ALAb 1.11 (0.79, 1.56) 0.566 1.33 (0.89, 1.99) 0.163 1.48 (0.95, 2.32) 0.086
EPA 0.95 (0.51, 1.76) 0.866 1.30 (0.64, 2.61) 0.466 1.85 (0.87, 3.96) 0.112
DHA 1.01 (0.73, 1.41) 0.937 1.17 (0.80, 1.70) 0.418 1.28 (0.87, 1.89) 0.211
Totalω-3 0.97 (0.78, 1.20) 0.773 1.14 (0.89, 1.46) 0.316 1.23 (0.95, 1.59) 0.117
LA 0.91 (0.81, 1.03) 0.132 1.01 (0.88, 1.17) 0.850 1.02 (0.89, 1.18) 0.736
DGLA 1.82 (1.06, 3.13) 0.030 1.14 (0.62, 2.09) 0.680 1.04 (0.55, 1.94) 0.912
AA 0.91 (0.77, 1.06) 0.209 0.82 (0.68, 0.99) 0.044 0.78 (0.64, 0.95) 0.014
DTAb 1.04 (0.77, 1.41) 0.804 0.73 (0.50, 1.06) 0.101 0.67 (0.44, 1.01) 0.057
DPAω-6b 1.54 (1.06, 2.23) 0.024 1.19 (0.78, 1.81) 0.432 1.15 (0.76, 1.76) 0.512
Totalω-6 0.89 (0.79, 1.01) 0.065 0.90 (0.79, 1.04) 0.153 0.88 (0.77, 1.02) 0.093
ω-6:ω-3 1.00 (0.87, 1.16) 0.966 0.95 (0.81, 1.12) 0.557 0.91 (0.77, 1.08) 0.285
D5D 0.69 (0.52, 0.93) 0.015 0.76 (0.56, 1.04) 0.082 0.75 (0.55, 1.02) 0.068
D6Db 3.16 (1.29, 7.71) 0.012 1.28 (0.47, 3.47) 0.625 1.09 (0.39, 3.01) 0.872
aModels de
fined as: C-peptide = fatty acid + independent variable(s) next to model number. Fatty acids expressed as percent of total phospholipids. P-values bolded if p0.05 and italicized if 0.05<p0.09.
bOdds ratios calculated on the basis that there is a unit change of 0.1 for the respective beta coef
ficient for each given parameter.
enzyme, and inhibiting D6D reduces inflammation [32]. The D6D EAE is reflective of D6D enzyme activity in several tissues, and the D6D EAE is calculated as the ratio of DGLA/LA (reviewed in detail [12]). We have previously shown D6D EAE is highly associated with both BMI and WC [24]. In this study, the third tertile of adiponectin was inversely associated with the D6D EAE after controlling for BMI and WC. This result was expected since individuals with adiponectin concentrations in the third tertile would likely have less inflammation com-pared with those with adiponectin concentrations in the first tertile. Increased D6D activity may promote inflammation in a way, which contributes to inhibiting adiponectin expression and/or decreasing adiponectin concentrations. Future studies should investigate the effects of altered cellular D6D enzyme activity on adiponectin expression and secretion.
Elevated concentrations of PPL AA and D5D EAEs were inversely associated with the sec-ond and third tertile of C-peptide after adjusting for BMI and WC (Tables4and5). The D5D EAE is calculated as the ratio of AA/DGLA (reviewed in detail [12]). Our D5D EAE results indicate as C-peptide concentrations increase there is a greater amount of DGLA relative to AA. However, DGLA was only associated with C-peptide in the age-adjusted model (Table 5). DGLA is considered to be more“anti-inflammatory like”, compared with AA [33]. Decreased Table 6. Summarized logistic regression results of adipokines and C-peptide associations with plasma phospholipid fatty acids and enzymes activity estimates.
PPL FA / EAE Serum Parameter Model 1 Age Model 2 Age + BMI Model 3 Age + WC
Leptin
SA <4.60 ng/mL ref ref ref
>4.75 and9.01 ng/mL " " "
9.26 ng/mL """ """
-Leptin
ω-6/ω-3 <4.60 ng/mL ref ref ref
>4.75 and9.01 ng/mL " "
9.26 ng/mL " -
-Adiponectin
LA 3.62μg/mL ref ref ref
>3.64 and5.37μg/mL - -
->5.37μg/mL " " "
Adiponectin
D6D 3.62μg/mL ref ref ref
>3.64 and5.37μg/mL - -
->5.37μg/mL # # #
C-peptide
DTA 1.76 ng/mL ref ref ref
>1.80 and3.29 ng/mL - # #
3.32 ng/mL - - #
C-peptide
D5D 1.76 ng/mL ref ref ref
>1.80 and3.29 ng/mL # # #
3.32 ng/mL # # #
Serum parameters are bolded, followed by concentrations for tertile 1, 2, and 3 for each respective adipokine or C-peptide. Ref indicates reference category used in the logistic regression model."represents increased odds and#represents decreased odds, compared with the reference category, and are only provided if the p-value0.09.
A–indicates no difference compared with the reference category
AA production would limit the substrate availability of AA for pro-inflammatory eicosanoid biosynthesis or elongation to form longer chainω-6s (i.e. DTA). We report PPL DTA was inversely associated with C-peptide concentrations after adjusting for BMI and WC (Tables4
and5). From our point of view, the PPL DTA observation strengthens our speculation that FA
metabolism (i.e. D5D) is altered in individuals with elevated C-peptide concentrations. In this study we identify new relationships between C-peptide and D5D EAEs. What is unique about our current study is we associate C-peptide with D5D EAEs in a population of obese adults. Previous research has shown D5D EAEs are inversely associated with obesity, insulin resistance, T2D, and metabolic syndrome (reviewed in detail [12]). Our patient exclusion criteria excluded individuals with T2D. We initially speculated that the inverse relationship with C-peptide and D5D EAEs was likely due to underlying obesity-associated inflammation, since inflammation (i.e. TNF-α) alters insulin downstream signaling [16].
However, C-peptide concentrations were inversely associated with D5D EAEs after
adjust-ing for age and TNF-α(data not shown). We have previously reported inflammatory factors
such as TNF-αare highly correlated to BMI [24]. Therefore, TNF-αcould not be analyzed
in BMI and WC adjusted models due to multicollinearity with these anthropometric
mea-surements. We found that TNF-αwas not correlated with D5D EAEs (p-value = 0.9, data
not shown), but TNF-αwas positively correlated with C-peptide (p<0.001, data not shown).
This led us to speculate C-peptide could be a potential regulator of D5D enzyme activity or expression.
Insulin functions in regulating D5D and D6D enzyme expression (reviewed in detail [34]). For instance, in insulin-dependent (i.e. type-1-diabetes (T1D)) animal models, D5D and D6D mRNA increase after insulin injections [35]. However, desaturase enzymes are not altered in T2D models, thus, the results are not consistent with T1D models. Montanaro et al reported there are no alterations to D5D and D6D mRNA or EAEs in insulin-indepen-dent (i.e. T2D) animals compared with control animals [36]. There is an overwhelming amount of human data associating increased D6D EAEs and decreased D5D EAES with obe-sity, insulin resistance, T2D, and metabolic syndrome (reviewed in detail [12]). One differ-ence between T1D and T2D models is the endogenous production of pro-insulin and, thus, C-peptide. The lack of C-peptide in T1D models may account for increases in D5D mRNA and EAEs that were observed after insulin injections. Recent findings suggest C-peptide is able to activate signaling pathways associated with FA metabolism, independent of insulin [37]. Therefore, greater concentrations of C-peptide could be suppressing D5D enzyme activity or expression, which would explain why numerous researchers report D5D EAEs are inversely associated with obesity, insulin resistance, T2D, and metabolic syndrome (reviewed in detail [12]). Thus, it is possible C-peptide may function in regulating D5D enzyme activity. Future studies should investigate whether D5D inhibition may occur through a C-peptide mediated pathway.
Supporting Information
S1 Table. Plasma phospholipid fatty acids and enzyme activity estimates are associated with serum adipokines and C-peptide.
(DOCX)
Acknowledgments
Author Contributions
Conceived and designed the experiments: CAP JIF. Performed the experiments: CAP. Ana-lyzed the data: CAP KM. Contributed reagents/materials/analysis tools: JIF. Wrote the paper: CAP KM JIF.
References
1. Ogden CL, Carroll MD, Kit BK, Flegal KM. Prevalence of childhood and adult obesity in the United States, 2011–2012. JAMA: the journal of the American Medical Association. 2014; 311(8):806–14. doi: 10.1001/jama.2014.732PMID:24570244.
2. Makki K, Froguel P, Wolowczuk I. Adipose tissue in obesity-related inflammation and insulin resistance: cells, cytokines, and chemokines. ISRN inflammation. 2013; 2013:139239. doi:10.1155/2013/139239
PMID:24455420; PubMed Central PMCID: PMC3881510.
3. Warensjo E, Rosell M, Hellenius ML, Vessby B, De Faire U, Riserus U. Associations between esti-mated fatty acid desaturase activities in serum lipids and adipose tissue in humans: links to obesity and insulin resistance. Lipids in health and disease. 2009; 8:37. doi:10.1186/1476-511X-8-37PMID:
19712485; PubMed Central PMCID: PMC2746208.
4. Considine RV, Sinha MK, Heiman ML, Kriauciunas A, Stephens TW, Nyce MR, et al. Serum immunore-active-leptin concentrations in normal-weight and obese humans. The New England journal of medi-cine. 1996; 334(5):292–5. doi:10.1056/NEJM199602013340503PMID:8532024.
5. Myers MG Jr., Leibel RL, Seeley RJ, Schwartz MW. Obesity and leptin resistance: distinguishing cause from effect. Trends in endocrinology and metabolism: TEM. 2010; 21(11):643–51. doi:10.1016/j.tem. 2010.08.002PMID:20846876; PubMed Central PMCID: PMC2967652.
6. Staiger H, Kaltenbach S, Staiger K, Stefan N, Fritsche A, Guirguis A, et al. Expression of adiponectin receptor mRNA in human skeletal muscle cells is related to in vivo parameters of glucose and lipid metabolism. Diabetes. 2004; 53(9):2195–201. PMID:15331527.
7. Weyer C, Funahashi T, Tanaka S, Hotta K, Matsuzawa Y, Pratley RE, et al. Hypoadiponectinemia in obesity and type 2 diabetes: close association with insulin resistance and hyperinsulinemia. The Jour-nal of clinical endocrinology and metabolism. 2001; 86(5):1930–5. doi:10.1210/jcem.86.5.7463PMID: 11344187.
8. Pham MN, Kolb H, Mandrup-Poulsen T, Battelino T, Ludvigsson J, Pozzilli P, et al. Serum adipokines as biomarkers of beta-cell function in patients with type 1 diabetes: positive association with leptin and resistin and negative association with adiponectin. Diabetes/metabolism research and reviews. 2013; 29(2):166–70. doi:10.1002/dmrr.2378PMID:23197433.
9. Horwitz DL, Starr JI, Mako ME, Blackard WG, Rubenstein AH. Proinsulin, insulin, and C-peptide con-centrations in human portal and peripheral blood. The Journal of clinical investigation. 1975; 55 (6):1278–83. doi:10.1172/JCI108047PMID:1133173; PubMed Central PMCID: PMC301883. 10. Kang JX, Weylandt KH. Modulation of inflammatory cytokines by omega-3 fatty acids. Sub-cellular
bio-chemistry. 2008; 49:133–43. doi:10.1007/978-1-4020-8831-5_5PMID:18751910.
11. Tunstall RJ, Mehan KA, Wadley GD, Collier GR, Bonen A, Hargreaves M, et al. Exercise training increases lipid metabolism gene expression in human skeletal muscle. American journal of physiology Endocrinology and metabolism. 2002; 283(1):E66–72. doi:10.1152/ajpendo.00475.2001PMID: 12067844.
12. Kroger J, Schulze MB. Recent insights into the relation of Delta5 desaturase and Delta6 desaturase activity to the development of type 2 diabetes. Current opinion in lipidology. 2012; 23(1):4–10. doi:10. 1097/MOL.0b013e32834d2dc5PMID:22123669.
13. Phillips CM, Kesse-Guyot E, McManus R, Hercberg S, Lairon D, Planells R, et al. High dietary satu-rated fat intake accentuates obesity risk associated with the fat mass and obesity-associated gene in adults. The Journal of nutrition. 2012; 142(5):824–31. doi:10.3945/jn.111.153460PMID:22457394. 14. Perreault M, Zulyniak MA, Badoud F, Stephenson S, Badawi A, Buchholz A, et al. A distinct fatty acid
profile underlies the reduced inflammatory state of metabolically healthy obese individuals. PloS one. 2014; 9(2):e88539. doi:10.1371/journal.pone.0088539PMID:24520395; PubMed Central PMCID: PMC3919777.
15. Boden G. Free fatty acids (FFA), a link between obesity and insulin resistance. Frontiers in bioscience: a journal and virtual library. 1998; 3:d169–75. PMID:9450985.
17. Min Y, Lowy C, Islam S, Khan FS, Swaminathan R. Relationship between red cell membrane fatty acids and adipokines in individuals with varying insulin sensitivity. European journal of clinical nutrition. 2011; 65(6):690–5. doi:10.1038/ejcn.2011.19PMID:21386858.
18. Antuna-Puente B, Feve B, Fellahi S, Bastard JP. Adipokines: the missing link between insulin resis-tance and obesity. Diabetes & metabolism. 2008; 34(1):2–11. doi:10.1016/j.diabet.2007.09.004PMID: 18093861.
19. Comstock SS, Hortos K, Kovan B, McCaskey S, Pathak DR, Fenton JI. Adipokines and obesity are associated with colorectal polyps in adult males: a cross-sectional study. PloS one. 2014; 9(1):e85939. doi:10.1371/journal.pone.0085939PMID:24465801; PubMed Central PMCID: PMC3895019.
20. Comstock SS, Xu D, Hortos K, Kovan B, McCaskey S, Pathak DR, et al. Association of insulin-related serum factors with colorectal polyp number and type in adult males. Cancer epidemiology, biomarkers & prevention: a publication of the American Association for Cancer Research, cosponsored by the American Society of Preventive Oncology. 2014; 23(9):1843–51. doi: 10.1158/1055-9965.EPI-14-0249-TPMID:24962837; PubMed Central PMCID: PMC4155017.
21. Rose HG, Oklander M. Improved Procedure for the Extraction of Lipids from Human Erythrocytes. Jour-nal of lipid research. 1965; 6:428–31. PMID:14336214.
22. Agren JJ, Julkunen A, Penttila I. Rapid separation of serum lipids for fatty acid analysis by a single ami-nopropyl column. Journal of lipid research. 1992; 33(12):1871–6. PMID:1479296.
23. Burdge GC, Wright P, Jones AE, Wootton SA. A method for separation of phosphatidylcholine, triacyl-glycerol, non-esterified fatty acids and cholesterol esters from plasma by solid-phase extraction. The British journal of nutrition. 2000; 84(5):781–7. PMID:11177194.
24. Pickens CA, Sordillo LM, Comstock SS, Harris WS, Hortos K, Kovan B, et al. Plasma phospholipids, non-esterified plasma polyunsaturated fatty acids and oxylipids are associated with BMI. Prostaglan-dins, leukotrienes, and essential fatty acids. 2014. doi:10.1016/j.plefa.2014.12.001PMID:25559239.
25. Gurzell EA, Wiesinger JA, Morkam C, Hemmrich S, Harris WS, Fenton JI. Is the omega-3 index a valid marker of intestinal membrane phospholipid EPA+DHA content? Prostaglandins, leukotrienes, and essential fatty acids. 2014. doi:10.1016/j.plefa.2014.04.001PMID:24913088.
26. Matthan NR, Ooi EM, Van Horn L, Neuhouser ML, Woodman R, Lichtenstein AH. Plasma phospholipid fatty acid biomarkers of dietary fat quality and endogenous metabolism predict coronary heart disease risk: a nested case-control study within the Women's Health Initiative observational study. Journal of the American Heart Association. 2014; 3(4). doi:10.1161/JAHA.113.000764PMID:25122663; PubMed Central PMCID: PMC4310362.
27. Thiebaut AC, Rotival M, Gauthier E, Lenoir GM, Boutron-Ruault MC, Joulin V, et al. Correlation between serum phospholipid fatty acids and dietary intakes assessed a few years earlier. Nutrition and cancer. 2009; 61(4):500–9. doi:10.1080/01635580802710717PMID:19838922.
28. Saadatian-Elahi M, Slimani N, Chajes V, Jenab M, Goudable J, Biessy C, et al. Plasma phospholipid fatty acid profiles and their association with food intakes: results from a cross-sectional study within the European Prospective Investigation into Cancer and Nutrition. The American journal of clinical nutrition. 2009; 89(1):331–46. doi:10.3945/ajcn.2008.26834PMID:19056549.
29. Kurotani K, Sato M, Ejima Y, Nanri A, Yi S, Pham NM, et al. High levels of stearic acid, palmitoleic acid, and dihomo-gamma-linolenic acid and low levels of linoleic acid in serum cholesterol ester are associ-ated with high insulin resistance. Nutrition research. 2012; 32(9):669–75 e3. doi:10.1016/j.nutres. 2012.07.004PMID:23084639.
30. Wang J, Li H, Franco OH, Yu Z, Liu Y, Lin X. Adiponectin and metabolic syndrome in middle-aged and elderly Chinese. Obesity. 2008; 16(1):172–8. doi:10.1038/oby.2007.42PMID:18223631.
31. Ouchi N, Walsh K. Adiponectin as an anti-inflammatory factor. Clinica chimica acta; international jour-nal of clinical chemistry. 2007; 380(1–2):24–30. doi:10.1016/j.cca.2007.01.026PMID:17343838;
PubMed Central PMCID: PMC2755046.
32. Obukowicz MG, Welsch DJ, Salsgiver WJ, Martin-Berger CL, Chinn KS, Duffin KL, et al. Novel, selec-tive delta6 or delta5 fatty acid desaturase inhibitors as antiinflammatory agents in mice. The Journal of pharmacology and experimental therapeutics. 1998; 287(1):157–66. PMID:9765335.
33. Funk CD. Prostaglandins and leukotrienes: advances in eicosanoid biology. Science. 2001; 294 (5548):1871–5. doi:10.1126/science.294.5548.1871PMID:11729303.
34. Brenner RR. Hormonal modulation of delta6 and delta5 desaturases: case of diabetes. Prostaglandins, leukotrienes, and essential fatty acids. 2003; 68(2):151–62. PMID:12538079.
36. Montanaro MA, Rimoldi OJ, Igal RA, Montenegro S, Tarres MC, Martinez SM, et al. Hepatic delta9, delta6, and delta5 desaturations in non-insulin-dependent diabetes mellitus eSS rats. Lipids. 2003; 38 (8):827–32. PMID:14577661.