www.atmos-chem-phys.org/acp/3/2173/
Chemistry
and Physics
A model of HDO in the tropical tropopause layer
A. E. Dessler1and S. C. Sherwood2
1Earth Systems Science Interdisciplinary Center, University of Maryland, College Park, USA 2Department of Geology and Geophysics, Yale University, New Haven, CT, USA
Received: 11 June 2003 – Published in Atmos. Chem. Phys. Discuss.: 29 August 2003 Revised: 24 November 2003 – Accepted: 30 November 2003 – Published: 8 December 2003
Abstract. Any theory of water vapor in the tropical tropopause layer (TTL) must explain both the abundance and isotopic composition of water there. In previous papers, we presented a model of the TTL that simulated the abundance of water vapor as well as the details of the vertical profile. That model included the effects of “overshooting” convec-tion, which injects dry air directly into the TTL. Here, we present results for the model after modifying it to include water’s stable isotopologue HDO (where D represents deu-terium, 2H). We find that the model predicts a nearly uni-form HDO depletion throughout the TTL, in agreement with recent measurements. This occurs because the model de-hydrates by dilution, which does not fractionate, instead of by condensation. Our model shows that this dehydration by dilution is consistent with other physical constraints on the system. We also show the key role that lofted ice plays in determining the abundance of HDO in the TTL. Such lofted ice requires a complementary source of dry air in the TTL; without that, the TTL will rapidly saturate and the lofted ice will not evaporate.
1 Introduction
In recent years, much progress has been made on the coupled questions of how mass is transported from the troposphere to the stratosphere and how this air is dehydrated to the low mixing ratios of the stratosphere. In particular, it has become apparent that rather than think of the tropopause as an in-finitely thin surface, it is better to think of the troposphere and stratosphere as being separated by a layer several kilo-meters thick (Atticks and Robinson, 1983; Highwood and Hoskins, 1998). Sherwood and Dessler (2000, 2001, here-after SD00 and SD01) defined this layer, often referred to as
Correspondence to:A. E. Dessler ([email protected])
the tropical tropopause layer (hereafter, TTL), to run from approximately 14 to 19 km (∼140 to∼70 hPa).
Air is transported into the TTL directly from the planetary boundary layer (PBL) by convection. Only a small fraction of all convection detrains at such high altitudes (e.g. Folkins et al., 1999), but it is still enough to have an important impact on the composition of the region (Dessler, 2002). Once in the TTL, the air rises as part of the mean overturning strato-spheric circulation, slowly ascending across the top of the TTL and into the stratosphere. Air passing through the bot-tom of the TTL in convective updrafts contains several tens of ppmv of water in vapor and condensate, while air slowly rising through the top of the TTL and into the stratosphere contains (on average) 3.85 ppmv of water (Dessler and Kim, 1999; SPARC, 2000). Clearly, dehydration mechanisms in the TTL are removing the majority of the water that enters this region.
Over the past two decades, two competing concepts of this dehydration mechanism have emerged. The first, which we call “convective dehydration,” posits that air emerges from convection fully dehydrated (on average) to stratospheric val-ues. In this theory, the cold temperatures necessary to gen-erate stratospheric humidities occur in “overshooting” con-vection (Johnston and Solomon, 1979), so called because this convection rises above or overshoots its level of neu-tral buoyancy (LNB), typically near 14 km (Folkins, 2002). SD01 used a simple model of the TTL to show how over-shooting convection could produce the observed water vapor and ozone distributions throughout the TTL.
25
-1000 -800 -600 -400
HDO depletion (‰) 5
6
7
8
9 100
2
3
P
res
s
u
re
(h
P
a
)
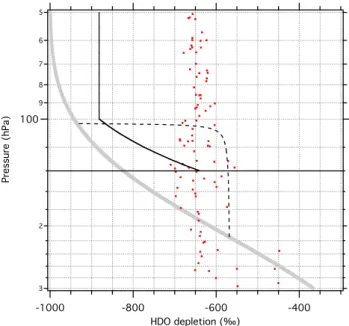
Fig. 1.HDO depletionδD (‰) in the vapor vs. altitude (hPa). The thick gray line is the Rayleigh curve, calculated for a parcel as-cending from the surface pseudoadiabatically (see text). The dots are the ATMOS data in the TTL (Kuang et al., 2003), with the ef-fects of methane oxidation removed. The dashed line is a mixing line between saturated parcels at 210 and 100 hPa, with initial HDO abundances set by the Rayleigh curve at these altitudes. The thin solid line is a calculation of TTL depletion as a result of in situ con-densation, for air beginning with the observed depletion at the base of the TTL.
2001; Jensen et al., 2001). These cold events arise for a num-ber of reasons, such as radiative cooling above deep convec-tion (Hartmann et al., 2001) or atmospheric waves (Boehm and Verlinde, 2000; Potter and Holton, 1995), to name just two.
Both convective and gradual dehydration theories accu-rately predict many of the details of the water vapor distri-bution in the TTL and lower stratosphere (SD01, Holton and Gettelman, 2001). In the last few years, however, it has be-come apparent that the abundance of water’s isotopologues might be able to discriminate between these theories.
2 Isotopes
The abundance of deuterium in water in a sample is typically expressed as a deviation from a standard, with units of per mil:
δD=1000
([
D]/[H])SAMPLE
([D]/[H])SMOW −1
, (1)
where[D]/[H]is the ratio of the abundance of deuterium to hydrogen.(...)SAMPLEis the value of this ratio in the sample, while(...)SMOWdenotes the value in Standard Mean Ocean Water, in this case 1.558×10⁻⁴(based on the data in Hage-mann et al., 1970). Except where noted, the sample is the
water in the vapor phase of the parcel. It should be noted that Eq. (1) can also be written as a function of the ratio [HDO]/[H2O]; in that case, the standard value is twice the value used here. Thus,δD can be thought of as a measure of the ratio of[HDO]/[H2O]. Processes that increase or de-crease H2O and HDO in the same proportion (such as the injection of dry air into a parcel) do not changeδD. Conden-sation, on the other hand, preferentially removes the heavy isotopologues and therefore leads to decreases (“depletions”) inδD.
In a Rayleigh distillation process, condensate forms at 100% RH and in equilibrium with the vapor. The conden-sate is therefore enriched in deuterium with respect to the initial vapor, while the remaining vapor is depleted. After formation, condensate is immediately removed. As conden-sation continues in this hypothetical parcel, new condensate will be in equilibrium with the now-depleted vapor, and the vapor will continue isotopically lightening. The equation de-scribing this is:
dlnR=(α−1)dlnq, (2)
whereR = [HDO]/[H2O]in the vapor,q is the abundance of H2O vapor andαis the temperature-dependent fractiona-tion factor. The vertical profile ofδD obtained by integrating Eq. (2), assuming a hypothetical saturated air parcel rising through the troposphere, is known as the “Rayleigh curve.”
Moyer et al. (1996) first pointed out that the HDO abun-dance in the stratosphere is higher than predicted by a Rayleigh distillation process, or, as one might say, is “under-depleted”. They hypothesized that lofting of ice formed at lower altitudes (which would be isotopically heavy) fol-lowed by evaporation of the ice near the tropopause, could explain the under-depletion. They also speculated that non-equilibrium effects might be responsible. Keith (2000) con-sidered both HDO and H182 O and concluded that the non-equilibrium effects could not explain the simultaneous under-depletion of both D and 18O. He also showed a calcula-tion demonstrating that ice lofting could plausibly explain the HDO under-depletion.
Both Moyer et al. (1996) and Keith (2000) assumed air entering the stratosphere experiences a single temperature-pressure history, neglecting the possibility of mixing between air masses in the TTL having experienced different histories. It has been noted, however, that mixing of unlike air masses will necessarily lead to under-depletion because of the curva-ture of the Rayleigh fractionation vs. H2O saturation vapor pressure relation (Eriksson, 1965; Gedzelman, 1988).
To see this, consider mixing between two parcels. The water vapor mixing ratio in the mixed parcel is the weighted average of the mixing ratios of the initial parcels,
f[H2O]1+(1−f )[H2O]2, wheref is the mixing fraction.
average:
δDmix=1000
f[D]1+(1−f)[D]2
f[H]1+(1−f)[H]2
, [D]
[H]
SMOW
!
−1
!
. (3)
This is shown graphically in Fig. 1: on this plot are the Rayleigh curve (gray line) and a mixing line between sat-urated parcels at 210 hPa and 100 hPa (dashed line). As suggested by Eq. (3), the mixing line is not straight in this coordinate system, and mixing between two parcels on the Rayleigh curve necessarily creates an under-depleted parcel. Also note that because the parcel at 210 hPa has much higher mixing ratios of H2O and HDO than the 100-hPa parcel, the depletion of the mixed parcel is nearly equal to the deple-tion in the 210-hPa parcel until the mixture is almost entirely comprised of the 100-hPa parcel; e.g. on the mixing line in Fig. 1, the sharp bend occurs at a mixture of 95% 100-hPa parcel and 5% 210-hPa parcel. Using a simple two-level model of the TTL, Johnson et al. (2001a) argued that this process alone could account for HDO under-depletion in the stratosphere.
3 Model
In this paper, we adapt SD01’s model of the TTL to inves-tigate HDO, one of H2O’s stable isotopologues, in the TTL. SD01 showed that the model was capable of simulating aver-age H2O, O3gradients, and energy balance in the TTL. In a recent paper (Sherwood and Dessler, 2003), it is shown that the model can also produce realistic seasonal variations in CO2and H2O in the lower stratosphere.
Briefly, the model divides the TTL into two regions, rep-resenting (1) a region of convective overshooting where con-vection penetrates into the TTL and (2) a “capped” region with no convection reaching the TTL. The two regions are each represented by a one-dimensional model, which are coupled together by a large-scale diabatic circulation and by parameterized isentropic mixing (a minor error in the isen-tropic mixing parameterization from SD01 was found and corrected for this study, which led to small (<10%) changes in water vapor). The diabatic circulation includes a strato-spheric “drain” (i.e. sinking) in the overshooting region in accord with the calculations of Sherwood (2000). The tem-perature profile in each region is specified from radiosonde observations during the season being simulated; the tempera-ture profile in the overshooting region is the mean of observa-tions from the Indonesian convection region, while tempera-tures in the capped region are the mean from Natal, Brazil. For more details, see SD01.
At each time step, the model simulates convective penetra-tion into the overshooting region of the TTL. Each convec-tive event is assigned a random value of convecconvec-tive available potential energy (CAPE). The parcels are assumed to remain moist adiabatic and saturated during convection, with ice wa-ter content assumed to be four times the H2O vapor content.
0.06 0.05 0.04 0.03 0.02 0.01 0.00
Total water detrainment rate (ppmv/day) 140
120 100 80 60
P (h
Pa
)
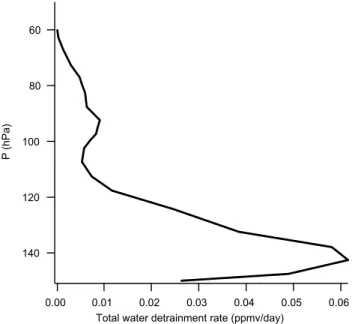
Fig. 2. Total water (vapor + ice) detrainment rate (ppmv/day) as a function of pressure (hPa). This quantity is detrainment mass flux (kg/hPa/day) times water mixing ratio (ppmv) divided by mass on that level (kg/hPa).
The remainder of the ice is assumed to have fallen out of the TTL. The value of four for the ice/water ratio was set in SD01 in order to generate stratospheric humidity in agreement with measurements. There is a detailed discussion of the model, including sensitivity studies, in SD01. In particular, we will show that the important aspects of the simulations of HDO are not sensitive to the choice of ice/water ratio.
Parcels are assumed to mix uniformly into the environ-ment between the level of neutral buoyancy of the convec-tion, which we assume is 140 hPa, and the level of maximum overshoot, which is determined from the value of CAPE as-signed to that event. After mixing with ambient TTL air, the resulting mixed parcel is negatively buoyant and will descend to the level of neutral buoyancy. There the overshooting par-cel mixes both vapor and ice into the environment; no inser-tion of air occurs above this level. The combinainser-tion of mix-ing of the convectmix-ing air with dry ambient air and subsequent warming due to adiabatic descent means that the resulting de-training air is subsaturated. It is important to remember that the altitude where the parcels mix and the altitude where they detrain are different, with the mixing altitude being higher.
is determined by how high (and therefore, how cold) the par-cel gets prior to mixing and detrainment – the lower the al-titude that a parcel mixes and detrains in the TTL, the more water the parcel carries into the TTL. This can be seen in Fig. 2, which is a plot of the rate of water detrainment from convection. As one can see, injection of water into the TTL is indeed sharply peaked near the bottom of the TTL. The injection of mass is also weighted toward the bottom of the TTL, but much less strongly than water vapor (see Fig. 1 of Sherwood and Dessler (2003) for the plot of mass detrain-ment rate).
Air near the bottom of the TTL is relatively moist com-pared to the stratosphere, with mixing ratios of ∼10– 20 ppmv (e.g. Fig. 6 of SD01). As TTL air rises towards the stratosphere, deeper convecting parcels, which have experi-enced colder temperatures and therefore carry lower water abundances, detrain into the air mass. This dehydrates the TTL and keeps it below saturation, so no condensation oc-curs (outside convection) in the TTL. The water in the TTL is in the form of both ice and vapor; this ice is assumed to have zero fall velocity and to sublimate with a time constant of one day. Because one day≪ dynamic time constants, one can consider evaporation of ice to be essentially instan-taneous, except for the transport of small cloud amounts to the other model region. We ignore in situ formation of cir-rus clouds, which others have suggested might be important in TTL water regulation (e.g. Danielsen, 1982; Jensen et al., 1996, 2001). The importance of this process is still debated, although our work here and in SD01 has shown that cirrus dehydration might not be necessary to understand the water budget of the TTL.
The SD01 model contained a number of tunable parame-ters. The amount of overshooting convection was tuned so that cooling in the TTL balanced the compressional heating diagnosed from the stratospheric “drain” calculations. The vertical profile of parcel mixing was specified arbitrarily as uniform in pressure, though an alternate case was consid-ered in which the profile decreased with height. The mixing between updrafts and their environment was prescribed fol-lowing Emanuel (1991). The amount of ice retained in over-shoots (a factor of four in SD01) prior to mixing was tuned to produce the correct moisture at the top of the TTL. The isen-tropic horizontal mixing rate, a constant, was tuned to give appropriate humidity below the TTL. All of this tuning was done in a permanent December-January-February (DJF) run, the only condition simulated in that study.
The SD01 model performed well in reproducing key de-tails in the time-average DJF vertical profiles of water vapor, ozone, and cloud ice within the TTL. Importantly, SD01 con-firmed that these features were not strongly sensitive to the parameter values or assumed circulation (for a thorough dis-cussion, see SD01, Sect. 4.d). We will show below that key results on the abundance of HDO are similarly not sensitive to the tunable parameters in the model, but are a fundamental property of our dehydration theory.
4 Modeling isotopes
The standard statement of Rayleigh distillation assumes that condensate is immediately removed after formation. If, how-ever, the condensate is ice, then the slow rate of diffusion within ice suggests that as long as the ice doesn’t evaporate, it will not affect the composition of the vapor even if it remains in the parcel. As a result, we will assume that the abundance of HDO vapor in a convecting parcel can be described by the Rayleigh curve. Our model uses standard HDO equi-librium fractionation factors (Merlivat and Nief, 1967; Ma-joube, 1971). We use the fractionation factor for liquid water
forT >273 K and that for ice for lower temperatures.
One way to explain the observed HDO under-depletion is to suppose that condensation occurs in a supersaturated en-vironment. In this situation, loss of HDO to the condensate is limited by diffusion of HDO to the particles’ surface and less depletion occurs than is predicted by Rayleigh behavior. Both Keith (2000) and Johnson et al. (2001a) looked into this as a possible explanation, and both rejected it, because while supersaturation helped explain stratospheric HDO, it worsened agreement between measurements and model for H182 O. Because of this prior work, as well as a lack of knowl-edge of what the magnitude of supersaturation one might find in cumulus convection, we will not consider supersaturation further. Clearly, this is a subject for future work when more data become available.
Another key assumption in the model is the abundance of deuterium in the ice (hereafter, δDice). There are no mea-surements ofδDice near the tropical tropopause, so it is not obvious how to describe this parameter in the model. We will test several ways of specifying of this quantity, and show that key results are insensitive to which one we select.
The SD01 model had a small source of water (5 ppbv/day) in the TTL to account for oxidation of methane (SD01, Sect. 3.d). A small fraction of atmospheric methane is deuterated and oxidation of these molecules would act as a minor source of HDO. The measurements of HDO to which we will be comparing have this source of HDO subtracted out. In order to make comparisons consistent between these data and our model, we will therefore not include in our model any production of H2O or HDO from methane oxi-dation.
As in SD01, the simulations presented in this paper are permanent DJF conditions. Permanent June-July-August re-sults (not shown) are similar except for a small increase in
5 Data
There are few observations ofδD in the upper troposphere and stratosphere to compare against our model, but those that exist paint a consistent picture. Mid-latitude in situ air-craft observations by Ehhalt (cited in Gedzelman, 1988) and Smith (1992) showed under-depletion in the upper tropo-sphere. Measurements of H2O, CH4, and their isotopologues in the middle stratosphere have also been used to infer the global and annual averageδD of air entering the stratosphere. These measurements also show under-depletion, with values of−670±70‰ (Moyer et al., 1996) and−679±20‰ (John-son et al., 2001b) forδD entering the stratosphere.
Spectra measured by the Atmospheric Trace Molecule Spectroscopy (ATMOS) experiment (Gunson et al., 1996) have been reprocessed to retrieve δD throughout the TTL (Kuang et al., 2003). These data, which are plotted in Fig. 1, show a nearly constantδD profile (after removal of methane oxidation) near−650‰, close to the stratospheric values in-ferred by others, from the stratosphere all the way down to ∼12 km, below whichδD increases.
Recent in situ measurements obtained during NASA’s CRYSTAL-FACE mission show a large variability of iso-topic depletion in the TTL (C. Webster, personal communi-cation, 2003). It is unclear how to interpret comparisons be-tween these point measurements, virtually all obtained near convection, and our model, which simulates the tropical av-erage. More work on this issue will be undertaken when final versions of these data become available.
6 Model simulations
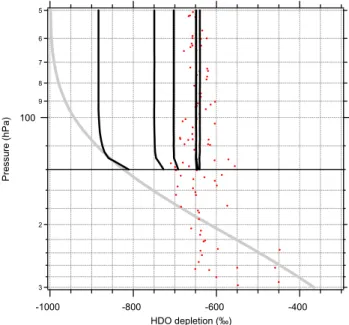
Simulations of HDO depletionδD are shown in Fig. 3. In these simulations, we assign a constantδDice of−565‰ to the retained ice and vary the amount of retained ice in the convecting parcels prior to mixing (sensitivities toδDicewill be discussed below). The far left line has no retained ice, with lines lying progressively to the right retaining ice equal to one, two, four, six, and eight times vapor. Also shown are the ATMOS data (Kuang et al., 2003).
Much like the ATMOS data, our model shows near-constant values ofδD throughout the TTL for all values of retained ice. As discussed above (see Fig. 2), most of the water enters the TTL near the bottom of the TTL. δD in the bottom of the TTL is therefore determined by the com-bination of the Rayleigh curve (which determined the de-pletion of the vapor), δDice, and amount of ice retained. As the air rises toward the stratosphere, dehydration in our model occurs through injection of dry air. From Eq. (1), we see that isotopic depletion is really a measure of the ra-tio of[HDO]/[H2O], so this injection of dry air, which re-duces HDO and H2O in equal proportions, does not change the ratio of [HDO]/[H2O], and therefore does not change
δD. Thus, the isotopic composition of air at the bottom of
-1000 -800 -600 -400
HDO depletion (‰) 5
6
7
8
9
100
2
3
Pre
ssu
re
(h
Pa
)
Fig. 3. HDO depletionδD (‰) in the vapor vs. altitude (hPa) for several simulations; each result is an average ofδD in the two re-gions of the model. The thick black curves are runs with retained ice equal to (from left to right) zero, one, two, four, six, and eight times vapor. For all runs,δDicewas set to−565‰. These runs have no methane oxidation in them. The dots are the ATMOS data in the TTL (Kuang et al., 2003), also with the effects of methane oxidation removed. The thick gray line is the Rayleigh curve, calculated for a parcel ascending from the surface pseudoadiabatically (see text).
the TTL determines the isotopic composition throughout the TTL in our model. As we will show shortly, using different values ofδDice does shift the lines to the left and right, but still produces near-zero gradients inδD. As a result, we con-clude that this near-zero gradient is a general property of our model, and is in good qualitative agreement with the avail-able TTL data.
28
-1000 -800 -600 -400
HDO depletion (‰) 5
6
7
8
9 100
2
3
P
res
s
u
re
(h
P
a
)
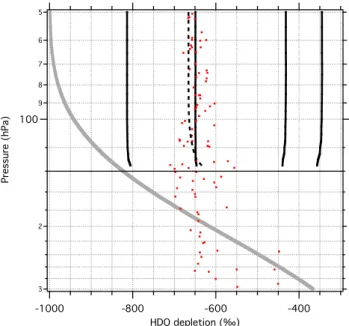
Fig. 4. HDO depletionδD (‰) in the vapor vs. altitude (hPa) for several simulations; each result is an average ofδD in the two re-gions of the model. The thick black curves are runs withδDiceset to−750‰,−565‰,−314‰, and−160‰. The dashed line is a run withδDiceequal to the Rayleigh curve at an altitude 3.5 km below the mixing altitude of the parcel. These runs have no methane ox-idation in them. The dots are the ATMOS data in the TTL (Kuang et al., 2003), also with the effects of methane oxidation removed. The thick gray line is the Rayleigh curve, calculated for a parcel ascending from the surface pseudoadiabatically (see text).
line. Clearly, our analysis cannot definitively exclude in situ condensation; more model studies and observations will be needed to do that.
As discussed in SD01, some ice must be retained in de-training parcels. With no ice, the injection of dry air into the TTL dehydrates too effectively, so that air entering the stratosphere is far too dry. SD01 determined that a retained ice/vapor ratio of four in air prior to mixing into the TTL produced a water distribution in the TTL and entering the stratosphere in agreement with observations.
Adopting this value of four for the ice/vapor ratio, we present in Fig. 4 four simulations from our model where dif-ferent values ofδDice are used. The simulations all produce under-depletion and a near-zero gradient ofδD throughout the TTL. This emphasizes the conclusion from the previous runs that this near-zero gradient is a fundamental property of our model. It is also clear that our model is sensitive to the choice ofδDice. The choice ofδDicechanges the depletion of water injected into the lower TTL, and thisδD is then trans-ported upward to the stratosphere, while the air is dehydrated through injection of dry air.
Setting δDice to −565‰, produces δD in the TTL and lower stratosphere in close quantitative agreement to the AT-MOS measurements. While reasonable, without
measure-ments of theδDice in the TTL, we cannot know for certain how realistic this choice ofδDiceis. This emphasizes the im-portance of a measurement of the isotopic composition of the ice detraining into the TTL.
It should be noted that we are not specifying the isotopic content of the ice, just the isotopic content of that portion of the ice crystal that sublimates in the TTL. Because of the slow rate of diffusion of molecules in ice, the outer coating of the ice, which was deposited last, is expected to be isotopi-cally more depleted than the core. For a sufficiently large ice crystal, it is reasonable that only the outer (and isotopi-cally more depleted) portion of the crystal might evaporate in the TTL, with the remainder evaporating at lower altitudes. Thus, it is possible that the bulk composition of ice lofted into the TTL is potentially different from the composition of ice that evaporates there.
One obvious question is whether our results are unduly influenced by the specification of the depletion of retained ice δDice as a constant value. To investigate this, we per-formed runs whereδDice is not constant, but is chosen ran-domly from a normal distribution prior to every call of the convective subroutine of our model (this subroutine simu-lates one convective event and is called thousands of times during each run of the model). We varied both the average value and standard deviation of theδDice distributions. In these runs (not shown), only changes in the average value ofδDicemattered; varying the standard deviation from zero (i.e. constantδDice) through large values resulted in virtually identicalδD profiles in the TTL.
As a further check, we also performed runs where the ice becomes more depleted (e.g.δDice becomes more negative) with increasing mixing height of the overshooting convec-tion. For each convective event, we setδDiceequal to the de-pletion predicted by the Rayleigh curve at a pre-determined distance below altitude where the parcel mixes into the en-vironment. In Fig. 4, we plot a run (dashed line) where this distance is 3.5 km; e.g. if the parcel mixes with the environ-ment at 16.5 km, we setδDice equal to the Rayleigh curve value at 13 km. This run again shows only a small vertical gradient in predictedδD. Other offset distances show a sim-ilarly shaped curve, with the predicted curve shifting as the altitude offset changes. The reason for this is that most of the water in the TTL entered over a narrow altitude range – narrow enough thatδDice is effectively constant in this run. It seems unlikely thatδDicewould vary strongly enough with altitude to produce a significantly non-uniform vertical dis-tribution of isotopic composition in the model TTL.
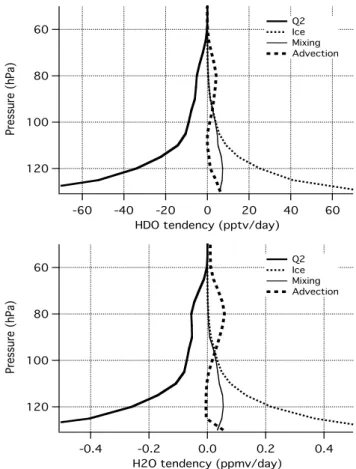
counted in Q2), which in our model sublimates with a time scale of one day, releasing HDO and H2O vapor. Advec-tion, comprised of both vertical and horizontal components, and isentropic (i.e. horizontal) mixing both transport water within and between the regions.
In the lower half of the TTL (i.e. below the tropopause), the primary balance for both HDO and H2O vapor is between moistening by ice sublimation and drying by convective in-jection of dry air. Advection and isentropic mixing are both small. Because ice sublimation is the dominant source of wa-ter vapor in the lower half of the TTL,δD there is strongly af-fected by the assumed value ofδDice, which is obvious from the runs in Fig. 4.
Air parcels detraining in the upper half of the TTL have experienced such cold temperatures that their H2O and HDO (both vapor and ice) content is small (compared to the am-bient TTL). This drying tendency is balanced by upward ad-vection of high H2O and HDO mixing ratio air (remember that our model has no methane oxidation in it, so the mix-ing ratios of H2O and HDO decrease with increasmix-ing altitude throughout the TTL). The insertion of dry air into the upper TTL dehydrates the TTL, but without changing the value of
δD. This conclusion holds for all runs, regardless of what is assumed for the retained ice/vapor ratio orδDice.
One might ask whether there is any way we can generate a strong gradient inδD in the TTL in our model. The only way we can think of is if air detraining in the upper half of the TTL had significant amounts of water (ice or vapor) and if this water had a depletion significantly different from that of the lower TTL. This would probably require strong vertical gradients in both the retained ice/vapor ratio and in δDice. It seems likely, however, that such gradients would produce water vapor distributions in the TTL and lower stratosphere that were unrealistic.
Previous studies (Moyer et al., 1996; Keith, 2000; Johnson et al., 2001a; Kuang et al., 2003) have concluded that parcel-based models of air ascent produce air that is much more de-pleted (i.e. follows the Rayleigh curve) than the air observed in the TTL and lower stratosphere. This shows that either ice lofting or irreversible mixing between parcels with different histories must play a significant role. At least one numerical model currently under study (J. Smith, personal communi-cation) appears to depart successfully from the parcel-based calculations, and it is likely that others will as well, indi-cating that stratospheric “under-depletion” may be consistent with a number of dehydration paradigms. Examination of the details of vertical variation of isotopologues, rather than just the final value in the stratosphere, may be the key to discrim-inating among models.
7 Discussion
Two explanations for “under-depletion” in the lower tropi-cal stratosphere (HDO abundances larger than predicted by
29
-60 -40 -20 0 20 40 60
HDO tendency (pptv/day) 120
100 80 60
P
res
su
re
(h
P
a)
Q2 Ice Mixing Advection
-0.4 -0.2 0.0 0.2 0.4 H2O tendency (ppmv/day)
120 100 80 60
P
res
su
re
(h
P
a)
Q2 Ice Mixing Advection
Fig. 5. Budget for HDO (top) and H2O (bottom) in the TTL for
δDicefrom the−565‰ run, averaged over the model’s two regions. See the text for the definitions of the lines.
the Rayleigh fractionation) have been suggested in the liter-ature before: lofting of ice formed in the upper troposphere into the TTL, where it sublimates, and mixing between air masses with different thermodynamic histories. In this pa-per, we consider for the first time both processes and model them quantitatively, using a model that explicitly represents convective transport in a dynamically and energetically con-sistent way.
In our model’s TTL, most of the water vapor detrained near the bottom of the TTL. As this air slowly ascends to-wards the stratosphere, it is dehydrated by injection of dry air from convection. Because isotopic depletion is really a measure of the ratio of[HDO]/[H2O], dehydration by dilu-tion does not change the depledilu-tion. As a result, our model predicts near-constant profiles ofδD in the TTL, in agree-ment with the recent ATMOS observations. This conclusion is not dependent on our assumptions for retained ice/vapor ratio or the isotopic composition of the retained ice.
TTL accurately, then settingδDiceto−565‰ reproduces the
δD distribution in the TTL. Measurement of this quantity will provide an important new constraint on models, including the present model.
One underappreciated aspect of ice lofting into the TTL is that it must be accompanied by a persistent source of dry air, without which the TTL would rapidly saturate and the lofted ice would sediment out of the TTL without evaporating. In our model, overshooting convection is the source of dry air that prevents the TTL from saturating (SD01). It may be possible that temperature perturbations associated with grav-ity or Kelvin waves might also create subsaturated air. Such perturbations, however, are temporary, so do not seem to be a possible source of dry air for this problem.
The work described in this paper is in fundamental agree-ment with the work of Johnson et al. (2001a). Using a cal-culation that included two detrainment levels and no lofted ice, they suggested that most of the water vapor but a small fraction of the mass entering the stratosphere was dehydrated to the temperatures found at 11 km. Most of the mass en-tering the stratosphere, on the other hand, experienced very cold temperatures and therefore had small water vapor abun-dances (relative to the stratosphere). Johnson et al. empha-sized the composition of air entering the stratosphere; our work shows that this explanation also explains the distribu-tions within the TTL, too.
Johnson et al. also did not explore vertical variations in de-pletion or ice lofting. Recent observations (Sherwood, 2002) indicate that reevaporated ice plays a dominant role in at-taining stratospheric moisture. It is not clear how such loft-ing/reevaporation would affect the dilution arguments, nor is it clear from existing studies whether the necessary convec-tive insertion process (with or without ice) is consistent with other physical constraints on the system.
Our model shows that dehydration from dilution is con-sistent with the physical processes of the TTL. In agreement with Johnson et al., most of the water vapor in the TTL and entering the stratosphere was injected near the bottom of the TTL around 14 km, with subsequent dehydration as the air slowly ascends provided by injection of dry air from over-shooting convection. In addition, our analysis shows that the same ideas explain the near-zero gradient seen in the TTL in the ATMOS data qualitatively, and with some tuning, quanti-tatively. Our model also emphasizes the important role lofted ice plays in the TTL.
8 Conclusions
In conclusion, the model used here was previously shown in SD01 to simulate the average H2O, O3 gradients, and en-ergy balance in the TTL successfully. Here, we have shown that the same model is also capable of simulating the near-constant value ofδD seen in the ATMOS data throughout the TTL. While the final values of H2O andδD are sensitive to
the amount and isotopic composition of lofted ice, respec-tively, we find that the near-constantδD profiles simulated in the TTL result from the underlying physics of the model, not from arbitrary model parameters. The near-constancy of simulatedδD results from the fact that dehydration in SD01 occurred through a dilution process, in which ascending air is mixed with very dry air, reducing the concentrations of all isotopes at about the same rate; lofted ice was important only in the lower TTL, where the initial values of H2O and its isotopologues were established.
We anticipate that vertical variation of δD in the TTL, rather than the final value, will be the most powerful dis-criminator of dehydration theories. We suspect that models in which dehydration within the TTL occurs primarily out-side convection will have difficulty in reproducingδD in the TTL as uniform as that simulated here (even if other mixing mechanisms enable them to get to the observed end-point in the lower stratosphere). Further corroboration of the Kuang et al. (2003) observations, which support the near-uniformity we have simulated, are of great interest.
Acknowledgements. Much of this work was done while AED was visiting NCAR in fall and winter of 2001–2002. He acknowledges the generous support of the NCAR Atmospheric Chemistry Divi-sion that made the visit possible, as well as Laura Pan for arranging the visit. We acknowledge productive discussions with A. Andrews, D. Johnson, D. Keith, Z. Kuang, E. Moyer, and R. Smith. This work was supported by NASA EOS/IDS grant NAG-59632 and NASA grants NAG-11849 and NAG-11897 to the University of Maryland and Yale University, and by a NASA New Investigator Program in Earth Science grant NAG-58936 to the University of Maryland.
References
Atticks, M. G. and Robinson, G. D.: Some features of the structure of the tropical tropopause, Q. J. R. Meteorol. Soc., 109, 295–308, 1983.
Boehm, M. T. and Verlinde, J.: Stratospheric influence on upper tropospheric tropical cirrus, Geophys. Res. Lett., 27, 3209–3212, 2000.
Danielsen, E. F., A dehydration mechanism for the stratosphere, Geophys. Res. Lett., 9, 605–608, 1982.
Dessler, A. E.: The effect of deep, tropical convection on the trop-ical tropopause layer, J. Geophys. Res., 107, D3, 4033, DOI: 10.1029/2001JD000511, 2002.
Dessler, A. E. and Kim, H.: Determination of the amount of water vapor entering the stratosphere based on HALOE data, J. Geo-phys. Res., 104, 30 605–30 607, 1999.
Emanuel, K. A.: A scheme for representing cumulus convection in large-scale models, J. Atmos. Sci., 48, 2313–2335, 1991. Eriksson, E.: Deuterium and18O in precipitation and other
natu-ral waters: some theoretical considerations, Tellus, 27, 498–512, 1965.
Folkins, I.: Origin of lapse rate changes in the upper tropical tropo-sphere, J. Atmos. Sci., 59, 992–1005, 2002.
ozonesondes and aircraft measurements, J. Geophys. Res., 104, 22 095–22 102, 1999.
Gedzelman, S. D.: Deuterium in water vapor above the atmospheric boundary layer, Tellus, 40B, 134–147, 1988.
Gunson, M. R., Abbas, M. M., Abrams, M. C., Allen, M., Brown, L. R., Brown, T. L., Chang, A. Y., Goldman, A., Irion, F. W., Lowes, L. L., Mahieu, E., Manney, G. L., Michelsen, H. A., Newchurch, M. J., Rinsland, C. P., Salawitch, R. J., Stiller, G. P., Toon, G. C., Yung, Y. L., and Zander, R.: The Atmospheric Trace Molecule Spectroscopy (ATMOS) experiment: Deployment on the ATLAS Space Shuttle missions, Geophys. Res. Lett., 23, 2333–2336, 1996.
Hagemann, R., Nief, G., and Roth, E.: Absolute isotopic scale for deuterium analysis of natural waters, Absolute D/H ratio for SMOW, Tellus, 22, 712–715, 1970.
Hartmann, D. L., Holton, J. R., and Fu, Q.: The heat balance of the tropical tropopause, cirrus, and stratospheric dehydration, Geo-phys. Res. Lett., 28, 1969–1972, 2001.
Highwood, E. J. and Hoskins, B. J.: The tropical tropopause, Q. J. R. Meteorol. Soc., 124, 1579–1604, 1998.
Holton, J. R. and Gettelman, A.: Horizontal transport and the dehy-dration of the stratosphere, Geophys. Res. Lett., 28, 2799–2802, 2001.
Jensen, E. J., Pfister, L., Ackerman, A. S., Tabazadeh, A., and Toon, O. B.: A conceptual model of the dehydration of air due to freeze-drying by optically thin, laminar cirrus rising slowly across the tropical tropopause, J. Geophys. Res., 106, 17 237– 17 252, 2001.
Jensen, E. J., Toon, O. B., Pfister, L., and Selkirk, H. B.: Dehy-dration of the upper troposphere and lower stratosphere by sub-visible cirrus clouds near the tropical tropopause, Geophys. Res. Lett., 23, 825–828, 1996.
Johnson, D. G., Jucks, K. W., Traub, W. A., and Chance, K. V.: Isotopic composition of stratospheric water vapor: Implications for transport, J. Geophys. Res., 106, 12 219–12 226, 2001a. Johnson, D. G., Jucks, K. W., Traub, W. A., and Chance, K.
V.: Isotopic composition of stratospheric water vapor: Mea-surements and photochemistry, J. Geophys. Res., 106, 12 211– 12 217, 2001b.
Johnston, H. S. and Solomon, S.: Thunderstorms as possible mi-crometeorological sink for stratospheric water vapor, J. Geophys. Res., 84, 3155–3158, 1979.
Keith, D. W.: Stratosphere-Troposphere exchange: Inferences from the isotopic composition of water vapor, J. Geophys. Res., 105, 15 167–15 173, 2000.
Kuang, Z., Toon, G. C., Wennberg, P. O., and Yung, Y. L.: Measured HDO/H2O ratios across the tropical tropopause, Geophys. Res. Lett., 30, 7, 1372, DOI: 10.1029/2003GL017023, 2003. Majoube, M.: Fractionnement en oxyg´ene 18 et en deuterium entre
l’eau et sa vapeur, J. Chim. Phys., 68, 1423–1436, 1971. Merlivat, L. and Nief, G.: Fractionnement isotopique lors des
changements d’etat solide-vapeur et liquid-vapeur de l’eau a des temperatures inferieures a 0◦C, Tellus, 19, 122–127, 1967. Moyer, E. J., Irion, F. W., Yung, Y. L., and Gunson, M. R.: ATMOS
stratospheric deuterated water and implications for troposphere-stratosphere transport, Geophys. Res. Lett., 23, 2385–2388, 1996.
Potter, B. E. and Holton, J. R.: The role of monsoon convection in the dehydration of the lower tropical stratosphere, J. Atmos. Sci., 52, 1034–1050, 1995.
Sherwood, S. C.: A stratospheric “drain” over the maritime conti-nent, Geophys. Res. Lett., 27, 677–680, 2000.
Sherwood, S. C.: A microphysical connection among biomass burn-ing, cumulus clouds, and stratospheric moisture, Science, 295, 1272–1275, 2002.
Sherwood, S. C. and Dessler, A. E.: On the control of stratospheric humidity, Geophys. Res. Lett., 27, 2513–2516, 2000.
Sherwood, S. C. and Dessler, A. E.: A model for transport across the tropical tropopause, J. Atmos. Sci., 58, 765–779, 2001. Sherwood, S. C. and Dessler, A. E.: Convective mixing near the
tropical tropopause: Insights from seasonal variations, J. Atmos. Sci., 60, 2674–2685, 2003.
Smith, R. B.: Deuterium in North Atlantic storm tops, J. Atmos. Sci., 49, 2041–2057, 1992.