www.atmos-chem-phys.net/12/2459/2012/ doi:10.5194/acp-12-2459-2012
© Author(s) 2012. CC Attribution 3.0 License.
Chemistry
and Physics
Aerosols-cloud microphysics-thermodynamics-turbulence:
evaluating supersaturation in a marine stratocumulus cloud
F. Ditas1, R. A. Shaw1,2, H. Siebert1, M. Simmel1, B. Wehner1, and A. Wiedensohler1
1Leibniz Institute for Tropospheric Research (IfT), Permoserstr. 15, 04318 Leipzig, Germany 2Department of Physics, Michigan Technological University, Houghton, Michigan, USA
Correspondence to:F. Ditas ([email protected])
Received: 11 October 2011 – Published in Atmos. Chem. Phys. Discuss.: 4 November 2011 Revised: 2 February 2012 – Accepted: 20 February 2012 – Published: 5 March 2012
Abstract. This work presents a unique combination of aerosol, cloud microphysical, thermodynamic and turbulence variables to characterize supersaturation fluctuations in a tur-bulent marine stratocumulus (SC) layer. The analysis is based on observations with the helicopter-borne measure-ment platform ACTOS and a detailed cloud microphysi-cal parcel model following three different approaches: (1) From the comparison of aerosol number size distributions inside and below the SC layer, the number of activated par-ticles is calculated as 435±87 cm−3 and compares well
with the observed median droplet number concentration of Nd=464 cm−3. Furthermore, a 50 % activation diameter
ofDp50≈115 nm was derived, which was linked to a
criti-cal supersaturationScrit of 0.16 % via K¨ohler theory. From
the shape of the fraction of activated particles, we esti-mated a standard deviation of supersaturation fluctuations ofσS′= 0.09 %. (2) These estimates are compared to more
direct thermodynamic observations at cloud base. There-fore, supersaturation fluctuations (S′) are calculated based on highly-resolved thermodynamic data showing a standard de-viation ofS′ ranging within 0.1 %≤σS′≤0.3 %. (3) The
sensitivity of the supersaturation on observed vertical wind velocity fluctuations is investigated with the help of a de-tailed cloud microphysical model. These results show high-est fluctuations ofS′withσS′=0.1 % at cloud base and a
de-creasingσS′with increasing liquid water content and droplet
number concentration. All three approaches are independent of each other and vary only within a factor of about two.
1 Introduction
The atmosphere’s radiation budget and aerosol particles are linked via (1) the radiative properties of the aerosol parti-cles themselves (direct aerosol effect) and (2) via influencing cloud microphysics (indirect aerosol effect) and, therefore, cloud radiative properties. The first description of the indi-rect aerosol effect on climate was introduced by Warner and Twomey (1967). Assuming a constant liquid water content (LWC) but increasing number of cloud condensation nuclei (CCN) the same amount of water is distributed to a larger number of smaller droplets (first indirect effect). Later Al-brecht (1989) focused on the effect of “polluted” droplet spectra on cloud lifetime and precipitation (second indirect effect, cloud lifetime effect). Since then, it has become clear that there is a range of subtle aerosol-cloud interactions (e.g., Stevens and Feingold, 2009), and quantifying them remains a challenge.
conditions. To make matters more complex, the fluctuations do not arise solely from turbulent mixing of temperature and water vapor concentration fields, but also from the mass ex-change associated with the activation process itself. Thereby, growing droplets are acting as sinks for the local supersatu-ration, which furthermore, can vary from droplet to droplet (Srivastava, 1989). Achieving internal consistency between aerosol distributions, cloud droplet distributions, turbulence, and thermodynamic fluctuations is still a significant chal-lenge, and is the context of this work.
In this study, we evaluate the magnitude of supersaturation fluctuations (S′) in a turbulent marine stratocumulus layer over the Baltic Sea. The measurements were obtained with the helicopter-borne platform ACTOS (Airborne Cloud Tur-bulence Observation System, Siebert et al., 2006); its true air speed of only 15 to 20 m s−1 allows us to compare highly resolved and spatially collocated thermodynamic and cloud microphysical properties with microphysical properties of the interstitial aerosol nearby the turbulent cloud layer. Un-like most prior airborne studies, we also measure the non-activated interstitial aerosol inside an SC to draw conclu-sions on the activation properties. Within the framework of this paper, we focus on three approaches for character-izing supersaturation fluctuations: (1) aerosol number size distribution inside and outside the stratocumulus cloud and the resulting activation properties as well as a comparison with observed cloud droplet number concentration, (2) water vapor supersaturation at the cloud base derived from highly resolved thermodynamic data, and (3) a sensitivity analysis of the influence of measured vertical velocity fluctuations on the supersaturation field determined with a cloud microphys-ical parcel model.
2 Experimental
This study draws on measurements of marine stratocumu-lus clouds over the Baltic Sea, obtained on 5 October 2007 during a flight originating from the Kiel-Holtenau airport in Germany (54◦22′46′′N, 10◦8′43′′E). ACTOS operated north of the city of Kiel over rural area, the coast line and the Baltic Sea, in the measurement area shown in Fig. 1.
2.1 Airborne Cloud Turbulence Observation System (ACTOS)
The helicopter-borne measurement platform ACTOS is equipped with a variety of high resolution sensors for me-teorological and turbulence parameters as well as cloud and aerosol microphysical properties. ACTOS is an autonomous platform with its own data acquisition system and power sup-ply. A wireless network uplink to the helicopter ensures online monitoring of the most important parameters during flight. ACTOS is carried by means of a 140 m long rope be-neath a helicopter and operates at a true air speed of 15 to
Germany
City of Kiel
Airport
Measurement Site
Fig. 1.Measurement site at the airport of Kiel-Holtenau (maps are taken from http://maps.google.de).
20 m s−1. The combination of low true air speed and high sampling frequency results in a spatial resolution on the cen-timetre scale for standard meteorological parameters. For a detailed description of ACTOS and its instrumentation see Siebert et al. (2006).
2.2 Aerosol and cloud microphysical instrumentation
During this campaign, aerosol number size distributions (NSDs) in the size range of 6 nm< Dp<2.6 µm were
recorded by a Scanning Mobility Particle Sizer (SMPS, IfT, Leipzig, Germany) and an Optical Particle Counter (model 1.129, Grimm Aerosol Technik GmbH, Ainring, Ger-many). Additionally, the total particle number concentra-tion of the interstitial aerosol larger than Dp=6 nm was
measured by a Condensational Particle Counter with an in-creased temperature difference between saturator and con-densor (CPC 3762, TSI Incorporate, Shoreview, MN, USA). For a detailed description of the aerosol instrumentation, the reader is referred to Wehner et al. (2010). The aerosol inlet consists of a horizontally oriented tube, which is curved 90◦ to the mean flow direction. Taking into account aspiration efficiency and losses at the 90◦ bend (Baron and Willeke, 2001) particles and cloud droplets larger than 5 µm are not able to enter the aerosol measurement system. This ensures exclusive sampling of interstitial particles.
Cloud droplet spectra were measured with the Phase-Doppler Interferometer for Cloud Turbulence (PICT, Chuang et al., 2008). The PICT instrument measures size and speed (in flight direction) of individual droplets between 3 µm< Dd<100 µm, with no dead time losses and with
fromabove
frombelow
Fig. 2.Scheme of the flight pattern of ACTOS on 5 October 2007. Subfigures show pictures of the observed stratocumulus taken by the on-board camera.
3 Measurements
On 5 October, ACTOS performed measurements near and inside a SC layer advected from the Baltic Sea to Northern Germany. After take-off, the flight started with a vertical pro-file up to approximately 1000 m above ground level (AGL, all following heights refer to ground level of airport) where ACTOS touched the cloud base of the SC layer. The vertical profile was then continued in cloud free area up to a height of approximately 1550 m. After descending to cloud top height ACTOS was dipped into the SC from above (cf. Fig. 2). Sev-eral horizontal flight legs with constant altitude were per-formed inside the SC layer. A second vertical profile was accomplished about 1 h after the first one during the descent on the way back to the airport. The complete measurement flight took approximately 1.5 h.
3.1 Vertical structure
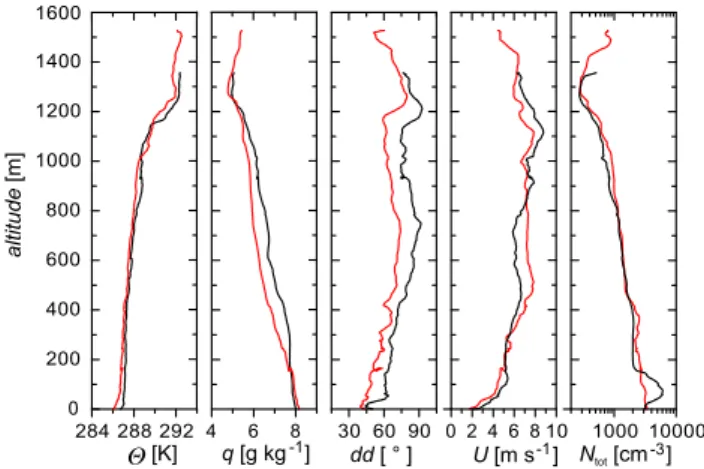
Figure 3 shows vertical profiles of selected meteorological parameters measured during ascent and descent. The poten-tial temperature (θ) features a slight increase in the lower-most 1000 m indicating a stably stratified atmosphere. This is followed by a strong temperature increase until about 1300 m, which belongs to an inversion above the observed stratocumulus. The absolute humidity (q) shows a decrease with height until the altitude of the inversion, differences be-tween ascent and descent are likely due to horizontal inho-mogeneities. The wind direction (dd) was north-east to east, its vertical distribution exhibits mainly a change of approx-imately 30◦during the lowermost 500 m. Within the same height interval, the wind velocity (U) increases by around 5 m s−1. Furthermore, abrupt changes are only found at the inversion.
The absence of strong vertical gradients inddandU be-low the inversion layer indicates that the SC and the sub-cloud layer are coupled. The total particle number
con-0 200 400 600 800 1000 1200 1400 1600
284 288 292 4 6 8 30 60 90 0 2 4 6 8 10 1000 10000 Ntot [cm ]-3
U [m s ]-1 �� [K] q [g kg ]-1 dd [ ° ]
al
tit
ude
[m]
Fig. 3. Vertical profiles of potential temperature (
fromabove
frombelow
0200 400 600 800 1000 1200 1400 1600
284 288 292 4 6 8 30 60 90 0 2 4 6 8 10 1000 10000
Ntot [cm ]-3
U [m s ]-1
�� [K] q [g kg ]-1 dd [ ° ]
al
tit
ude
[m]
), absolute hu-midity (q), wind direction (dd), wind velocity (U) and total particle number concentration (Ntot) recorded during ascent (black lines)
and descent (red lines). Note that vertical profiles were performed in cloud free area.
centration (Ntot) features a continuous decrease from about
3000 cm−3 at the ground to a few hundreds per cubic cen-timetre at the altitude of the inversion. This is followed by an increase toNtot≈1000 cm−3 above the inversion. The
variability in the lowermost 200 m is possibly due to ground effects or local pollution. The observed SC layer was located between 1000 m and 1300 m. Note that for flight safety rea-sons, the helicopter is not allowed to fly into clouds. Verti-cal profiles are recorded in cloud free areas during ascents and descents. Due to the forward velocity of the platform, vertical gradients are to some degree influenced by horizon-tal gradients and displayed vertical profiles may differ from those directly below the cloud layer.
3.2 Measurements at cloud level
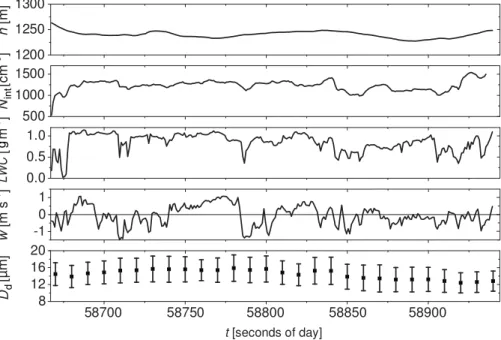
Figure 4 shows a time series of selected parameters during an in-cloud flight leg. ACTOS penetrated the cloud layer from above and performed an approximately 5 km long leg at 1250±15 m. At the beginning, the interstitial particle num-ber concentration (Nint) increases sharply because ACTOS
was dipped into the stratocumulus from above, whereNintis
significantly lower (cf. Fig. 3).
Inside the cloud, Nint varies mostly between 1000 and
1300 cm−3, which is higher compared to the value
ob-served for the vertical profile. The difference may be due to horizontal inhomogeneities because vertical profiles were recorded at some distance from the cloud as mentioned above. The LWC ranges mainly between 0.6 and 1.0 g m−3, while the vertical wind velocity (w) shows variations within
d
int
Fig. 4. Time series (1 Hz data) of altitude (h), interstitial particle number concentration (Nint), liquid water content (LWC), vertical wind
velocity (w) and mean droplet diameter (Dd, error bars mark the standard deviation) for 10 s long intervals during an approximately 5 km
long flight leg inside the SC.
long intervals is shown indicating average diameters between 12 µm and 16 µm with a nearly constant standard deviation around 2–3 µm (error bars). The corresponding mean droplet size distribution to above displayed flight leg is illustrated in Fig. 5. The spectrum shows a broad mono-modal distribution with a maximum concentration at about Dd=12 µm. The
majority of droplets size between 5 µm< Dd<20 µm, while
median total droplet concentration for this cloud passage av-erages out at approximately 470 cm−3with an interquartile spread of 141 cm−3. The median droplet number concen-tration of all cloud passages is aboutNd=464 cm−3 with
an interquartile spread of 184 cm−3.
4 Critical supersaturation
In this section, three different estimates of the critical super-saturation are presented. The three estimates come from in-dependent measurements, so agreement between them builds confidence in the individual methods and their theoretical foundations. 1. Aerosol and cloud microphysics: aerosol number size distributions inside and outside the cloud are used to compare to cloud droplet number densities as a check, and then to derive an activation diameter and a cor-responding critical supersaturation. 2.Thermodynamics: hu-midity fluctuations are estimated from direct, high resolution measurements of absolute humidity and temperature around the cloud base. 3.Turbulence: a cloud parcel model is uti-lized to translate observed vertical wind velocity fluctuations into supersaturation fluctuations.
d
d
/d
d
[cm
-3µm -1]
d[µm]
100
80
60
40
20
0
5 10 15 20 25 30
D
N
D
Fig. 5. Average droplet number size distribution corresponding to time period displayed in Fig. 4.
4.1 Aerosol number size distribution
number of activated particles
50% activation diameter
p50~ 115 nm
D
�
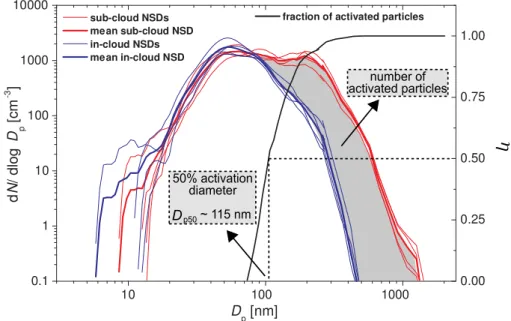
Fig. 6. Aerosol number size distributions of the interstitial aerosol (left ordinate) inside (blue lines) and below (red lines) the observed stratocumulus layer and number fraction of activated particles (right ordinate).
feature a similar Aitken mode (20 nm< Dp<70 nm),
im-plying that sub-cloud and in-cloud aerosols originate from the same air mass.
Comparing the in-cloud and sub-cloud NSDs, significant differences are obvious. For particles larger thanDp=70 nm,
a spread between in-cloud and sub-cloud NSDs occurs that can be explained by activation of aerosols to cloud droplets. The shaded area in Fig. 6 illustrates the num-ber of activated particlesNact. We deriveNact by
integrat-ing the sub-cloud and in-cloud NSDs for particles between 80 nm< Dp<2600 nm as follows:
Nact=
Z Dp=2600 nm
Dp=80 nm
NSDsubclouddDp
−
Z Dp=2600 nm
Dp=80 nm
NSDclouddDp. (1)
In our case, the difference is about 435±87 cm−3, which agrees remarkably well with the above introduced median droplet concentration ofNd=464 cm−3. This consistency
between aerosol and cloud microphysical measurements vides encouragement to further investigate the activation pro-cess that links the two.
In order to quantify an activation diameter, we calcu-late the fraction of activated particles η with the help of the mean in-cloud and sub-cloud NSDs (NSDcloud(Dp) and
NSDsubcloud(Dp), respectively) as follows:
η(Dp)=1−
NSDcloud(Dp)
NSDsubcloud(Dp)
. (2)
Figure 6 shows η (right ordinate), which features a steep increase for particles in the size range of 80 nm< Dp<150 nm. For larger particle sizes,ηapproaches
unity. From η=0.5, a 50 %-activation diameter of Dp50≈115 nm can be derived (cf. Fig. 6). With the help
of K¨ohler theory (K¨ohler, 1936) and an assumption about the chemical composition, Dp50 can be related to a critical
supersaturation. Since ACTOS is not equipped with instru-ments to analyze the aerosol chemical composition, we have to make an assumption for the hygroscopicity. Among oth-ers, Neus¨uß et al. (2002) investigated the chemical compo-sition of Central European aerosol and found a dominating mass fraction of ammonium sulfate. To make a first guess we assume a pure ammonium sulfate particle containing an in-soluble core. Chemical analysis during LACE 98 support this (Busch et al., 2002), furthermore, the same authors found an overall mean of the water-solube volume fraction ofǫ=0.6, additionally they also found a class of highly soluble parti-cles withǫ=0.85. Therefore, we use an ammonium sulfate particle with a dry diameter of Dp=Dp50=115 nm and a
soluble fraction ofǫ=0.7 and calculate that a minimum su-persaturation ofScrit=0.16 % is required to activate the
par-ticle as cloud droplet.
In the next step, we concentrate again on the fraction of activated particles (η). Taking into account that a small frac-tion of particles with a diameter ofDp=80 nm and smaller
are activated, a critical supersaturation of Scrit=0.28 % is
data fit fit function:
resulting parameters: µ = 0.175; ��= 0.094 R = 0.99 2
S
crit0.0 0.2 0.4 0.6 0.8 1.0
0.0 0.1 0.2 0.3 0.4 0.5
[%]
'
Fig. 7. Activated fractionη′as function of critical supersaturation
Scrit(squares). Red line denotes a fitted error function.
we convertη(Dp) to a function of critical supersaturation by
calculating the critical supersaturation (with the same chem-ical parameters as above) for every Dp via K¨ohler theory.
Figure 7 illustrates the resulting activated fraction η′(Scrit)
(black squares), which exhibits a similar error function like behaviour asη(Dp) in Fig. 6. For clarity, here, the activated
fraction as a function of critical supersaturation is defined as η′(Scrit)=1−η(Scrit)so as to show an increase with
criti-cal supersaturation, although the shape parameters obtained from the curve are independent of this choice.
This gives us the opportunity to estimate the mean criti-cal supersaturation and its standard deviation by applying a least squares fit toη′with the functiony=erf((x−µ)/(
√
2σ ))+1 2
using the mean and standard deviation (µ, σ) as free pa-rameters. The fit function is plotted in Fig. 7 (red line), the resulting µ=0.175 % agrees well with the above de-rivedScrit(Dp50), while the standard deviation calculates to
σS′=0.09 %.
4.2 Absolute humidity and temperature fluctuations
We now compare these estimates with more direct thermo-dynamic observations leading to relative humidity (RH) at cloud base. During the first ascent, ACTOS touched the cloud base at about 1000 m above ground level. Performing accurate measurements of RH or supersaturation (S) in the presence of cloud droplets is still a difficult task, but we make an attempt here in order to compare with the other meth-ods for evaluatingσS′. We derived RH from collocated
tem-perature and absolute humidity measurements with an ultra-fast thermometer (UFT) and infra-red absorption hygrometer both with a temporal resolution of 100 Hz. The longitudinal separation between both sensors was considered before com-bining the two measurements. The absolute accuracy of our humidity estimates is on the order of a few percent. Observed
[Hz]
red subsection green subsection blue subsection
0.1 1 10 100
f
f(-5/3)
var(
rH
)/f
[%
2 s]
1E-6 1E-4 1E-2 1
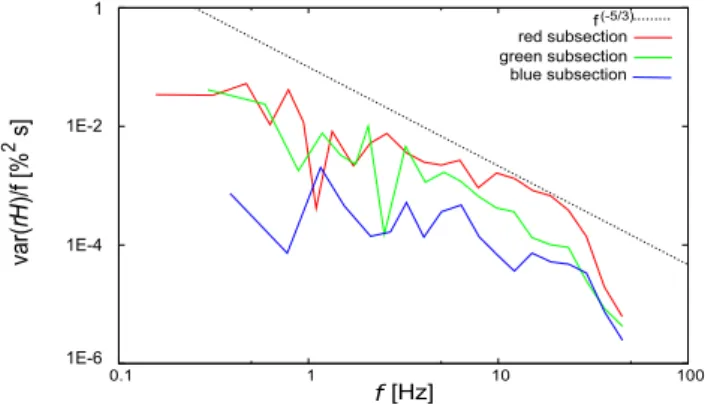
Fig. 8.Power spectral density of three different subsections (green, blue and red lines) during cloud penetration of ACTOS at cloud base. Dashed line refers to the−5/3 slope for the inertial subrange scaling.
fluctuations, however, are interpreted as real and afterwards termed saturation fluctuations (S′).
For quality assurance of the resulting time series of RH, we applied power spectral analysis. Figure 8 shows power spectra of three different subsets during the cloud penetra-tion of ACTOS, which will be analysed concerning super-saturation later on. All spectra feature a large scattering due to poor sampling statistics of the short subsections. Regard-less of the scatter, all spectra show roughly a mean slope of
−5/3, which implies inertial subrange scaling. This implies that the fluctuations are a result of real turbulence and not noise, which would result in a flat and horizontal spectrum. Strong deviations from the−5/3 slope could also be a result of scattering effects of single cloud droplets in the measuring volume of the infra-red absorption hygrometer, which was also not observed.
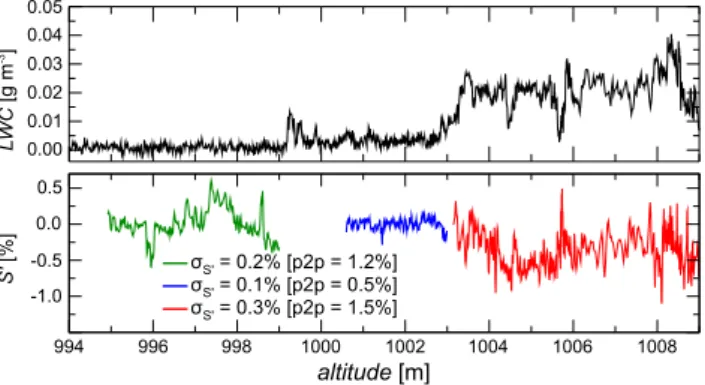
Figure 9 displays linearly detrendedS′and LWC as
func-tion of the altitude. The saturafunc-tion fluctuafunc-tions are divided into three subsections according to different mean LWC val-ues. The first subsection (green line) refers to zero LWC, the blue line belongs to a LWC slightly above the noise level and the last subsection (red line) references a mean LWC∼0.02 g m−3. For these different subrecords, the stan-dard deviation of the supersaturation fluctuations (σS′) is
cal-culated. The green subsection which is located a few me-ters below the cloud base features a standard deviation of 0.2 % whereas the peak to peak (p2p) values reach 1.2 %. In the blue subsection, only calm fluctuations occur with σS′=0.1% which range within 0.5 %. The strongest
fluctua-tions appear in the red subsection with a mean LWC of about 0.02 g m−3. The standard deviation achieves 0.3 % and the
σS'= 0.2% [p2p = 1.2%]
σS'= 0.1% [p2p = 0.5%]
σS'= 0.3% [p2p = 1.5%]
0.00 0.01 0.02 0.03 0.04 0.05
LW
C
[g
m
-3]
S'
[%]
0.5 0.0 -0.5 -1.0
altitude [m]
994 996 998 1000 1002 1004 1006 1008
Fig. 9. Liquid water content (LWC) and linearly detrended satu-ration fluctuations (S′) as function of the altitude during the first ascent when ACTOS touched the cloud base of the SC layer.
4.3 Vertical velocity fluctuations
Here, we investigate the influence of turbulent vertical wind fluctuations on the supersaturation field with the help of the detailed cloud microphysical parcel model of Simmel and Wurzler (2006). Essentially, we wish to evaluate the range of supersaturation fluctuations that can be achieved for realistic fluctuations in vertical velocity occurring during the activa-tion and condensaactiva-tion growth of cloud droplets near cloud base, assuming uniform aerosol number concentration. In this study, the model is used with a moving size-bin approach to avoid numerical diffusion along the mass axis. Further-more, we focus on pure condensational droplet growth ig-noring collision/coalescence and entrainment.
During the initialization of the cloud microphysical model, an air parcel is lifted by a constant updraftwinituntil a
spec-ified altitude or average liquid water content is reached. The air parcel starts to rise just beneath the cloud base observed by ACTOS. The initial conditions are characterised by a static pressure ofp=905 hPa, a temperature ofT =278.9 K and a relative humidity of RH = 96 % resulting in a model cloud base at 1065 m. The initial aerosol number size dis-tribution is represented by 4 log-normal modes, which were fitted to the observed mean aerosol number size distribution measured below the cloud base of the stratocumulus. After the initialisation, the model is driven by detrended vertical wind velocity fluctuations (w′) recorded during a flight leg inside the stratocumulus layer.
Basically, with this approach we compare two different reference frames. We use Eulerian measurements to drive a detailed cloud microphysical parcel model in a Lagrangian reference frame. In principle, the conversion of measured time series of wind fluctuations into spatially resolved fluc-tuations is possible by using Taylors frozen flow hypothe-sis (Taylor, 1938). Furthermore, for homogeneous turbu-lence the probability density functions (pdf) of “one-point one-time” velocity fluctuations (Eulerian reference frame) can be taken as equivalent to Lagrangian velocity
fluctua-tions (see e.g., Pope, 2000, p. 483). Instead of multiplying the measured time seriesw(t )with the true airspeed of the measurement platform to getw(x)(Taylors frozen flow hy-pothesis) we considered the ratio of two different time scales: (i) the timeT ACTOS needs to pass an eddy of typical size Land (ii) the typical eddy turn-over time τeddy, which
de-scribes the typical residence time of an air parcel in the same eddy. The first time scale can be estimated by integrating the autocorrelation functionρw(τ ). In practise,ρw(τ )is as-sumed to exhibit an exponential shape andT is taken as the time whereρw(T)=1/e. From the measurements, we es-timate T ≈2.6 s. The second time scale can be estimated byτeddy∼L/σw, where L=U·T ≈20 m s−1·2.6 s≈50 m is the integral length scale (U is the true airspeed of ACTOS). With a standard deviation σw≈0.6 m s−1, we get τeddy≈80 s. That is, if ACTOS samples one eddy
in the time T, an air parcel spends the time τeddy in this
eddy and we have to stretch the simulation time by a fac-tor ofτeddy/T ≈U/σw∼30. Although, the observed vertical wind velocity fluctuations are detrended, subrecords contain longer periods of up- and downdrafts leading to a vertical shift of the air parcel. Therefore, stretching the simulation time increases the vertical displacement. Note that this is an order of magnitude estimate and with a factor of 30 the verti-cal shift of an air parcel would be about±300 m, exceeding the thickness of the observed SC, we want to compare with. For this reason, in our simulations, we used a factor of 10 to limit this shift to±100 m. Furthermore, sensitivity esti-mates for different stretching factors do not show a strong influence on the resultingσS′. The factor is realized by using
single data points of the 100 Hz resolution time series with a model time step of 0.1 s.
We have performed two types of model runs that allow us to initiate the vertical velocity fluctuations just after or during the activation process. This is achieved through two scenar-ios for initializing the model: (a) lifting the air parcel with a constant updraft velocitywinituntil a certain LWC is reached
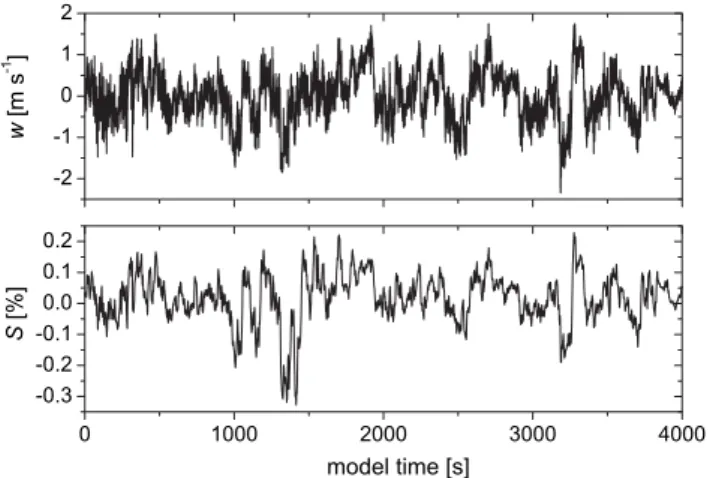
and (b) lifting the air parcel with a constant velocity to a cer-tain altitude (h) close to the cloud base. In concept (a), the vertical wind fluctuations are switched on when the air par-cel has already entered the cloud layer. Instead, concept (b) allows us to investigate the influence of the wind fluctuations on the supersaturation field directly at the condensation level. In this case, the subsequent wind fluctuations and the result-ing vertical displacement of the air parcel lead to activation and deactivation of aerosols and cloud droplets, respectively. Figure 10 shows time series of the observed vertical wind velocity and the resulting modelled supersaturation after the initialization of the cloud microphysical model following concept (a) with an initial wind speed of winit=0.1 m s−1
0 1000 2000 3000 4000 -0.3
-0.2 -0.10.0 0.1 0.2
S
[%]
model time [s] -2
-1 0 1 2
w
[m
s
-1 ]
Fig. 10.Time series of vertical wind velocity (upper panel) driving the cloud parcel model and modelled supersaturation (lower panel) corresponding to during model run A1.
Table 1.Initial vertical wind velocity (winit), mean height (h), mean
liquid water content (LWC), standard deviation (σS′) and peak to peak values (p2p) of the supersaturation fluctuations (S′) for six model runs. All model runs feature a model cloud base of 1065 m
model winit h LWC S′
run [m s-1] [m] [g m-3] σS′[%] p2p [%]
A1 0.1 1200 0.2 0.08 0.56
A2 0.4 1200 0.2 0.07 0.49
A3 1.0 1800 0.8 0.03 0.19
B1 – 1035 – 0.1 0.57
B2 – 1040 – 0.09 0.58
B3 – 1045 – 0.07 0.45
LWC=0.2 g m−3, which corresponds to an altitude of about 1200 m. Afterwards, the model is driven by the observed ver-tical wind fluctuations causing supersaturation fluctuations with a standard deviation of 0.08 and 0.07 %, respectively and peak to peak values (p2p) up to 0.56 %. In A3, the parcel was lifted up to an altitude of 1800 m and features calm su-persaturation fluctuations with a standard deviation of 0.03 % at a range of only 0.19 %. B1 to B3 follow the initialization scheme (b). In this case, the air parcel is lifted into altitudes between 1035 and 1045 m, which is below the cloud base. Furthermore, the initial vertical wind velocity does not in-fluence the activation process and, therefore, is of marginal importance. Due to the vertical displacement resulting from driving the model bywthe air parcel is lifted up and down and enters the cloud several times. The results for B1, B2 and B3 correspond to subsections of the model runs longer than 500 model seconds where the air parcel was located between 1065 and 1100 m to focus only on the supersaturation field at the cloud base. B1 and B2 exhibit the highest coupling ofw′ andS′ with standard deviations up to 0.1 % and maximum peak to peak values of 0.58 %.
5 Summary and discussion
This study presents a unique combination of cloud and aerosol microphysical, thermodynamic, and turbulence vari-ables measured at high temporal and spatial resolution in a stratocumulus cloud. These measurements and results from a cloud microphysical parcel model have allowed three independent approaches for characterizing supersaturation magnitudes and fluctuations. First, from the measurements of the interstitial aerosol below cloud base and inside the cloud, we were able to calculate the fraction of activated particles, which agrees remarkably well with the observed median cloud droplet number concentration. We then de-rived a 50 % activation diameter of 115 nm which can be re-lated to a critical supersaturation of 0.16 % via K¨ohler the-ory. The roll-off of the fraction of activated aerosols allows us to estimate the range of supersaturation fluctuations, as-suming all aerosols have identical composition. With the help of fitting an error function to the fraction of activated particles we find σS′ ≈0.09 %. The highly resolved
tur-bulence measurements give insights into the fluctuation of the supersaturation at cloud base. Calculated supersatura-tion fluctuasupersatura-tions vary with a standard deviasupersatura-tion ranging from 0.1≤σS′≤0.3 %, which agrees well with the above derived
critical supersaturation. Peak to peak values indicated a fluc-tuation range within 1.5 %. With the help of the cloud par-cel model we analysed the sensitivity of the supersaturation to observed vertical wind fluctuations inside the stratocu-mulus layer. We found the highest supersaturation fluctua-tions for model runs at cloud base (σS′=0.1 % and peak to
peak values of 0.58 %). This behaviour can be interpreted through the phase relaxation time, defined approximately as: τp=(2π·d·Dd·Nd)−1 (e.g., Rogers and Yau, 1989;
Khvorostyanov and Curry, 1999; Austin et al., 1985), where d is the water vapor diffusivity (≈2.2×10⁻⁵m2s−1, e.g., Houghton, 1985), andDdandNd are the mean droplet
di-ameter and droplet number concentration, respectively. The phase relaxation time is a measure of how fast the water vapor is redistributed between vapor and condensed phases after a rapid change in S. Alternately, it is the time scale for approaching a quasi-steady-state supersaturation for a given steady vertical velocity. Considering model run A3 (cf. Table 1), which features a very high droplet concen-tration of Nd∼640 cm−3 and a mean droplet diameter of
Dd=14 µm, this leads to τp≈0.8 s. That is, for such a
small phase relaxation time water vapor condenses compa-rably fast onto the existing droplets, resulting in a strong damping effect and hence very calm fluctuations. Instead, for A1 withDd=7 µm andNd=500 cm−3the phase
relax-ation time is roughly doubled toτp≈2 s, which explains the
increase inσS′ compared to A3. Finally, in the model runs
with initialization scheme (b) droplet diameter and concen-tration are highly variable. During activation and deactiva-tion,Ndchanges from zero to a few hundred and vice versa,
assuming, e.g.,Dd≤5 µm andNd≤150 cm−3, this yields a
largeτp≥10 s. Hence, the above mentioned damping effect
is weak and rapid changes inwresult in more intense fluctu-ations inS.
Within the framework of this work we did not consider ra-diative effects on the equilibrium supersaturation (Seq)
aris-ing from radiative coolaris-ing or heataris-ing of the cloud droplets. Marquis and Harrington (2005) pointed out that radiative heating and cooling rates for cloud droplets can vary by 2 to−15 K h-1, depending on radiative fluxes, droplet diameter and droplet location with reference to cloud top and cloud base. Since the reported measurement flight was conducted between 16:30 and 17:45 CET strong shortwave heating can be neglected. Furthermore, longwave forcing can be ne-glected because the majority of our observed droplets have sizes between 5 and 20 µm in diameter. For droplets in this size range the equilibrium supersaturation in the uppermost 50 m of a stratocumulus cloud can be changed by values on the order ofSeq= ±0.01 % (Marquis and Harrington, 2005,
Fig. 6), which is less than 10 % of the estimated variability from our measurements.
Here, we have considered the range of supersaturation fluctuations in a stratocumulus cloud. The question of max-imum possible supersaturation fluctuations, or the detailed distribution of supersaturation during cloud activation re-mains to be fully answered. Ultimately, supersaturation is the result of combined fluctuations of absolute humidity (q) and temperature (T), all of which are closely coupled to the condensed phase through the phase relaxation time. One pos-sibility to estimate a maximum possible supersaturation is, therefore, the investigation of joint probability density func-tions ofT andq (PDF(T ,q)), which is the focus of future efforts with ACTOS. It should be evident even from this first effort, however, that variability of the supersaturation field is of great relevance when considering the activation of aerosols.
Acknowledgements. The authors thank enviscope GmbH and Rotorflug GmbH for technical support during the measurement campaign. RAS acknowledges support from the A. v. Humboldt Foundation and from US National Science Foundation grant AGS-1026123.
Edited by: M. Kr¨amer
References
Albrecht, B.: Aerosols, cloud microphysics, and fractional cloudi-ness, Science, 245, 1227–1230, 1989.
Austin, P. H., Baker, M. B., Blyth, A. M., and Jensen, J. B.: Small-scale variability in warm continental cumulus clouds, J. Atmos. Sci., 42, 1123–1138, 1985.
Baron, P. and Willeke, K.: Aerosol Measurement, New York, USA, John Wiley & Sons, 2001.
Busch, B., Kandler, K., Sch¨utz, L., and Neus¨uß, C.: Hygroscopic properties and water-soluble volume fraction of atmospheric
par-ticles in the diameter range from 50 nm to 3.8 µm during LACE 98, J. Geophys. Res., 107, 8119, doi:10.1029/2000JD000228, 2002.
Chuang, P., Saw, E., Small, J., Shaw, R., Sipperley, C., Payne, G., and Bachalo, W.: Airborne phase doppler interferometry for cloud microphysical measurements, Aerosol Sci. Tech., 42, 685– 703, 2008.
Cooper, W.: Effects of variable droplet growth histories on droplet size distributions. Part I: Theory, J. Atmos. Sci., 46, 1301–1311, 1989.
Gerber, H.: Direct measurement of suspended particulate volume concentration and far-infrared extinction coefficient with a laser-diffraction instrument, Appl. Optics, 30, 4824–4831, 1991. Houghton, H.: Physical meteorology, Cambridge, US-MA: The
MIT Press, 1985.
Khvorostyanov, V. I. and Curry, J. A.: Toward the theory of stochas-tic condensation in clouds. Part I: A general kinestochas-tic equation, J. Atmos. Sci., 56, 3985–3996, 1999.
K¨ohler, H.: The nucleus in and the growth of hygroscopic droplets, T. Faraday Soc., 32, 1152–1161, 1936.
Kulmala, M., Rannik, ¨U., Zapadinsky, E., and Clement, C.: The ef-fect of saturation fluctuations on droplet growth, J. Aerosol Sci., 28, 1395–1409, 1997.
Marquis, J. and Harrington, J. Y.: Radiative influences on drop and cloud condensation nuclei equilibrium in stratocumulus, J. Geo-phys. Res., 110, D10205, doi:10.1029/2004JD005401, 2005. Neus¨uß, C., Wex, H., Birmili, W., Wiedensohler, A., Koziar, C.,
Busch, B., Br¨uggemann, E., Gnauk, T., Ebert, M., and Covert, D.: Characterization and parameterization of atmo-spheric particle number-, mass-, and chemical-size distributions in Central Europe during LACE 98 and MINT, J. Geophys. Res., 107, 8127, doi:10.1029/2001JD000514, 2002.
Petters, M. D. and Kreidenweis, S. M.: A single parameter repre-sentation of hygroscopic growth and cloud condensation nucleus activity, Atmos. Chem. Phys., 7, 1961–1971, doi:10.5194/acp-7-1961-2007, 2007.
Pope, S.: Turbulent Flows, Cambridge, UK, Cambridge Univ. Pr., 2000.
Rogers, R. R. and Yau, M. K.: A Short Course in Cloud Physics, 3 edn., International Series in Natural Philosophy, Oxford, UK, Butterworth Heinemann, 1989.
Siebert, H., Franke, H., Lehmann, K., Maser, R., Saw, E. W.,
Schell, D., Shaw, R. A., and Wendisch, M.: Probing
finescale dynamics and microphysics of clouds with helicopter-borne measurements, B. Am. Meteorol. Soc., 87, 1727–1738, doi:10.1175/BAMS-87-12-1727, 2006.
Simmel, M. and Wurzler, S.: Condensation and activation in sec-tional cloud microphysical models, Atmos. Res., 80, 218–236, doi:10.1016/j.atmosres.2005.08.002, 2006.
Srivastava, R.: Growth of cloud drops by condensation: a criticism of currently accepted theory and a new approach., J. Atmos. Sci., 46, 869–887, 1989.
Stevens, B. and Feingold, G.: Untangling aerosol effects on clouds and precipitation in a buffered system, Nature, 461, 607–613, doi:10.1038/nature08281, 2009.
Taylor, G. I.: The spectrum of turbulence, Proc. R. Soc. London Ser. A, 164, 476–490, 1938.
24, 704–706, 1967.
Wehner, B., Siebert, H., Ansmann, A., Ditas, F., Seifert, P., Strat-mann, F., Wiedensohler, A., Apituley, A., Shaw, R. A., Manni-nen, H. E., and Kulmala, M.: Observations of turbulence-induced new particle formation in the residual layer, Atmos. Chem. Phys., 10, 4319–4330, doi:10.5194/acp-10-4319-2010, 2010.