ACPD
11, 9999–10029, 2011Cloud droplet concentration over
the boreal forest
R. H. H. Janssen et al.
Title Page
Abstract Introduction
Conclusions References
Tables Figures
◭ ◮
◭ ◮
Back Close
Full Screen / Esc
Printer-friendly Version Interactive Discussion
Discussion
P
a
per
|
Dis
cussion
P
a
per
|
Discussion
P
a
per
|
Discussio
n
P
a
per
|
Atmos. Chem. Phys. Discuss., 11, 9999–10029, 2011 www.atmos-chem-phys-discuss.net/11/9999/2011/ doi:10.5194/acpd-11-9999-2011
© Author(s) 2011. CC Attribution 3.0 License.
Atmospheric Chemistry and Physics Discussions
This discussion paper is/has been under review for the journal Atmospheric Chemistry and Physics (ACP). Please refer to the corresponding final paper in ACP if available.
Estimating seasonal variations in cloud
droplet number concentration over the
boreal forest from satellite observations
R. H. H. Janssen1, L. N. Ganzeveld1, P. Kabat1, M. Kulmala2, T. Nieminen2, and R. A. Roebeling3
1
Earth System Science and Climate Change, Wageningen University and Research Centre, Wageningen, The Netherlands
2
Department of Physics, P. O. Box 64, 00014 University of Helsinki, Finland
3
Royal Netherlands Meteorological Institute, De Bilt, The Netherlands
Received: 25 February 2011 – Accepted: 17 March 2011 – Published: 25 March 2011 Correspondence to: R. H. H. Janssen (ruud.janssen@wur.nl)
Published by Copernicus Publications on behalf of the European Geosciences Union.
ACPD
11, 9999–10029, 2011Cloud droplet concentration over
the boreal forest
R. H. H. Janssen et al.
Title Page
Abstract Introduction
Conclusions References
Tables Figures
◭ ◮
◭ ◮
Back Close
Full Screen / Esc
Printer-friendly Version Interactive Discussion
Discussion
P
a
per
|
Dis
cussion
P
a
per
|
Discussion
P
a
per
|
Discussio
n
P
a
per
|
Abstract
Seasonal variations in cloud droplet number concentration (NCD) in low-level stratiform
clouds over the boreal forest are estimated from MODIS observations of cloud optical and microphysical properties, using a sub-adiabatic cloud model to interpret vertical profiles of cloud properties. An uncertainty analysis of the cloud model is included 5
to reveal the main sensitivities of the cloud model. We compared the seasonal cycle
inNCD obtained using 9 years of satellite data, to surface concentrations of potential
cloud activating aerosols, measured at the SMEAR II station at Hyyti ¨al ¨a in Finland.
The results show thatNCD and cloud condensation nuclei (CCN) concentrations have
no clear correlation at seasonal time scale. The fraction of aerosols that actually acti-10
vate as cloud droplet decreases sharply with increasing aerosol concentrations.
Fur-thermore, information on the stability of the atmosphere shows that lowNCD is linked
to stable atmospheric conditions. Combining these findings leads to the conclusion that cloud droplet activation for the studied clouds over the boreal forest is limited by convection. Our results suggest that it is important to take the strength of convection 15
into account when studying the influence of aerosols from the boreal forest on cloud formation, although they do not rule out the possibility that aerosols from the boreal forest affect other types of clouds with a closer coupling to the surface.
1 Introduction
The biosphere makes a very large contribution to the levels of atmospheric aerosols 20
and cloud condensation nuclei (Andreae and Rosenfeld, 2008). However, the feed-backs that are possibly associated with the emissions of natural aerosols have only re-cently started to receive substantial attention and therefore the scientific understanding of their drivers, climate impacts and interactions is low (Carslaw et al., 2010). One pro-posed feedback mechanism which involves aerosols of natural origin concerns the bo-25
ACPD
11, 9999–10029, 2011Cloud droplet concentration over
the boreal forest
R. H. H. Janssen et al.
Title Page
Abstract Introduction
Conclusions References
Tables Figures
◭ ◮
◭ ◮
Back Close
Full Screen / Esc
Printer-friendly Version Interactive Discussion
Discussion
P
a
per
|
Dis
cussion
P
a
per
|
Discussion
P
a
per
|
Discussio
n
P
a
per
|
produced by forests modify the radiation balance via their influence on cloud properties such as albedo, thereby posing a negative feedback on the surface temperature and on the productivity of the forest itself. They based their hypothesis on the observation that in the boreal forest, there is a strong coupling between the seasonal cycle in tempera-ture, vegetation productivity, biogenic emissions of Volatile Organic Compounds (VOC) 5
and the growth rate of freshly formed aerosol particles. Ongoing research has further confirmed the role of boreal forests as a contributor to both aerosol number by facili-tating new particle formation from gaseous precursors (Kavouras et al., 1998; O’Dowd et al., 2002, 2009; Laaksonen et al., 2008) and their subsequent growth by providing condensable species in the form of VOC oxidation products (Allan et al., 2006; Tunved 10
et al., 2006, 2008; Dal Maso et al., 2008).
Some studies have been undertaken to estimate the effect that the
vegetation-aerosol-cloud feedback may have on the surface radiation balance in the boreal forest. Spracklen et al. (2008) estimated the radiative forcing of the 1st indirect aerosol
ef-fect from biogenic aerosols over the boreal forest to be between−1.8 and−6.7 W m−2
15
using a chemical transport model that includes parameterizations of nucleation and condensational growth coupled to a simple radiation model. Another study that used a more conceptual approach to estimate the radiative forcing of particle formation over
the boreal forest yielded numbers up to−14 W m−2 (Kurt ´en et al., 2003). This would
imply that the aerosol effect may be able to compensate for a hypothesized present-day
20
net warming of the boreal forests through the combined effect of a decrease in surface
albedo and enhanced CO2-uptake (Betts, 2000; Bala et al., 2007).
New particle formation events are important contributors to the aerosol particle num-ber over the boreal forest (Kulmala et al., 2001; Dal Maso et al., 2007). The occurrence of particle formation events has a typical annual variation over the Scandinavian boreal 25
forest, with peaks in springtime and autumn and minima in winter and summer (Dal Maso et al., 2007). It has been shown that the aerosols that are produced during these nucleation events grow rapidly to sizes at which they can serve as cloud condensa-tion nuclei (CCN) (Lihavainen et al., 2003) and consequently are able to participate in
ACPD
11, 9999–10029, 2011Cloud droplet concentration over
the boreal forest
R. H. H. Janssen et al.
Title Page
Abstract Introduction
Conclusions References
Tables Figures
◭ ◮
◭ ◮
Back Close
Full Screen / Esc
Printer-friendly Version Interactive Discussion
Discussion
P
a
per
|
Dis
cussion
P
a
per
|
Discussion
P
a
per
|
Discussio
n
P
a
per
|
cloud droplet formation (Kerminen et al., 2005). The growth rates of these newly formed particles are strongly correlated to concentrations of monoterpene oxidation products (Laaksonen et al., 2008; Allan et al., 2006). Monoterpenes are emitted in large quanti-ties by boreal forests, following a strong seasonal pattern, determined by a pronounced seasonal cycle in temperature, light intensity and vegetation productivity (Hakola et al., 5
2003; Lappalainen et al., 2009). Once oxidized, these organics condense onto freshly nucleated clusters to grow them to sizes larger than 3 nm, which allows them to survive as individual aerosols (O’Dowd et al., 2002; Cavalli et al., 2006), and contribute to their further growth to a diameter of 50 to 100 nm, which allows them to act as CCN (Tunved et al., 2008). The findings of these studies were confirmed by Sihto et al. (2010) who 10
derived, from information on the hygroscopicity of the aerosol at Hyyti ¨al ¨a, that aerosols
that have grown to the size of CCN consist for a large part (∼80%) of organic material.
The number of aerosols that eventually activate into cloud droplets depends on the aerosol concentration, size distribution and chemical properties and on the updraft ve-locity, which determines the maximum supersaturation in a cloud parcel (McFiggans 15
et al., 2006; Reutter et al., 2009). Once activated into cloud droplets, aerosols affect
the cloud optical and microphysical properties through various Aerosol Indirect Effects
(AIE). Twomey (1977) suggested that adding aerosols increases the droplet concentra-tion and decrease the droplet size of clouds with a given liquid water path (LWP), which
in turn leads to an increase of the cloud albedo (1st indirect effect). Albrecht (1989)
20
proposed that the changes in cloud microphysics lead to a less efficient formation of
precipitation and an increase in cloud lifetime (2nd indirect effect), while Lohmann and
Feichter (2005) discussed several semi-direct effects such as cloud warming due to
increased absorption of solar radiation by black carbon aerosols.
Satellite remote sensing is a widely used tool for determining the AIE. Retrievals 25
of cloud optical thickness and effective radius are required to determine the
ACPD
11, 9999–10029, 2011Cloud droplet concentration over
the boreal forest
R. H. H. Janssen et al.
Title Page
Abstract Introduction
Conclusions References
Tables Figures
◭ ◮
◭ ◮
Back Close
Full Screen / Esc
Printer-friendly Version Interactive Discussion
Discussion
P
a
per
|
Dis
cussion
P
a
per
|
Discussion
P
a
per
|
Discussio
n
P
a
per
|
way to circumvent this problem is to estimate the cloud droplet number concentration (NCD), since it directly links cloud optical and microphysical properties to the aerosol
concentration at cloud base. Several methods have been developed for this purpose,
each one requiring different assumptions about the sub-adiabatic character of and the
mixing that occurs inside clouds (Bennartz, 2007; Boers et al., 2006; Szczodrak et al., 5
2001).
The method developed by Boers et al. (2006) (hereinafter referred to as B06), was validated by Roebeling et al. (2008), combining ground-based observations of cloud
depth (h) and LWP with calculations of the cloud model using data from the
SEVIRI-instrument onboard METEOSAT as input. This showed very good agreement for strictly 10
selected cases over the Netherlands.
Until now, however, there is little observational evidence for the influence of aerosols, which are formed in the boreal forest, on cloud optical and microphysical properties. Most of these measurements are performed at a clean background site in northern Finland, Pallas (Komppula et al., 2005; Kerminen et al., 2005; Lihavainen et al., 2008), 15
which is at the northern border of the boreal forest. Recently, Lihavainen et al. (2010) estimated aerosol-cloud interactions over Pallas, using a combination of ground-based and MODIS data of cloud and aerosol properties. Their focus was how
quantifica-tion of the aerosol burden affects the measured strength of aerosol-cloud interactions
comparing ground-based and satellite measurements. 20
In our study we combine satellite observations of cloud properties over the SMEAR II measurement station at Hyyti ¨al ¨a in Finland with ground-based observations of aerosol concentrations and meteorological fields from ECMWF-reanalysis (1) to assess the
seasonal variability inNCD of low level liquid water clouds over the boreal forest and
(2) to determine the role of surface aerosol concentration and meteorology in explaining 25
this variability.
In Sect. 2 we first present the applied methodology including a description of the selection of the satellite and surface data an introduction of the cloud model and a de-tailed uncertainty analysis. Section 3 shows the results of our analysis, including the
ACPD
11, 9999–10029, 2011Cloud droplet concentration over
the boreal forest
R. H. H. Janssen et al.
Title Page
Abstract Introduction
Conclusions References
Tables Figures
◭ ◮
◭ ◮
Back Close
Full Screen / Esc
Printer-friendly Version Interactive Discussion
Discussion
P
a
per
|
Dis
cussion
P
a
per
|
Discussion
P
a
per
|
Discussio
n
P
a
per
|
observed cloud properties and their relation to aerosol concentrations and meteorol-ogy. The paper is concluded by a discussion and conclusions Sect. (4).
2 Data and methods
We present an analysis of cloud properties as observed by the MODIS-instrument onboard the Terra satellite in combination with ground based measurements of aerosol 5
concentration and meteorological fields obtained from the ECMWF-server. As it is not possible to deriveNCD directly from the reflection spectra of solar radiation by clouds,
we apply a model which generalizes the properties of stratiform liquid water clouds to
estimateNCD. The advantage of using satellite based measurements is that it allows to
monitor the seasonal cycle in cloud optical and microphysical properties over several 10
years, and thus get a statistically robust signal. We calculated median values of both the satellite, aerosol and meteorological data over periods of about one week.
2.1 Satellite data selection
We used 9 years (2000–2008) of MODIS-Terra Level2 (collection 005)-data (Platnick et al., 2003), which comprise pixel level retrievals (1 km resolution) of cloud optical and 15
microphysical properties. We averaged cloud properties over a 2×2◦latitude-longitude
box centered over the SMEAR II measurement station, Hyyti ¨al ¨a, Finland.
Since the cloud model is only valid for single-layered water clouds we selected clouds according to their cloud optical thicknessτ (3.7< τ <20) and cloud top pressure pct
(pct>780 hPa, corresponding to a cloud top height lower than about 2.5 km) based on
20
ACPD
11, 9999–10029, 2011Cloud droplet concentration over
the boreal forest
R. H. H. Janssen et al.
Title Page
Abstract Introduction
Conclusions References
Tables Figures
◭ ◮
◭ ◮
Back Close
Full Screen / Esc
Printer-friendly Version Interactive Discussion
Discussion
P
a
per
|
Dis
cussion
P
a
per
|
Discussion
P
a
per
|
Discussio
n
P
a
per
|
are optically thicker. We constrained the retrievals to days for which the solar zenith
angle did not exceed 60◦, which roughly limited our retrievals to the months of April
to September, coinciding with the boreal forest growing season. Furthermore, we se-lected only data with a satellite sensor zenith angle smaller than 60◦, to avoid the data to be affected by 3-D-radiative effects in the cloud (V ´arnai and Marshak, 2007). Fi-5
nally, we only included pixels for which MODIS cloud phase qualified as ‘opaque water clouds’ to exclude the possible influence of ice clouds on the retrieval.
2.2 Ground-based measurements
The observations are performed over the SMEAR II field station at Hyyti ¨al ¨a (61◦51′N,
24◦17′E) in southern Finland, where ecosystem, meteorological and aerosol properties
10
are measured since 1996 (Hari and Kulmala, 2005). The site is during the growing season (April-September) most of the time showing a footprint of marine air masses, except for the months of April when continental air dominates and July when marine and continental air masses have equal shares (Sogacheva et al., 2008). Levels of anthropogenic pollution are low, especially during periods when air masses arrive from 15
the sparsely populated northern sector. For a more detailed site description, see e.g. Kulmala et al. (2001).
Aerosol size distribution data are obtained from differential mobility particle sizer
(DMPS) (Aalto et al., 2001) that measured aerosols in the range from 3 and 500 nm un-til December 2004 and aerosols between 3 to 1000 nm in diameter after that date. The 20
number concentrations of aerosols above a certain activation diameter was obtained by summing the aerosols from that diameter up to the upper limit of the measured size distribution, thus assuming a fixed chemical composition of the aerosol over the size distribution.
Cloud condensation nuclei at various supersaturations have been measured with 25
a CCN counter from July 2008 to June 2009. A more detailed description of these measurements is given by Sihto et al. (2010).
ACPD
11, 9999–10029, 2011Cloud droplet concentration over
the boreal forest
R. H. H. Janssen et al.
Title Page
Abstract Introduction
Conclusions References
Tables Figures
◭ ◮
◭ ◮
Back Close
Full Screen / Esc
Printer-friendly Version Interactive Discussion
Discussion
P
a
per
|
Dis
cussion
P
a
per
|
Discussion
P
a
per
|
Discussio
n
P
a
per
|
2.3 Cloud model
We used the cloud model of B06 to calculateNCD andhfrom satellite observations of
cloud droplet effective radius (reff) and cloud optical thickness (τ).
The model represents the microphysics and thermodynamics of a single-layered wa-ter cloud based on functions of the following form:
5
NCD=A1τ1/2r− 5/2
eff (1)
and
h=A2τ1/2r 1/2
eff , (2)
where:
NCD: cloud droplet number concentration (cm−
3
) 10
h: cloud physical thickness (m)
reff: effective radius of cloud droplets (µm)
τ: cloud optical thickness (−)
A1,A2: factors that contain the model’s uncertainties with respect to cloud
thermody-namics and microphysics. 15
The factorsA1 andA2 are not constant, but depend on assumptions about the
follow-ing four cloud thermodynamic and microphysical factors: (1) the subadiabatic behavior of the cloud, represented by the subadiabatic fractionFrof the liquid water path, (2) the shape of the liquid water profile (linear or C-shaped), (3) the ratio between the volume 20
radius and effective radius of the cloud dropletsk1 and 4) if the variation in the
verti-cal profile of the liquid water content (LWC) is associated with variation in the droplet concentration or droplet volume radius or both.
The reason that the model is only valid for stratiform clouds is that these clouds are
relatively homogeneous, so that the vertical profiles of LWC,NCD and other physical
25
ACPD
11, 9999–10029, 2011Cloud droplet concentration over
the boreal forest
R. H. H. Janssen et al.
Title Page
Abstract Introduction
Conclusions References
Tables Figures
◭ ◮
◭ ◮
Back Close
Full Screen / Esc
Printer-friendly Version Interactive Discussion
Discussion
P
a
per
|
Dis
cussion
P
a
per
|
Discussion
P
a
per
|
Discussio
n
P
a
per
|
stratiform clouds in or just above the boreal forest boundary layer, the clouds most likely to be affected by the aerosols from the forest.
For the derivation of the model we refer to the papers of B06 and Boers and Rot-stayn (2001). Here we limit ourselves to an introduction of the governing equations of the cloud model and focus in particular on the associated uncertainties. The equa-5
tions to calculateNCD and hfrom the input of satellite-based cloud optical properties
respectively with the factorsA1 andA2 fully written out are:
NCD=2−2/331/2π−1
ρ
a
ρw
1/2
A1ad/2k−3 1 F
−1/2
i (Fr,α)G
5/2
i (Fr,α)τ
1/2r−5/2
eff (3)
, and
h=
2 3
ρ
w
ρa
A−1 adF
−1
i (Fr,α)G−
1
i (Fr,α)·τ·reff
1/2
(4) 10
where:
ρa: density of air (kg m− 3
)
ρw: density of water (kg m− 3
)
Aad: adiabatic lapse rate of liquid water mixing ratio (g g−1m−1)
k1: ratio between the second moment of the droplet size (volume radiusrv) distribution
15
and its 3rd moment (effective radiusreff) (−)
α: factor that determines shape of liquid water vertical profile (−)
Fr: subadiabatic fraction (−)
Fi andGi are functions related to the mixing model that is used. 20
It is obvious from these relationships that NCD and h depend on a large number
of parameters which are often poorly constrained. Therefore, a thorough uncertainty analysis is required.
ACPD
11, 9999–10029, 2011Cloud droplet concentration over
the boreal forest
R. H. H. Janssen et al.
Title Page Abstract Introduction Conclusions References Tables Figures ◭ ◮ ◭ ◮ Back Close
Full Screen / Esc
Printer-friendly Version Interactive Discussion Discussion P a per | Dis cussion P a per | Discussion P a per | Discussio n P a per |
2.4 Uncertainty analysis
Calculation of NCD and h is subject to uncertainties in the retrievals of reff and τ by
MODIS and uncertainties that arise from using the cloud model. In this section we discuss possible error sources in both retrieval and the cloud model, whether they are random or systematic and how they propagate through the analysis. We are aware of 5
the fact that the uncertainty estimates are themselves often uncertain, but the following analysis will give some insight in the contributions of the individual input parameters to the total uncertainty estimate.
Since the relation between the input variables and output variables of Eqs. (3) and (4) follows a power law (i.e.X=Yβ), the sensitivity of any output variable to any input 10
parameter or variable can be written as:
∂X ∂Y =β
X
Y (5)
where:β: exponent of the power law relation betweenX andY.
If we assume that the errors are normally distributed we can use Gaussian error propagation and write the relative errors ofNCD andh, respectively, as follows:
15 ∂N CD NCD 2 =
3∂k1
k1 2 + 1 Z1 ∂Z1 ∂Fr 2 + 1 2 ∂Aad Aad 2 + 5 2
∂reff
reff 2 + 1 2 ∂τ τ 2 (6) ∂h h 2 = 1 Z2 ∂Z2 ∂Fr 2 + 1 2 ∂Aad Aad 2 + 1 2
∂reff
reff 2 + 1 2 ∂τ τ 2 (7) where:
Z1(Fr)=F−
1
2(Fr,α)G 5
2(Fr,α) (8)
Z2(Fr)=F−
1
2(Fr,α)G− 1
2(Fr,α) (9)
20
ACPD
11, 9999–10029, 2011Cloud droplet concentration over
the boreal forest
R. H. H. Janssen et al.
Title Page
Abstract Introduction
Conclusions References
Tables Figures
◭ ◮
◭ ◮
Back Close
Full Screen / Esc
Printer-friendly Version Interactive Discussion
Discussion
P
a
per
|
Dis
cussion
P
a
per
|
Discussion
P
a
per
|
Discussio
n
P
a
per
|
Uncertainty in effective radius (reff) and cloud optical thickness (τ)
The retrievals of MODIS Level 2 (the already processed raw spectral data) cloud optical and microphysical properties are described by Platnick et al. (2003). We used data from Collection 005, which are the first MODIS Cloud Optical Properties retrievals to include pixel-level uncertainty estimates (King et al., 2006). The mean error for both 5
reffandτis about 13%. Based on these references, we estimate a random component
of 25%, which, after spatially averaging the pixel values in the latitude-longitude box and temporally averaging these in bins, results in an error of 10%. This error estimate acknowledges the systematic error in MODIS, but the temporal and spatial averaging levels out the random part of the error.
10
Uncertainty in ratio between volume and effective radius (k1)
The parameter k1 relates the volume radius to the reff of a droplet size distribution
and therefore contains information on the skewness and dispersion of the droplet size distribution. For the typical values of NCD that we find in our study (<100 cm−
3
), the range of possible values ofk1 is relatively small. Following B06, we take k1=0.87± 15
0.03, so thatd k1/k1=0.03/0.87=3%.
Uncertainty in subadiabatic fraction (Fr)
The cloud model considers the fact that mixing in of air into the cloud is a non-adiabatic process by means of applying a subadiabatic fractionFrto the cloud liquid water profile.
For single-layered water cloudsFr will roughly vary between 0.3 and 0.9, depending on
20
the intensity of turbulent entrainment and vertical mixing of the clouds and surrounding
air. A smallerFr, for fixed values of the other parameters, means that the liquid water
is distributed over a larger vertical portion of the cloud, causing larger values ofhand
smaller values of NCD. Since we have no further information on the actual Fr, we
ACPD
11, 9999–10029, 2011Cloud droplet concentration over
the boreal forest
R. H. H. Janssen et al.
Title Page
Abstract Introduction
Conclusions References
Tables Figures
◭ ◮
◭ ◮
Back Close
Full Screen / Esc
Printer-friendly Version Interactive Discussion
Discussion
P
a
per
|
Dis
cussion
P
a
per
|
Discussion
P
a
per
|
Discussio
n
P
a
per
|
applied a value of 0.6 forFr, comparable to the values used in previous studies (B06,
Roebeling et al., 2008). For the uncertainty inFr, we follow B06 and setFr to 0.6±0.3.
We numerically evaluated the cloud model for these variations inFr, which yielded an
error of 26% for typical values ofreff,τandAadfound in our study.
Uncertainty in adiabatic lapse rate of liquid water content mixing ratio (A ad)
5
The adiabatic lapse rate of liquid water mixing ratioAad (g g− 1
m−1) depends on
tem-perature and pressure (Betts and Harshvardhan, 1987). Since it is equal to the amount of water that condenses when a parcel of air rises along the moist adiabat, it is coupled
to the moist adiabatic lapse rate Γm. To obtain the range in Aad during the season,
we need information on the cloud base temperature and pressure. For Hyyti ¨al ¨a, the 10
seasonal surface temperature range defined as the mean temperature in the warmest minus the mean temperature in the coldest month in the period of our retrievals is about
13◦C (e.g. Kulmala et al., 2004). By assuming a mean cloud base at 1000 m and a
well mixed boundary layer, the cloud base temperature (Tcb) can be estimated using:
Tcb=Ts−hcbΓd (10)
15
where:
Ts: surface temperature (K)
hcbcloud base height (m)
Γd: dry adiabatic lapse rate (K m− 1
) 20
Under these assumptions, we arrive at an estimated minimum and maximum cloud base temperature over Hyyti ¨al ¨a of−7◦C and 6◦C, respectively. For an estimated mean cloud base pressure of 900 hPa, the corresponding minimum and maximum values of
Aadis 1.09×10− 8
and 1.78×10⁻⁸, respectively. This yields a meanAadof 1.44×10− 8
± 0.35×10⁻⁸implying an error of 24%.
ACPD
11, 9999–10029, 2011Cloud droplet concentration over
the boreal forest
R. H. H. Janssen et al.
Title Page
Abstract Introduction
Conclusions References
Tables Figures
◭ ◮
◭ ◮
Back Close
Full Screen / Esc
Printer-friendly Version Interactive Discussion
Discussion
P
a
per
|
Dis
cussion
P
a
per
|
Discussion
P
a
per
|
Discussio
n
P
a
per
|
Variations inAadare likely to be systematic on seasonal time scales, because of it’s
coupling to temperature. Since a higher (lower)Aad leads to a higher (lower)NCD, this
will lead to an overestimation of theNCD in spring and autumn and an underestimation
in summer.
Finally there are two parameters that control the vertical profiles of cloud optical prop-5
erties in the cloud model, but which do not contribute significantly to the uncertainty in
the calculations ofNCD andh, but which are discussed here for completeness.
The parameter α determines the curvature of the liquid water profile in the cloud
model. Following B06, the value is fixed at 0.3. They found that vertically averaged values ofNCD andhare insensitive to the choice ofα.
10
Mixing with dry air from outside the cloud causes the liquid water path to deviate from the adiabatic water path. There are basically two contrasting possible assumptions on the effects of non-adiabaticity on the vertical profile of the liquid water path (1) either the departure from the adiabatic liquid water path is caused by a change in droplet
vol-ume, while cloud droplet numberNCD is constant, or (2) theNCD is changed, while the
15
droplet volume remains constant. The former is referred to as homogeneous mixing, since the mixing evaporates water from all cloud droplets at an equal rate. The sec-ond situation is referred to as inhomogeneous mixing, because the cloud droplets are evaporated due to dilution of the cloud parcel with environmental air, while the volume of the remaining droplets is conserved. Interestingly, both assumptions result in about 20
the same vertically averagedNCD (B06), so our results are insensitive to the
assump-tion on homogenous or inhomogeneous mixing condiassump-tions. We have chosen to use the inhomogeneous mixing assumption in our analysis.
Combining all the discussed uncertainties in the individual input parameters, using Eqs. (6) and (7), we obtain a relative error in the calculation ofNCDandhof respectively
25
38% and 21%. The most important parameters contributing to these errors are Fr
andAad. To illustrate the sensitivity of the cloud model to these two major sources of
uncertainty on the error estimate, their combined effect is shown in Fig. 1.
ACPD
11, 9999–10029, 2011Cloud droplet concentration over
the boreal forest
R. H. H. Janssen et al.
Title Page
Abstract Introduction
Conclusions References
Tables Figures
◭ ◮
◭ ◮
Back Close
Full Screen / Esc
Printer-friendly Version Interactive Discussion
Discussion
P
a
per
|
Dis
cussion
P
a
per
|
Discussion
P
a
per
|
Discussio
n
P
a
per
|
These large errors mean that the CCN that reach cloud base only partly explain
NCD and h as calculated by the model, due to variations in cloud microphysics and
thermodynamics that are not constrained by the satellite data.
3 Results
We present an analysis of the seasonal cycle inNCDand the relationship betweenNCD
5
and surface aerosol concentration and meteorology.
3.1 Seasonal cycle inNCD
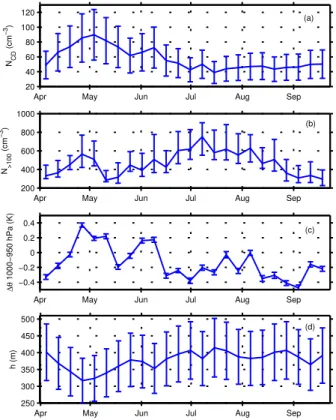
The seasonal cycles of satellite retrieved cloud properties from MODIS are shown in
Fig. 2. The seasonal cycles inreff and τshow both largest values at the beginning of
April and a rapid decrease to a minimum in late April. After that both variables increase 10
again. A large interannual variability results in large uncertainties in the retrievals ofreff
in April. The cause of this large interannual variability for this period is not clear. We conducted a sensitivity analysis to assess the changes in retrieved variable val-ues as a function of the spatial domain over which the cloud properties are averaged. Changing the size of the box to 1×1◦ and 3×3◦ did not significantly impact these out-15
comes. To test the sensitivity of the retrievals to the definition of the cloud type, we
relaxed theτ-constraint to include clouds with a optical thickness up to 100. This also
did not change the seasonal cycle in observed cloud properties qualitatively.
The calculated seasonal cycle in NCD mainly follows the variations in reff (Fig. 3a).
Seasonal variations inτonly slightly dampen the seasonal cycle inNCD. The real
sea-20
sonal cycle inNCD is expected to be less pronounced than depicted in Fig. 3, because
of the dampening effect of the seasonal variation inAad on theNCD, due to it’s coupling
to temperature as previously discussed in the section on error propagation. The range
of absolute numbers ofNCD(between 40 and 100 per cm
3
) are rather low for
continen-tal areas and resemble the numbers found by B06 for a remote marine location. NCD
ACPD
11, 9999–10029, 2011Cloud droplet concentration over
the boreal forest
R. H. H. Janssen et al.
Title Page
Abstract Introduction
Conclusions References
Tables Figures
◭ ◮
◭ ◮
Back Close
Full Screen / Esc
Printer-friendly Version Interactive Discussion
Discussion
P
a
per
|
Dis
cussion
P
a
per
|
Discussion
P
a
per
|
Discussio
n
P
a
per
|
peaks in late April and early May. After experiencing a minimum in mid-summer,NCD
seems to increase again in September, although this increase is not significant.
The calculations of cloud thickness hfollow the pattern of reff and τ, although the
uncertainty of this result is large (Fig. 3d).
3.2 Relation to surface aerosol concentrations and meteorology
5
To find out if the seasonal cycle inNCD is driven by the number of activated aerosols
we compared it to surface concentrations of potential cloud nucleating aerosols. Since CCN-measurements are not available for the whole period of available satellite
obser-vations, we applied observations of aerosols with a diameter above a certain cut-off
diameter as a proxy for CCN-concentrations (NCCN) since size is in general a good
10
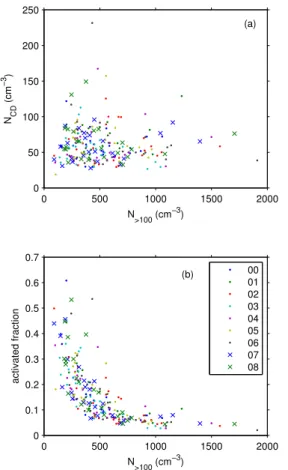
indicator of ability of aerosols to act as CCN (Dusek et al., 2006). We find that the number concentration of aerosols with a diameter larger than 100 nm (N>100from here
onwards) is the best proxy forNCCNat 0.2% supersaturation (Fig. 4) with a correlation
ofr=0.78 for the period July–September 2008 and April–June 2009.
The seasonal cycle inNCD, however, does not resemble the seasonal cycle inN>100
15
(Fig. 3). The latter does have a similar peak in spring as the former, but the maximum in summer inN>100 can not be seen in theNCD. Actually, comparing individual years,
it turned out that the collective peak in spring is mainly reflecting a bias due to one
year in whichN>100had a very strong maximum in spring, which did not coincide with
a maximum inNCDfor that year. The lack of correlation ofNCD andN>100can be seen
20
from Fig. 5a. The correlation coefficient of the median seasonal cycles over all years in
NCD andN>100 isr=−0.23, while for individual years it varies betweenr=−0.37 and
r=0.25. In addition, the absolute numbers of NCD and N>100 differ approximately by
one order of magnitude which further supports the lack of a strong coupling between surface aerosol concentration and low-altitude clouds.
25
Sihto et al. (2010), however, found that at Hyyti ¨al ¨a the critical aerosol diameter
for cloud droplet activation (dcrit) for a given supersaturation can vary considerably
ACPD
11, 9999–10029, 2011Cloud droplet concentration over
the boreal forest
R. H. H. Janssen et al.
Title Page
Abstract Introduction
Conclusions References
Tables Figures
◭ ◮
◭ ◮
Back Close
Full Screen / Esc
Printer-friendly Version Interactive Discussion
Discussion
P
a
per
|
Dis
cussion
P
a
per
|
Discussion
P
a
per
|
Discussio
n
P
a
per
|
the seasonal variation in chemical composition of the aerosol at Hyyti ¨al ¨a: the aerosol contains a large fraction of organics in summer and has a relatively large contribution
from anthropogenic sources in winter. It means that the seasonal dynamics of NCCN
may be different from those ofN>100.
For CCN at 0.2% supersaturationdcritvaries roughly between 80 and 120 nm during
5
the growing season (Sihto et al., 2010, Fig. 4). To test whether the lack of correlation with NCD was a result of specifically using N>100 as a proxy for low supersaturation
CCN, we also tested the seasonal cycle in aerosol concentrations for values ofdcrit of
80 and 120 nm (N>80 andN>120, respectively). N>80 andN>120 are added to Fig. 3 as
respectively the upper and lower bound of the errorbars aroundN>100. The seasonal
10
cycle of all these variables show the same two peaks in spring and summer,
respec-tively, and therefore we conclude that the lack of correlation between NCD and NCCN
does not strongly depend on the selection of the particular threshold diameter of the aerosol.
We discuss the activation of aerosols into cloud droplets in terms of the activated 15
fraction (Fact), here defined as:
Fact=
NCD
NCCN
≈ NCD
N>100
(−) (11)
where:
NCD: cloud droplet number concentration (cm−
3
)
NCCN: surface CCN-concentration (cm−
3
) 20
N>100: proxy for surfaceNCCNat 0.2% supersaturation (cm− 3
)
Fact thus gives information on the sensitivity of the cloud droplet activation toNCCN.
This means that we do not distinguish between whether activation of cloud droplets is limited by the transport of CCN from the surface to cloud base or whether the actual 25
ACPD
11, 9999–10029, 2011Cloud droplet concentration over
the boreal forest
R. H. H. Janssen et al.
Title Page
Abstract Introduction
Conclusions References
Tables Figures
◭ ◮
◭ ◮
Back Close
Full Screen / Esc
Printer-friendly Version Interactive Discussion
Discussion
P
a
per
|
Dis
cussion
P
a
per
|
Discussion
P
a
per
|
Discussio
n
P
a
per
|
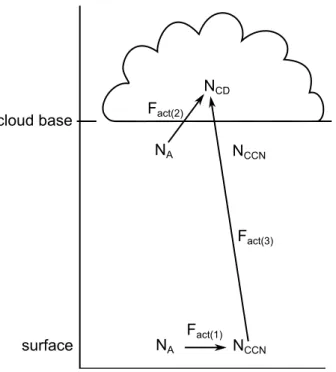
droplet activation, the activated fraction is defined as the ratio between the total aerosol concentration (NA) at cloud base andNCD(Kulmala et al., 1993; Reutter et al., 2009).
Another definition is used in studies of CCN-activation (Jur ´anyi et al., 2010; Sihto et al.,
2010), whereFact is defined as the ratio betweenNA andNCCN at the surface. These
different definitions are illustrated in Fig. 6. 5
In Fig. 5b we show thatFactis large for lowN>100and small for highN>100. This
sug-gests that cloud droplet activation is not limited by the availability of cloud-nucleating
aerosols; whenN>100 increases, droplet activation reaches saturation as can be seen
from the decreasingFact. This situation is described as a regime where cloud droplet
activation is updraft limited in a theoretical study of the influence of aerosol number, size 10
and hygroscopicity on the cloud droplet activation of aerosols by Reutter et al. (2009) (see also Kulmala et al., 1993). When the updraft velocity is small, only a small frac-tion of the aerosols that reach cloud base activate as cloud droplets. Because these aerosols attract water, the supersaturation in the cloud is quenched, which inhibits fur-ther cloud droplet activation. Adding more aerosols will consequently not lead to more 15
cloud droplets. The behavior ofFact, as presented in Fig. 5b, is similar to their results
for conditions of low updraft velocities and hence low supersaturations (Reutter et al., 2009, Fig. 4).
Information on the strength of convection could give more insight in the processes behind this behavior. As an indicator for convection, we use the potential temperature 20
difference close to the surface, which represents thermal (in)stability in the sub-cloud layer. We obtained these data from the ECMWF ERA-Interim dataset on the ECMWF Data Server for the same spatial domain as we have obtained cloud properties for.
Figure 3 shows a strong correlation betweenNCD and the potential temperature diff
er-ence between 1000–950 hPa (∆θ1000−950) with a correlation coefficientr=0.79. The
25
median seasonal cycle over all years inNCD and∆θ1000−950 both show two peaks in
spring and early summer, while the minimum inNCDduring summer is less pronounced
in∆θ1000−950.
ACPD
11, 9999–10029, 2011Cloud droplet concentration over
the boreal forest
R. H. H. Janssen et al.
Title Page
Abstract Introduction
Conclusions References
Tables Figures
◭ ◮
◭ ◮
Back Close
Full Screen / Esc
Printer-friendly Version Interactive Discussion
Discussion
P
a
per
|
Dis
cussion
P
a
per
|
Discussion
P
a
per
|
Discussio
n
P
a
per
|
For the individual years, the correlations between NCD and ∆θ1000−950 are weaker
and vary between 0.58 and 0.11, but the sign is consistently positive. A similar, but
somewhat weaker, relation was found betweenNCDand the potential temperature
dif-ference between 1000–900 hPa.
4 Discussion and conclusions
5
Our results show that there is a clear seasonal cycle inNCD in low level liquid water
clouds over Hyyti ¨al ¨a. This seasonal cycle can, however, not be explained by seasonal variations in concentrations of cloud active aerosols. Rather, the sharp decrease of
activated fraction with increasing NCCN suggests that droplet activation in the clouds
that are included in our analysis is updraft-limited (cf. Reutter et al., 2009). The good 10
correlation between NCD and the stability of the boundary layer, as diagnosed from
the potential temperature difference, further indicates that the transport and mixing
of the aerosols from the surface to cloud base is an important factor for determining which part of the aerosols actually activate into cloud droplets. Both findings could be explained by the fact that the studied clouds, low-level stratiform clouds over the boreal 15
forest, represent a cloud type and environment, respectively, which are not associated with the occurrence of strong convection. However, based on this analysis, we can not say whether the transport of aerosols from the surface to cloud base or the actual activation of those aerosols in the cloud is the limiting factor for cloud droplet activation (Fig. 6). Therefore, we use the term convective limitation to acknowledge that both the 20
effects of transport and activation and possibly a combination of them could be limiting factors for cloud droplet activation.
Formation of convective cumulus clouds, on the other hand, is closely coupled to surface conditions (e.g. Brown et al., 2002) and to conditions of stronger convection and therefore higher updraft velocities. Consequently, for these clouds the signal of 25
theNCD is more likely to follow theNCCN at the surface. So our results, with a focus
ACPD
11, 9999–10029, 2011Cloud droplet concentration over
the boreal forest
R. H. H. Janssen et al.
Title Page
Abstract Introduction
Conclusions References
Tables Figures
◭ ◮
◭ ◮
Back Close
Full Screen / Esc
Printer-friendly Version Interactive Discussion
Discussion
P
a
per
|
Dis
cussion
P
a
per
|
Discussion
P
a
per
|
Discussio
n
P
a
per
|
influence the other types of clouds over the forest. However, our results suggest that it is important to take the strength of convective transport into account when studying the AIE over boreal forests.
This convection-limitation may therefore be one of the factors to explain the weaker aerosol-cloud interaction as derived from satellite measurements of cloud properties 5
combined with ground-based measurements of aerosol concentration, compared to ground-based measurements of both aerosols and cloud properties only as found by Lihavainen et al. (2010) for the northern high-latitude site Pallas. For the boundary layer clouds which are included in their satellite observations, the transport of aerosols to- and their activation in the cloud may be a limiting factor for their influence on cloud 10
properties. This may be less important for the very low altitude clouds, which are that close to the surface that they surround the measurement station during some of the time.
Opposite to our results, Boers et al. (2006) found a clear relation betweenNCD and
NCCN. They, however, studied clouds over the ocean, which do not experience the
15
strong diurnal cycle in atmospheric boundary layer as over land. Therefore a well-mixed boundary layer is almost constantly present, which facilitates the transport of
aerosol particles from the ocean surface to cloud base. The low values of NCD that
they find may indicate an aerosol-limited regime of cloud droplet activation.
The method to retrieve NCD that we applied in our study represents the
state-of-20
the-art of current remote sensing techniques at high latitudes. Still, the error in the
calculation of NCD is large due to uncertainties in the representation of cloud
micro-physics and thermodynamics. This large error may causeNCD to vary independently
from the number of CCN that actually reach cloud base. In this case, we find that
there is a seasonal cycle in NCD that has a distinct shape that can not be explained
25
by a systematic seasonal variance in one of the input factors or cloud model param-eters. Roebeling et al. (2008) showed that the method of B06 works well for carefully selected conditions (no drizzle, single layer, homogeneous in space and time, water phase), preferably supported with ground-based observations (lidar, radar, information
ACPD
11, 9999–10029, 2011Cloud droplet concentration over
the boreal forest
R. H. H. Janssen et al.
Title Page
Abstract Introduction
Conclusions References
Tables Figures
◭ ◮
◭ ◮
Back Close
Full Screen / Esc
Printer-friendly Version Interactive Discussion
Discussion
P
a
per
|
Dis
cussion
P
a
per
|
Discussion
P
a
per
|
Discussio
n
P
a
per
|
about cloud base height and temperature). However, in their study over the Nether-lands the number of cases that met the boundary conditions was limited. The same may be the case over Finland. Thus proving the first AIE from satellite retrievals re-quires very careful selection of representative cases. Therefore, we recommend that
these satellite derived observations ofNCD should be validated with in-situ
measure-5
ments of cloud properties over the boreal forest, for example by radiosonde or airplane measurements or by ground based remote sensing.
The data presented in this study are among the first observations of cloud properties over the boreal forest, related to the production of cloud active aerosols by the forest.
We find that theNCD in the studied clouds is insensitive to aerosol concentrations at
10
the surface. Furthermore, information on the vertical structure of the atmosphere
indi-cates that lowNCD is related to stable atmospheric conditions. From the combination
of these two findings we conclude that convection may be a limiting factor for the acti-vation of aerosols from the boreal forest as cloud droplets. Our analysis suggests that studies that do not take the role of convection into account when assessing the impact 15
of aerosols from the boreal forest on cloud properties may overestimate their indirect radiative forcing. It stresses the need for a stronger involvement of the boundary layer and cloud research communities in such analysis of land-atmosphere interactions fo-cusing on aerosols-cloud feedback mechanisms.
Acknowledgements. The authors would like to thank Sanna-Liisa Sihto and Michael Boy for
20
ACPD
11, 9999–10029, 2011Cloud droplet concentration over
the boreal forest
R. H. H. Janssen et al.
Title Page
Abstract Introduction
Conclusions References
Tables Figures
◭ ◮
◭ ◮
Back Close
Full Screen / Esc
Printer-friendly Version Interactive Discussion
Discussion
P
a
per
|
Dis
cussion
P
a
per
|
Discussion
P
a
per
|
Discussio
n
P
a
per
|
References
Aalto, P., H ¨ameri, K., Becker, E. D. O., Weber, R., Salm, J., M ¨akel ¨a, J. M., Hoell, C., O’Dowd, C. D., Karlsson, H., Hansson, H.-C., V ¨akev ¨a, M., Koponen, I. K., Buzorius, G., and Kulmala, M.: Physical characterization of aerosol particles during nucleation events, Tellus B, 53, 344– 358, 2001.
5
Albrecht, B. A.: Aerosols, Cloud Microphysics, and Fractional Cloudiness, Science, 245, 1227– 1230, 1989.
Allan, J. D., Alfarra, M. R., Bower, K. N., Coe, H., Jayne, J. T., Worsnop, D. R., Aalto, P. P., Kulmala, M., Hy ¨otyl ¨ainen, T., Cavalli, F., and Laaksonen, A.: Size and composition measurements of background aerosol and new particle growth in a Finnish forest during
10
QUEST 2 using an Aerodyne Aerosol Mass Spectrometer, Atmos. Chem. Phys., 6, 315– 327, doi:10.5194/acp-6-315-2006, 2006.
Andreae, M. O., and Rosenfeld, D.: Aerosol-cloud-precipitation interactions. Part 1. The nature and sources of cloud-active aerosols, Earth-Sci. Rev., 89, 13–41, 2008.
Bala, G., Caldeira, K., Wickett, M., Phillips, T. J., Lobell, D. B., Delire, C., and Mirin, A.:
Com-15
bined climate and carbon-cycle effects of large-scale deforestation, P. Natl. Acad. Sci. USA, 104, 6550–6555, 2007.
Bennartz, R.: Global assessment of marine boundary layer cloud droplet number concentration from satellite, J. Geophys. Res., 112, D02201, doi:10.1029/2006JD007547, 2007.
Betts, R. A.: Offset of the potential carbon sink from boreal forestation by decreases in surface
20
albedo, Nature, 408, 187–190, 2000.
Betts, A. K. and Harshvardhan: Thermodynamic constraint on the cloud liquid water feedback in climate models, J. Geophys. Res., 92, 8483–8485, 1987.
Boers, R. and Rotstayn, L. D.: Possible links between cloud optical depth and effective radius in remote sensing observations, Q. J. Roy. Meteor. Soc., 127, 2367-2-383, 2001.
25
Boers, R., Acarreta, J. R., and Gras, J. L.: Satellite monitoring of the first indirect aerosol effect: Retrieval of the droplet concentration of water clouds, J. Geophys. Res., 111, D22208, doi:10.1029/2005JD006838, 2006.
Brown, A. R., Cederwall, R. T., Chlond, A., Duynkerke, P. G., Golaz, J. C., Khairoutdinov, M., Lewellen, D. C., Lock, A. P., MacVean, M. K., Moeng, C. H., Neggers, R. A. J., Siebesma, A.
30
P., and Stevens, B.: Large-eddy simulation of the diurnal cycle of shallow cumulus convection over land, Q. J. Roy. Meteor. Soc., 128, 1075–1093, 2002.
ACPD
11, 9999–10029, 2011Cloud droplet concentration over
the boreal forest
R. H. H. Janssen et al.
Title Page
Abstract Introduction
Conclusions References
Tables Figures
◭ ◮
◭ ◮
Back Close
Full Screen / Esc
Printer-friendly Version Interactive Discussion
Discussion
P
a
per
|
Dis
cussion
P
a
per
|
Discussion
P
a
per
|
Discussio
n
P
a
per
|
Carslaw, K. S., Boucher, O., Spracklen, D. V., Mann, G. W., Rae, J. G. L., Woodward, S., and Kulmala, M.: A review of natural aerosol interactions and feedbacks within the Earth system, Atmos. Chem. Phys., 10, 1701–1737, doi:10.5194/acp-10-1701-2010, 2010.
Cavalli, F., Facchini, M. C., Decesari, S., Emblico, L., Mircea, M., Jensen, N. R., and Fuzzi, S.: Size-segregated aerosol chemical composition at a boreal site in southern Finland, during
5
the QUEST project, Atmos. Chem. Phys., 6, 993–1002, doi:10.5194/acp-6-993-2006, 2006. Dal Maso, M., Sogacheva, L., Aalto, P. P., Riipinen, I., Komppula, M., Tunved, P., Korhonen, L.,
Suur-Uski, V., Hirsikko, A., Kurt ´en, T., Kerminen, V.-M., Lihavainen, H., Yrj ¨o, V., Hansson, H.-C., and Kulmala, M.: Aerosol size distribution measurements at four Nordic field stations: identification, analysis and trajectory analysis of new particle formation bursts, Tellus B, 59,
10
350–361, 2007.
Dal Maso, M., Hyv ¨arinen, A., Komppula, M., Tunved, P., Kerminen, V.-M., Lihavainen, H., Viisa-nen, Y., Hansson, H.-C., and Kulmala, M.: Annual and interannual variation in boreal forest aerosol particle number and volume concentration and their connection to particle formation, Tellus B, 60, 495–508, 2008.
15
Dusek, U., Frank, G. P., Hildebrandt, L., Curtius, J., Schneider, J., Walter, S., Chand, D., Drewnick, F., Hings, S., Jung, D., Borrmann, S., and Andreae, M. O.: Size matters more than chemistry for cloud-nucleating ability of aerosol particles, Science, 312, 1375–1378, 2006.
Hakola, H., Tarvainen, V., Laurila, T., Hiltunen, V., Hell ´en, H., and Keronen, P.: Seasonal
vari-20
ation of VOC concentrations above a boreal coniferous forest, Atmos. Environ., 37, 1623– 1634, 2003.
Hari, P. and Kulmala, M.: Station for Measuring Ecosystem-Atmosphere Relations (SMEAR II), Boreal Env. Res., 10, 315–322, 2005.
Jur ´anyi, Z., Gysel, M., Weingartner, E., DeCarlo, P. F., Kammermann, L., and Baltensperger,
25
U.: Measured and modelled cloud condensation nuclei number concentration at the high alpine site Jungfraujoch, Atmos. Chem. Phys., 10, 7891–7906, doi:10.5194/acp-10-7891-2010, 2010.
Kavouras, I. G., Mihalopoulos, N., and Stephanou, E. G.: Formation of atmospheric particles from organic acids produced by forests, Nature, 395, 683–686, 1998.
30
ACPD
11, 9999–10029, 2011Cloud droplet concentration over
the boreal forest
R. H. H. Janssen et al.
Title Page
Abstract Introduction
Conclusions References
Tables Figures
◭ ◮
◭ ◮
Back Close
Full Screen / Esc
Printer-friendly Version Interactive Discussion
Discussion
P
a
per
|
Dis
cussion
P
a
per
|
Discussion
P
a
per
|
Discussio
n
P
a
per
|
King, M. D., Platnick, S. E., Hubanks, P. A., Arnold, G. T., Wind, G., and Wind, B.: Collection 005 change summary for the MODIS cloud optical property (06 OD) algorithm, in: Collection 005 Change Summary Documents, Level-2MODISAtmosphere Products, version 3.1, 9 May 2006 NASA Goddard Space Flight Cent., Greenbelt, Md., available at: http://modis-atmos. gsfc.nasa.gov/products C005update.html. 2006.
5
Komppula, M., Lihavainen, H., Kerminen, V.-M., Kulmala, M., and Viisanen, Y.: Measurements of cloud droplet activation of aerosol particles at a clean subarctic background site, J. Geo-phys. Res., 110, D06204, doi:10.1029/2004JD005200, 2005.
Kulmala, M., Laaksonen, A., Korhonen, P., Vesala, T., Ahonen, T., and Barrett, J. C.: The effect of atmospheric nitric acid vapor on cloud condensation nucleus activation, J. Geophys. Res.,
10
98, 22949–22958, 1993.
Kulmala, M., Hameri, K., Aalto, P. P., Makela, J. M., Pirjola, L., Nilsson, E. D., Buzorius, G., Rannik, U., Maso, M. D., Seidl, W., Hoffman, T., Janson, R., Hansson, H. C., Viisanen, Y., Laaksonen, A., and O’Dowd, C. D.: Overview of the international project on biogenic aerosol formation in the boreal forest (BIOFOR), Tellus B, 53, 324–343, 2001.
15
Kulmala, M., Suni, T., Lehtinen, K. E. J., Dal Maso, M., Boy, M., Reissell, A., Rannik, ¨U., Aalto, P., Keronen, P., Hakola, H., B ¨ack, J., Hoffmann, T., Vesala, T., and Hari, P.: A new feedback mechanism linking forests, aerosols, and climate, Atmos. Chem. Phys., 4, 557– 562, doi:10.5194/acp-4-557-2004, 2004.
Kurt ´en, T., Kulmala, M., Dal Maso, M., Suni, T., Reissell, A., Vehkam ¨aki, H., Hari, P.,
Laakso-20
nen, A., Viisanen, Y., and Vesala, T.: Estimation of different forest-related contributions to the radiative balance using observations in southern Finland, Boreal Env. Res., 8, 275–285, 2003.
Laaksonen, A., Kulmala, M., O’Dowd, C. D., Joutsensaari, J., Vaattovaara, P., Mikkonen, S., Lehtinen, K. E. J., Sogacheva, L., Dal Maso, M., Aalto, P., Pet ¨aj ¨a, T., Sogachev, A., Yoon, Y.
25
J., Lihavainen, H., Nilsson, D., Facchini, M. C., Cavalli, F., Fuzzi, S., Hoffmann, T., Arnold, F., Hanke, M., Sellegri, K., Umann, B., Junkermann, W., Coe, H., Allan, J. D., Alfarra, M. R., Worsnop, D. R., Riekkola, M.-L., Hy ¨otyl ¨ainen, T., and Viisanen, Y.: The role of VOC oxidation products in continental new particle formation, Atmos. Chem. Phys., 8, 2657–2665, doi:10.5194/acp-8-2657-2008, 2008.
30
Lappalainen, H. K., Sevanto, S., B ¨ack, J., Ruuskanen, T. M., Kolari, P., Taipale, R., Rinne, J., Kulmala, M., and Hari, P.: Day-time concentrations of biogenic volatile organic compounds in a boreal forest canopy and their relation to environmental and biological factors, Atmos.
ACPD
11, 9999–10029, 2011Cloud droplet concentration over
the boreal forest
R. H. H. Janssen et al.
Title Page
Abstract Introduction
Conclusions References
Tables Figures
◭ ◮
◭ ◮
Back Close
Full Screen / Esc
Printer-friendly Version Interactive Discussion
Discussion
P
a
per
|
Dis
cussion
P
a
per
|
Discussion
P
a
per
|
Discussio
n
P
a
per
|
Chem. Phys., 9, 5447–5459, doi:10.5194/acp-9-5447-2009, 2009.
Lihavainen, H., Kerminen, V. M., Komppula, M., Hatakka, J., Aaltonen, V., Kulmala, M., and Viisanen, Y.: Production of ’potential’ cloud condensation nuclei associated with atmospheric new-particle formation in northern Finland, J. Geophys. Res., 108, 4782, doi:10.1029/2003JD003887, 2003.
5
Lihavainen, H., Kerminen, V.-M., Komppula, M., Hyv ¨arinen, A.-P., Laakia, J., Saarikoski, S., Makkonen, U., Kivek ¨as, N., Hillamo, R., Kulmala, M., and Viisanen, Y.: Measurements of the relation between aerosol properties and microphysics and chemistry of low level liquid water clouds in Northern Finland, Atmos. Chem. Phys., 8, 6925–6938, doi:10.5194/acp-8-6925-2008, 2008.
10
Lihavainen, H., Kerminen, V.-M., and Remer, L. A.: Aerosol-cloud interaction determined by both in situ and satellite data over a northern high-latitude site, Atmos. Chem. Phys., 10, 10987–10995, doi:10.5194/acp-10-10987-2010, 2010.
Lohmann, U. and Feichter, J.: Global indirect aerosol effects: a review, Atmos. Chem. Phys., 5, 715–737, doi:10.5194/acp-5-715-2005, 2005.
15
McFiggans, G., Artaxo, P., Baltensperger, U., Coe, H., Facchini, M. C., Feingold, G., Fuzzi, S., Gysel, M., Laaksonen, A., Lohmann, U., Mentel, T. F., Murphy, D. M., O’Dowd, C. D., Snider, J. R., and Weingartner, E.: The effect of physical and chemical aerosol properties on warm cloud droplet activation, Atmos. Chem. Phys., 6, 2593–2649, doi:10.5194/acp-6-2593-2006, 2006.
20
Nakajima, T., Higurashi, A., Kawamoto, K., and Penner, J. E.: A possible correlation be-tween satellite-derived cloud and aerosol microphysical parameters, Geophys. Res. Lett., 28, 1171–1174, 2001.
O’Dowd, C. D., Aalto, P., Hmeri, K., Kulmala, M., and Hoffmann, T.: Aerosol formation: Atmo-spheric particles from organic vapours, Nature, 416, 497–498, 2002.
25
O’Dowd, C. D., Yoon, Y. J., Junkermann, W., Aalto, P., Kulmala, M., Lihavainen, H., and Vi-isanen, Y.: Airborne measurements of nucleation mode particles II: boreal forest nucleation events, Atmos. Chem. Phys., 9, 937–944, doi:10.5194/acp-9-937-2009, 2009.
Platnick, S. and Twomey, S.: Determining the susceptibility of cloud albedo to changes in droplet concentration with the Advanced Very High Resolution Radiometer, J. Appl.
Meteo-30
rol., 33, 334–347, 1994.
ACPD
11, 9999–10029, 2011Cloud droplet concentration over
the boreal forest
R. H. H. Janssen et al.
Title Page
Abstract Introduction
Conclusions References
Tables Figures
◭ ◮
◭ ◮
Back Close
Full Screen / Esc
Printer-friendly Version Interactive Discussion
Discussion
P
a
per
|
Dis
cussion
P
a
per
|
Discussion
P
a
per
|
Discussio
n
P
a
per
|
Remote., 41, 459–473, 2003.
Reutter, P., Su, H., Trentmann, J., Simmel, M., Rose, D., Gunthe, S. S., Wernli, H., Andreae, M. O., and P ¨oschl, U.: Aerosol- and updraft-limited regimes of cloud droplet formation: influence of particle number, size and hygroscopicity on the activation of cloud condensation nuclei (CCN), Atmos. Chem. Phys., 9, 7067–7080, doi:10.5194/acp-9-7067-2009, 2009.
5
Roebeling, R. A., Placidi, S., Donovan, D. P., Russchenberg, H. W. J., and Feijt, A. J.: Validation of liquid cloud property retrievals from SEVIRI using ground-based observations, Geophys. Res. Lett., 35, L05814, doi:10.1029/2007GL032115, 2008.
Sihto, S.-L., Mikkil ¨a, J., Vanhanen, J., Ehn, M., Liao, L., Lehtipalo, K., Aalto, P. P., Duplissy, J., Pet ¨aj ¨a, T., Kerminen, V.-M., Boy, M., and Kulmala, M.: Seasonal variation of CCN
concen-10
trations and aerosol activation properties in boreal forest, Atmos. Chem. Phys. Discuss., 10, 28231–28272, doi:10.5194/acpd-10-28231-2010, 2010.
Sogacheva, L., Saukkonen, L., Nilsson, E. D., Maso, M. D., Schultz, D. M., Leeuw, G. D., and Kulmala, M.: New aerosol particle formation in different synoptic situations at Hyyti ¨al ¨a, Southern Finland, Tellus B, 60, 485–494, 2008.
15
Spracklen, D. V., Bonn, B., and Carslaw, K. S.: Boreal forests, aerosols and the impacts on clouds and climate, Phil. Trans. R. Soc. A, 366, 4613–4626, 2008.
Szczodrak, M., Austin, P. H., and Krummel, P. B.: Variability of optical depth and effective radius in marine stratocumulus clouds, J. Atmos. Sci., 58, 2912–2926, 2001.
Tunved, P., Hansson, H. C., Kerminen, V. M., Strom, J., Maso, M. D., Lihavainen, H., Viisanen,
20
Y., Aalto, P. P., Komppula, M., and Kulmala, M.: High natural aerosol loading over boreal forests, Science, 312, 261–263, 2006.
Tunved, P., Str ¨om, J., Kulmala, M., Kerminen, V. M., Maso, M. D., Svenningson, B., Lunder, C., and Hansson, H. C.: The natural aerosol over Northern Europe and its relation to an-thropogenic emissions: implications of important climate feedbacks, Tellus B, 60, 473–484,
25
2008.
Twomey, S.: The influence of pollution on the shortwave albedo of clouds, J. Atmos. Sci., 34, 1149–1152, 1977.
V ´arnai, T. and Marshak, A.: View angle dependence of cloud optical thicknesses retrieved by Moderate Resolution Imaging Spectroradiometer (MODIS), J. Geophys. Res., 112, D06203,
30
doi:10.1029/2005JD006912, 2007.
ACPD
11, 9999–10029, 2011Cloud droplet concentration over
the boreal forest
R. H. H. Janssen et al.
Title Page
Abstract Introduction
Conclusions References
Tables Figures
◭ ◮
◭ ◮
Back Close
Full Screen / Esc
Printer-friendly Version Interactive Discussion
Discussion
P
a
per
|
Dis
cussion
P
a
per
|
Discussion
P
a
per
|
Discussio
n
P
a
per
|
F r (−)
Aa
d
(g g
−
1m
−
1)
0.4 0.5 0.6 0.7 0.8 0.9
1.1 1.2 1.3 1.4 1.5 1.6 1.7 1.8 1.9
2x 10
−8
5 10 15 20 25 30
F r (−)
Aa
d
(g g
−
1m
−
1)
0.4 0.5 0.6 0.7 0.8 0.9
1.1 1.2 1.3 1.4 1.5 1.6 1.7 1.8 1.9 2 x 10⁻⁸
5 10 15 20 25 30
Relative uncertainty in N
CD−retrieval (%) Relative uncertainty in h−retrieval (%)
(a) (b)
Fig. 1. Sensitivity analysis of the cloud model to subadiabatic fraction Fr and the adiabatic
lapse ratio of liquid water content mixing ratioAad, which are the two major contributors to the total uncertainty in the retrievals ofNCD and h. The uncertainty is given in percent relative
to the retrievals for the best guess of the respective parameters for(a) NCD and(b) h. The
ACPD
11, 9999–10029, 2011Cloud droplet concentration over
the boreal forest
R. H. H. Janssen et al.
Title Page
Abstract Introduction
Conclusions References
Tables Figures
◭ ◮
◭ ◮
Back Close
Full Screen / Esc
Printer-friendly Version Interactive Discussion
Discussion
P
a
per
|
Dis
cussion
P
a
per
|
Discussion
P
a
per
|
Discussio
n
P
a
per
|
Apr May Jun Jul Aug Sep
8 10 12 14 16
r eff
(
µ
m)
Apr May Jun Jul Aug Sep
7 8 9 10
τ
(−)
(a)
(b)
Fig. 2. Seasonal cycle in (a) MODIS effective radiusreff and (b) cloud optical thickness τ
over Hyyti ¨al ¨a for the years 2000 to 2008. Each datapoint corresponds to one of 24 bins, each representing the median value of the variable over all years.