ACPD
12, 8225–8267, 2012The effects of mineral dust on
clouds and precipitation
A. Teller et al.
Title Page
Abstract Introduction
Conclusions References
Tables Figures
◭ ◮
◭ ◮
Back Close
Full Screen / Esc
Printer-friendly Version
Interactive Discussion
Discussion
P
a
per
|
Dis
cussion
P
a
per
|
Discussion
P
a
per
|
Discussio
n
P
a
per
Atmos. Chem. Phys. Discuss., 12, 8225–8267, 2012 www.atmos-chem-phys-discuss.net/12/8225/2012/ doi:10.5194/acpd-12-8225-2012
© Author(s) 2012. CC Attribution 3.0 License.
Atmospheric Chemistry and Physics Discussions
This discussion paper is/has been under review for the journal Atmospheric Chemistry and Physics (ACP). Please refer to the corresponding final paper in ACP if available.
The e
ff
ects of mineral dust particles,
aerosol regeneration and ice nucleation
parameterizations on clouds and
precipitation
A. Teller1,*, L. Xue2, and Z. Levin1,3 1
Energy, Environment and Water Research Center, The Cyprus Institute, Nicosia, Cyprus
2
National Center for Atmospheric Research, Boulder, CO, USA
3
Department of Geophysics and Planetary Science, Tel Aviv University, Tel Aviv, Israel
*
now at: RAFAEL, Haifa, Israel
Received: 7 February 2012 – Accepted: 13 March 2012 – Published: 27 March 2012
Correspondence to: A. Teller ([email protected])
ACPD
12, 8225–8267, 2012The effects of mineral dust on
clouds and precipitation
A. Teller et al.
Title Page
Abstract Introduction
Conclusions References
Tables Figures
◭ ◮
◭ ◮
Back Close
Full Screen / Esc
Printer-friendly Version
Interactive Discussion
Discussion
P
a
per
|
Dis
cussion
P
a
per
|
Discussion
P
a
per
|
Discussio
n
P
a
per
|
Abstract
This study focuses on the effects of aerosol particles on the formation of convective clouds and precipitation in the Eastern Mediterranean sea with a special emphasis on the role of mineral dust particles in these processes. We used a new detailed numerical cloud microphysics scheme that has been implemented in the Weather Research and
5
Forecast (WRF) model in order to study aerosol-cloud interaction in 3-D configuration based on realistic meteorological data. Using a number of case studies we tested the contribution of mineral dust particles and different ice nucleation parameterizations to precipitation development. In this study we also investigated the importance of recy-cled (regenerated) aerosols that had been released to the atmosphere following the
10
evaporation of cloud droplets.
The results showed that increased aerosol concentration due to the presence of min-eral dust enhanced the formation of ice crystals. The dynamic evolution of the cloud system sets the time periods and regions in which heavy or light precipitation occurred in the domain. The precipitation rate, the time and duration of precipitation were
af-15
fected by the aerosol properties only at small area scales (with areas of about 20 km2). Changes of the ice nucleation scheme from ice supersaturation dependent parame-terization to a recent approach of aerosol concentration and temperature dependent parameterization modified the ice crystals concentrations but did not affect the total precipitation in the domain. Aerosol regeneration modified the concentration of cloud
20
droplets at cloud base by dynamic recirculation of the aerosols but also had only a mi-nor effect on precipitation.
The major conclusion from this study is that the effect of mineral dust particles on clouds and total precipitation is limited by the properties of the atmospheric dynamics and the only effect of aerosol on precipitation may come from significant increase in
25
ACPD
12, 8225–8267, 2012The effects of mineral dust on
clouds and precipitation
A. Teller et al.
Title Page
Abstract Introduction
Conclusions References
Tables Figures
◭ ◮
◭ ◮
Back Close
Full Screen / Esc
Printer-friendly Version
Interactive Discussion
Discussion
P
a
per
|
Dis
cussion
P
a
per
|
Discussion
P
a
per
|
Discussio
n
P
a
per
1 Introduction
The effects of aerosols on cloud microphysics and rainfall amounts are among the most uncertain factors in considering the entire role of aerosols in climate change. The vari-ety of aerosol types and characteristics make it very difficult to develop a theory about their interactions with clouds. Levin and Cotton (2009) described the difficulty to
estab-5
lish clear causal relationships between aerosols and precipitation and to determine the sign of the precipitation change due to aerosols in a climatological sense. This difficulty is caused by the complex interactions between environmental and meteorological pa-rameters, radiation, aerosols, cloud microphysics and dynamics. Recently, Stevens and Feingold (2009) suggested that the feedbacks between the aerosol and cloud system,
10
the cloud microphysics and cloud dynamics (macrophysics) act as a buffering system, meaning that looking at the system as a whole, the effect of aerosols is possibly weaker than predicted when taking into account individual processes.
Mineral dust particles are one of the most abundant aerosol types in the atmosphere together with anthropogenic air pollution and smoke from biomass burning (Rosenfeld
15
et al., 2001). The dust particles are unique in their effect on clouds since they can act both as Ice Nuclei (IN) to produce ice crystals (Cantrell and Heymsfield, 2005; Phillips et al., 2008, DeMott et al., 2010) and as Giant Cloud Condensation Nuclei (GCCN) to produce large cloud droplets when coated with soluble material (Levin et al., 1996; van den Heever et al., 2006; Zhang et al., 2007; Twohy et al., 2009).
20
The Eastern Mediterranean is a natural laboratory for studying the interactions be-tween mineral dust particles and clouds due to its proximity to the Sahara desert which is the largest source of mineral dust in the world. Many other regions of the world are affected by Saharan dust e.g. the North Tropical Atlantic Ocean, Caribbean region, Northern South America and Southern North American (Prospero et al., 2002; Reid
25
ACPD
12, 8225–8267, 2012The effects of mineral dust on
clouds and precipitation
A. Teller et al.
Title Page
Abstract Introduction
Conclusions References
Tables Figures
◭ ◮
◭ ◮
Back Close
Full Screen / Esc
Printer-friendly Version
Interactive Discussion
Discussion
P
a
per
|
Dis
cussion
P
a
per
|
Discussion
P
a
per
|
Discussio
n
P
a
per
|
Mediterranean basin where freshwater is scarce and environmental problems are criti-cal due to population growth (Brauch, 2003; Chenoweth et al, 2011), high sensitivity to climate change (Giorgi, 2006) and anthropogenic pollution that is mainly transported from Southern Europe (Lelieveld et al., 2002).
In that context, Rosenfeld et al. (2001) presented satellite and in-situ airborne
ob-5
servations from a heavy dust storm that passed over the Eastern Mediterranean and concluded that the presence of the mineral dust particles in the atmosphere inhibited the precipitation from nearby clouds. Recent study that was carried out in Morocco by Ansmann et al. (2008) found that increased IN due to mineral dust does not nec-essarily produce more ice crystals and that the presence of liquid water is essential
10
for the production of ice particles. They pointed out the importance of temperature (or supersaturation above water and ice) as a key factor that determines the formation of ice crystals by deposition. Other observations made by Hui et al. (2008) in West Africa showed negative correlation between the daily rainfall and the dust loading in the Sahel region. Their results were in agreement with past studies focusing on the Sahel that
15
showed similar correlation between rainfall anomalies and dust occurrence (Mbourou et al., 1997). Min et al. (2009) used integrated data from few remote sensing instru-ments that measured cloud and aerosol properties in a trans-Atlantic dust outbreak of Saharan origin and found that precipitation has been reduced in areas where dust was present.
20
Other sets of cloud modeling studies showed that the ability of the mineral dust aerosols to act as GCCN when they are coated with soluble material (Levin et al., 1996) may increase precipitation in mixed-phase convective clouds (Yin et al., 2002; Levin et al., 2005; Teller and Levin, 2006). It is to note that the probability to find internally mixed aerosol composed of mineral dust and sulfate in the Eastern Mediterranean
25
ACPD
12, 8225–8267, 2012The effects of mineral dust on
clouds and precipitation
A. Teller et al.
Title Page
Abstract Introduction
Conclusions References
Tables Figures
◭ ◮
◭ ◮
Back Close
Full Screen / Esc
Printer-friendly Version
Interactive Discussion
Discussion
P
a
per
|
Dis
cussion
P
a
per
|
Discussion
P
a
per
|
Discussio
n
P
a
per
mineral dust particles are composed almost completely from insoluble materials, they still can act as GCCN with low hygroscopicity.
A new explicit bin microphysics scheme coupled with WRF has been introduced recently by Xue et al. (2010) and later used in Muhlbauer et al. (2010) to study effects of aerosol on orographic clouds in two-dimensional idealized configuration. This scheme
5
is utilized in this research to study the interaction of mineral dust particles with clouds and the effect on precipitation.
A recent and similar efforts to couple a bin microphysics scheme into MM5 and WRF was presented by Lynn et al. (2005, 2007), Khain and Lynn (2009) and Khain et al. (2010) who utilized the spectral microphysics scheme of The Hebrew University
10
of Jerusalem (HUJI-SBM) into MM5 and later in WRF. One feature that makes the Xue et al. (2010) scheme mostly adequate to study mineral dust and cloud interaction is the development and coupling of aerosol recycling mechanism that prevents the diminish-ing of aerosol particles from the domain due to cloud and rain drops evaporation.
In this study we explored the effects of mineral dust particles on clouds that are
15
formed at the edges of a heavy dust loading area by the use of the WRF bin scheme. The case study analyzed is the same one described in detail by Levin et al. (2005) and recently by Solomos et al. (2011). However, comparing to Levin et al. (2005) who used a 2 dimensional idealized simulation to study the interactions of dust and cloud in a single cloud set-up, and to Solomos et al. (2011) who used a bulk scheme that was
20
coupled with the RAMS model, in this research we utilized the WRF bin microphysics scheme in a real mode three dimensional set up.
The use of such simulation set-up enables us to study how much aerosol in gen-eral and mingen-eral dust particles in particular are significant factors in cloud microphysics especially in regions where spatial and temporal properties of aerosols have high
vari-25
ability such as at the edges of a dust storm. Specifically, we addressed the following scientific questions:
ACPD
12, 8225–8267, 2012The effects of mineral dust on
clouds and precipitation
A. Teller et al.
Title Page
Abstract Introduction
Conclusions References
Tables Figures
◭ ◮
◭ ◮
Back Close
Full Screen / Esc
Printer-friendly Version
Interactive Discussion
Discussion
P
a
per
|
Dis
cussion
P
a
per
|
Discussion
P
a
per
|
Discussio
n
P
a
per
|
(b) Does increased aerosol loading (polluted environment) modify cloud microphysi-cal properties and precipitation?
(c) What are the roles of mineral dust particles acting as GCCN and/or IN on the cloud characteristics?
(d) What is the contribution of regenerated aerosol following cloud drops evaporation
5
on the cloud microphysics, precipitation and the aerosol characteristics?
Section 2 presents the cloud model used in the study; Sect. 3 discusses the case study and simulation setup; Sect. 4 presents the results of the sensitivity study and the interpretation of the results and Sect. 5 summarizes the research and provides the major conclusions.
10
2 Description of the model
The WRF model is commonly used for the simulation of meteorological events and re-search in atmospheric sciences. The detailed equations of the dynamical core of WRF were described by Klemp et al. (2007). The model was designed to allow researchers to improve forecast accuracy and to investigate the weather features on a variety of
15
scales, from single clouds to synoptic. The model could be used both for real time fore-cast and for research applications. Current official WRF version enables the user to select among microphysics schemes which are only based on bulk parameterizations. The bin microphysics scheme coupled with WRF was described in detail by Ras-mussen et al. (2002) and Xue et al. (2010, 2012). The current version of this scheme
20
was coupled with version 3.2 of WRF package. The bin scheme uses the multi-moment conservation method developed at Tel Aviv University (Tzivion et al., 1987) to ensure the conservation of mass concentration (mixing ratio) and number concentration over 36 mass bins for the following species: cloud and rain water, cloud ice, snow, and grau-pel particles. The scheme can explicitly solve the evolutions of droplet size and mass
25
ACPD
12, 8225–8267, 2012The effects of mineral dust on
clouds and precipitation
A. Teller et al.
Title Page
Abstract Introduction
Conclusions References
Tables Figures
◭ ◮
◭ ◮
Back Close
Full Screen / Esc
Printer-friendly Version
Interactive Discussion
Discussion
P
a
per
|
Dis
cussion
P
a
per
|
Discussion
P
a
per
|
Discussio
n
P
a
per
In a previous version of the scheme (Rasmussen et al., 2002), cloud droplets were initialized in the first mass bin based on specified equations for CCN cumulative con-centration as a function of supersaturation. In the current version (Xue et al., 2010), the aerosols enter the clouds and nucleate drops based on the supersaturation and critical diameter following the classical K ¨ohler theory (Pruppacher and Klett, 1997). For
5
that purpose, we added forty aerosol size bins to describe the aerosol size distribution for particles in the diameter range 0.012–133 µm. For each grid box and time step the model calculates the critical radius for aerosol activation and initiates the appropriate size water drop (similar to the approach presented by Khain et al., 2000).
Since aerosol particles begin to grow by absorption of water vapor long before they
10
are activated, these wetted particles provide the initial sizes for subsequent conden-sational growth (Yin et al., 2000). The main problem is how to include these wetted particles in the model calculations. In Yin et al. (2000, 2002), Levin et al. (2005), Teller and Levin (2006) and in this study we applied the method of Kogan (1991) that as-sumes that the initial droplet size formed on aerosol particles with radii smaller than
15
0.12 µm is equal to the equilibrium radius at 100 % RH, while for larger aerosol parti-cles the initial wet radii are smaller by a factork(r) than their equilibrium radii at 100 % RH. Once the drops reach their critical size or their size based on Kogan (1991) the drops are placed in the appropriate bin for subsequent growth. An improvement of the scheme to account for different aerosol solubility was presented by Xue et al. (2010).
20
In the current version only the soluble fraction of the aerosol particle is taken into ac-count when considering the Kogan parameterization; therefore large particles with very small soluble fraction are apparently treated as small aerosol with high solubility with regard to their nucleation potential. These aerosols will become larger droplets after nucleation compared to the case of small aerosols with high solubility.
25
ACPD
12, 8225–8267, 2012The effects of mineral dust on
clouds and precipitation
A. Teller et al.
Title Page
Abstract Introduction
Conclusions References
Tables Figures
◭ ◮
◭ ◮
Back Close
Full Screen / Esc
Printer-friendly Version
Interactive Discussion
Discussion
P
a
per
|
Dis
cussion
P
a
per
|
Discussion
P
a
per
|
Discussio
n
P
a
per
|
Once this total number of regenerated aerosol is known, the size distributions of these aerosol particles can be constructed by applying different functions such as gamma and log-normal functions. Wurzler et al. (2000) found that when processed by clouds, the aerosol particles become more hydrophilic. Thus, the solubility of regen-erated aerosol particles can be adjusted in the scheme to account for this effect. Details
5
about the utilization of the regeneration scheme in the current research are provided in Sect. 3.2.
In the model, the drops grow by condensation and then by collision-coalescence processes. As the cloud develops vertically, reaching subfreezing temperatures, ice crystals begin to form by the freezing of cloud drops containing efficient IN, primarily
10
those containing mineral particles. Supercooled drop freezing is parameterized using the Bigg (1953) parameterization that depends on the size of the droplets and on the temperature. Contact nucleation due to collisions of drops and IN is accounted for using the parameterization of Meyers et al. (1992). The current simulations as well as those in Teller and Levin (2006) show that among the ice formation processes, contact
15
nucleation has the lowest rate during all simulation time in mid-latitude mixed phase convective clouds.
Ice particles are also formed through ice multiplication process induced by collisions of large drops and ice particles occurring at temperatures of −3◦C to −8◦C (Hallett
and Mossop, 1974). The ice crystals grow by deposition and aggregation to form snow
20
and by riming to form graupel particles. The large graupel particles and the large ice crystals eventually begin to descend, melting on their way down to form raindrops. Detailed description of the above mentioned processes was presented in Rasmussen et al. (2002).
Earlier versions of the bin scheme assumed that IN activation by deposition
25
ACPD
12, 8225–8267, 2012The effects of mineral dust on
clouds and precipitation
A. Teller et al.
Title Page
Abstract Introduction
Conclusions References
Tables Figures
◭ ◮
◭ ◮
Back Close
Full Screen / Esc
Printer-friendly Version
Interactive Discussion
Discussion
P
a
per
|
Dis
cussion
P
a
per
|
Discussion
P
a
per
|
Discussio
n
P
a
per
present.
NIN,T(l −1)
=a·(273.18−T)b·Naer(>0.5 µm)[c·(273.16−T)+d] (1)
Naer (>0.5 µm) is the number concentration of aerosol particles with diameter larger than 0.5 µm. a=0.0000594,b=3.33, c=0.0264,d =0.0033. T is the temperature in degrees Kelvin.
5
In the new parameterization the presence of large concentration of coarse mode aerosols may increase the total amount of activated IN by more than one order of magnitude for a given temperature and therefore this parameterization is considered more appropriate for cases where mineral dust is present.
3 Case study and simulation setup
10
3.1 Case study description
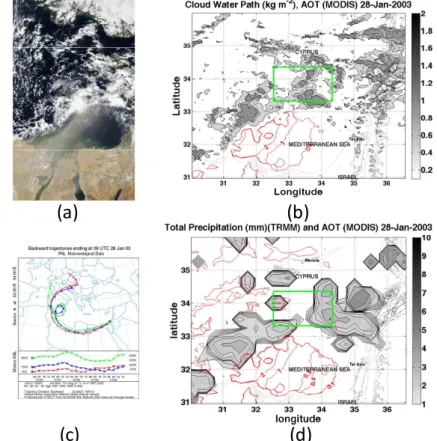
On 27–28 January 2003 a dust storm that originated in North Africa passed over the southeastern corner of the Mediterranean Sea. A MODIS image of the dust storm is shown in Fig. 1a. This dust storm was investigated by at least two studies (Levin et al., 2005; Solomos et al., 2011). The dust storm was unique as its aerosols included
15
large fraction of internally mixed aerosols containing mineral dust and sea salt. Levin et al. (2005) stated that the dust aerosols were detected up to a height of 2000 m above the sea, therefore it has been speculated that those internally mixed aerosols were formed during the transfer of the dust toward the north-east while mixing with sea salt spray that was released from the sea surface.
20
ACPD
12, 8225–8267, 2012The effects of mineral dust on
clouds and precipitation
A. Teller et al.
Title Page
Abstract Introduction
Conclusions References
Tables Figures
◭ ◮
◭ ◮
Back Close
Full Screen / Esc
Printer-friendly Version
Interactive Discussion
Discussion
P
a
per
|
Dis
cussion
P
a
per
|
Discussion
P
a
per
|
Discussio
n
P
a
per
|
well as description and results of airborne measurements that were carried out within the dusty region were presented in Levin et al. (2005).
Figure 1b shows the cloud water path as retrieved by MODIS instrument installed on the Aqua satellite from its overpass on 28 January 2003 at 11:00 UT. In addition, the figure includes the Aerosol Optical Thickness (AOT) retrieval for the same time.
5
The green thick line shows the domain boundaries in which high resolution WRF cloud simulations were carried out and will be discussed in Sect. 4. Figure 1b reveals that intensive convection occurred at the center of the green domain. The HYSPLIT air masses back trajectory analysis shown on Fig. 1c implies that air mass moved from the south west carrying large mass of mineral dust particles and possibly large
con-10
centrations of aged air pollution particles that were originated from South Europe. The presence of dust aerosols was also evident from the aerosol samples that were taken during the airborne measurements as described in Levin et al. (2005).
Figure 1d shows the total accumulated precipitation between 06:00 and 12:00 UT as retrieved from the Tropical Rainfall Measuring Mission (TRMM) satellite with resolution
15
of 0.25◦×0.25◦. Both TRMM and MODIS retrievals show the two cloud convection re-gions which are located north of the dust region and south of Cyprus. The region where accumulated precipitation was the highest is at around the location (34◦N, 34◦E). The domain boundary for the detailed cloud simulations (i.e. the thick green line in Fig. 1b, d) represents, therefore, regions of interaction of strong convection and high dust
load-20
ing.
3.2 Model setup
We used 1-way nesting approach to set up the simulation where three different nested domain resolutions were used: 9 km, 3 km and 1 km (Fig. 2a). For the course domains (9 and 3 km) we used the simple Lin scheme (Lin et al., 1983) to produce the cloud
25
ACPD
12, 8225–8267, 2012The effects of mineral dust on
clouds and precipitation
A. Teller et al.
Title Page
Abstract Introduction
Conclusions References
Tables Figures
◭ ◮
◭ ◮
Back Close
Full Screen / Esc
Printer-friendly Version
Interactive Discussion
Discussion
P
a
per
|
Dis
cussion
P
a
per
|
Discussion
P
a
per
|
Discussio
n
P
a
per
domains and 202×142×40 grid boxes for the inner domain. The domain size was set
mainly based on our maximum computer power and capability.
Neither of the bulk schemes currently implemented in WRF calculates the spatial and temporal evolution of the aerosol characteristics (i.e. concentration, size distributions and chemical composition). The bin microphysics scheme uses the aerosol data to
cal-5
culate the activation, cloud droplet and ice crystal formation, therefore there was a need to track the aerosols within the inner domain. In the current study we do not have any data to estimate the aerosol properties as function of location, height and time. There-fore, we set fixed values for the aerosol size distribution at the inner domain boundaries in order to prevent depletion of aerosols from the domain. The initial aerosol size
distri-10
bution was taken from the airborne measurements of Levin et al. (2005) (Fig. 2c) with a fixed aerosol concentration from the ground up to 1000 m a.s.l. (above sea level) and an exponential decay of the aerosol concentration with a scale height of 4000 m (at 4000 m a.s.l. the aerosol concentration is 1/eof the concentration at the sea surface). The average thermodynamic profile in the inner domain at the beginning of the
simu-15
lation (06:00 UT) is shown in Fig. 2b. This profile is retrieved by downscaling data from the simulations of the external domains that started at 00:00 UT. The initial thermo-dynamic conditions for the external domains were taken from NCEP FNL Operational Global Analysis data with a resolution of 1◦×1◦. The average thermodynamic profile reflects unstable conditions with high values of water vapor mixing ratio and promises
20
convective activity at certain locations throughout the simulation. The profile shows in-version layer at around 8000 m a.s.l. (temperature of −50◦C). At lower altitude very high values of relative humidity are present, meaning that convective clouds were likely to be developed during the simulation time.
In the model aerosols could be depleted from the domain only through sedimentation
25
ACPD
12, 8225–8267, 2012The effects of mineral dust on
clouds and precipitation
A. Teller et al.
Title Page
Abstract Introduction
Conclusions References
Tables Figures
◭ ◮
◭ ◮
Back Close
Full Screen / Esc
Printer-friendly Version
Interactive Discussion
Discussion
P
a
per
|
Dis
cussion
P
a
per
|
Discussion
P
a
per
|
Discussio
n
P
a
per
|
The calculations of the critical radius for aerosol activation assumed that CCN were composed of internally mixed aerosols composed of ammonium sulfate and mineral dust with size dependent solubility as shown in Eq. (2), adopted from a theoretical curve that was used by Xue et al. (2010).
Sol(r)=
1 r ≤5×10⁻⁸
1.13·e−2.5×10
6
·r
5×10⁻⁸< r ≤1×10⁻⁶ 5×10⁻¹⁰·r−1.382 1×10⁻⁶< r ≤5×10⁻⁶ 0.01 r >5×10⁻⁶
(2)
5
Here r is the aerosol radius in m. This formula depicts a monotonic decrease of sol-ubility with the increasing aerosol size as expected when the aerosol population is composed of insoluble mineral dust particles mixed with soluble accumulation mode aerosols such as ammonium sulfate or sea salt.
For the small solubility (0.01) assigned to large particles with radius>5 µm, it should
10
be noted that Koehler et al. (2007) showed that the mineral dust particles have a variety of hygroscopicity properties and even aerosols with sizes larger than 0.3 µm, having very small hygroscopicity values, could serve as CCN. Similar conclusions were found by Twohy et al. (2009) who showed that Sahara mineral dust particles could serve as GCCN even though they had very small hygroscopicity values.
15
The total number of evaporated drops in a grid box is calculated as the difference between two integrals of number distributions before and after evaporation. Therefore we cannot assume a direct relation between the regenerated aerosol size and the size of the evaporated drops. The regenerated aerosols were set with fixed two mode log-normal distributions with mean radius of 0.2 and 0.5 µm and standard deviations 0.16
20
and 0.3. These values represent a small increase in the size of the aerosols compared to the initial profile (Fig. 2c). It is assumed that the number concentration of coarse mode aerosols after regeneration at a certain time step and grid box is related to the history of the cloud droplets before its evaporation i.e. new formed droplets will release an aerosol with the same size as the original while aged droplets that were subjected
ACPD
12, 8225–8267, 2012The effects of mineral dust on
clouds and precipitation
A. Teller et al.
Title Page
Abstract Introduction
Conclusions References
Tables Figures
◭ ◮
◭ ◮
Back Close
Full Screen / Esc
Printer-friendly Version
Interactive Discussion
Discussion
P
a
per
|
Dis
cussion
P
a
per
|
Discussion
P
a
per
|
Discussio
n
P
a
per
to collision and coalescence processes will release larger aerosols. Therefore we as-sumed that the number concentration of the coarse mode regenerated aerosols in a grid box at a certain time step was 5 % of the change in the number concentration of drops due to collision and coalescence process in the same grid box at the same time step. This method guarantees the release of large aerosols to the atmosphere
5
in mature clouds where cloud chemistry processes increase the aerosol mixing ratio within droplets.
Table 1 presents the 10 cases that were simulated using the bin microphysics scheme. We assign each case study with a name that represents the initial condi-tions used. Aerosol concentration are assigned as “Clean” – C (300 cm−3), “Polluted” –
10
P (2000 cm−3) and “Base Case” – BC (950 cm−3). “G” and “NG” represent case where GCCN were added or removed, respectively. “M” and “D” represent simulation runs where Meyers et al. (1992) or DeMott et al. (2010) parameterizations were used, re-spectively, and “reg” represent cases in which aerosol regeneration was used. The “Base Case” (BC G M reg) represents the measurements that were carried out on 28
15
January 2003 by the King-Air aircraft (Levin et al., 2005). It is assumed that GCCN are present in the ambient atmosphere and regeneration of aerosols following drops evaporation is active. For the base case, the Meyers et al. (1992) parameterization for ice nucleation through deposition and condensation freezing was used. The role of aerosol regeneration following drops evaporation and the IN activation schemes of
20
ACPD
12, 8225–8267, 2012The effects of mineral dust on
clouds and precipitation
A. Teller et al.
Title Page
Abstract Introduction
Conclusions References
Tables Figures
◭ ◮
◭ ◮
Back Close
Full Screen / Esc
Printer-friendly Version
Interactive Discussion
Discussion
P
a
per
|
Dis
cussion
P
a
per
|
Discussion
P
a
per
|
Discussio
n
P
a
per
|
4 Results and discussion
4.1 Overview
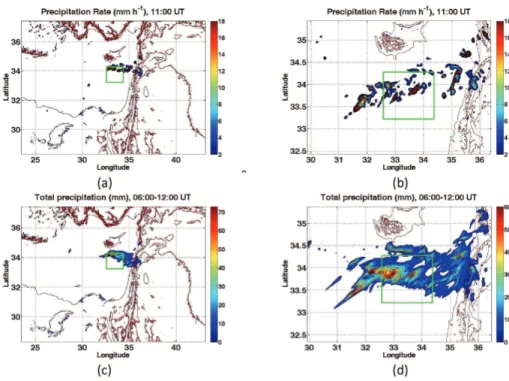
Figure 3 shows the spatial distribution of precipitation rate at 11:00 UT and the total precipitation between 06:00 and 12:00 UT as calculated for the external domains (9 and 3 km). The spatial distribution of precipitation rate resembled the remote sensing
5
retrievals of MODIS and TRMM observations (Fig. 1) at the northern regions of the inner domain which is marked by the thick green line on Fig. 3a. The WRF simulations did not identify the clouds and the precipitation that were formed at the south regions of the inner domain probably due to the coarse resolution used for the initialization – NCEP FNL reanalysis data with resolution of 1◦. The low resolution of the model
10
initialization data (about 100 km) does not allow an accurate representation of the cloud field. Another possible reason for the model to miss the cloud activity at the edges of the dust storm may result from the significant role of aerosol-cloud interactions that are not represented in the bulk cloud microphysics scheme. It should be noted that both WRF and MODIS detected other regions with intensive cloud and precipitation activity
15
in North Israel (35.5◦E, 33.5◦N). These regions were not affected by the dust storm on 28 January 2003.
A comparison between the spatial distributions of the total precipitation on the ground for the time period 06:00–12:00 UT between a few of the bin microphysics simulations at the inner domain is presented in Fig. 4. For the preparation of Fig. 4 we selected
20
the clean case, the base case (with and without GCCN) and the polluted case with the Meyers et al. (1992) ice nucleation scheme.
The four cases (clean, base case and polluted) show that the spatial distribution of precipitation are very different from the results of the simulation with the bulk scheme. In other words, the inclusion of aerosols in the bin microphysics calculations resulted
25
ACPD
12, 8225–8267, 2012The effects of mineral dust on
clouds and precipitation
A. Teller et al.
Title Page
Abstract Introduction
Conclusions References
Tables Figures
◭ ◮
◭ ◮
Back Close
Full Screen / Esc
Printer-friendly Version
Interactive Discussion
Discussion
P
a
per
|
Dis
cussion
P
a
per
|
Discussion
P
a
per
|
Discussio
n
P
a
per
The simulation results show that precipitation at longitude<32.8◦was not formed when the bin microphysics scheme was applied compared to the bulk scheme simulation. This implies that larger domain should have been used. Unfortunately our computer resources could not allow the increase of the domain for the bin microphysics simula-tions. In order to eliminate the boundary effects, in most of the analyses from now on
5
(beginning from Sect. 4.2) we will focus on limited and smaller regions in the center of the domain, marked by a red line, that are favorable when considering a focused study on aerosol-cloud and precipitation interactions. It is evident from Fig. 4c that on a local scale of about 25 km2(area of 5 km×5 km) the different initializations modified the spatial distribution of precipitation even for cases in which the total precipitation in
10
the domain is almost identical such as in the GCCN and no GCCN cases (see Fig. 5 below). Comparisons between other pairs of simulation runs showed similar findings.
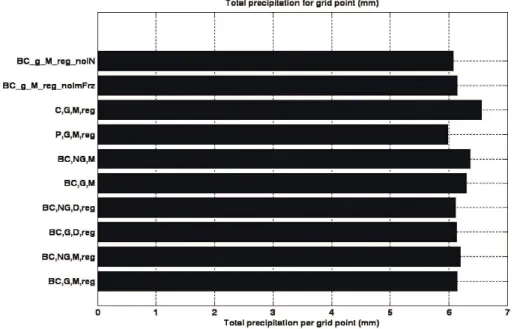
Figure 5 shows the total ground precipitation amount per grid box during the en-tire simulation time (06:00–12:00 UT). The simulation with the lowest aerosol loading (C G M reg) produced the highest amount of precipitation per grind box while the
sim-15
ulation with the highest aerosol loading produced the lowest amount of precipitation. The difference between the maximum and minimum precipitation per grid box is only 10 % from the average value of this metric. This means that for this particular case study aerosols could modify precipitation amount per grid box only by maximum of 10 %.
20
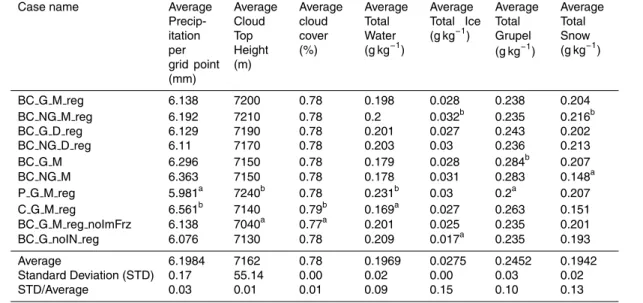
To have a more detailed evaluation of the sensitivities of the simulations to different aerosol and cloud microphysical processes we constructed Table 2 that shows the domain averages of different properties calculated for the case studies. In Table 2 the sensitivity for each property (last row) is the ratio of the standard deviation and the average of the property. This metric can be regarded as the normalized variability. The
25
ACPD
12, 8225–8267, 2012The effects of mineral dust on
clouds and precipitation
A. Teller et al.
Title Page
Abstract Introduction
Conclusions References
Tables Figures
◭ ◮
◭ ◮
Back Close
Full Screen / Esc
Printer-friendly Version
Interactive Discussion
Discussion
P
a
per
|
Dis
cussion
P
a
per
|
Discussion
P
a
per
|
Discussio
n
P
a
per
|
not affected by the changes in the aerosol properties compared to the cloud particles’ mixing ratios.
While Table 2 provides a coarse data about the sensitivity of the microphysical prop-erties to the different initializations, it already reveals some of the main microphysical properties of the cloud particles that will be discussed further in the next sections:
5
1. The average Liquid Water Content (LWC) is the highest for the polluted case (0.231 g m−3) and the lowest for the clean case (0.169 g m−3). These results are in agreement with previous studies that showed that in polluted clouds the LWC was high for clouds that were formed in heavy polluted conditions due to the lower precipitation amount that caused more water to stay aloft (e.g., Teller and
10
Levin, 2006). Since the cloud top height is similar for all the cases it can also be concluded that for this study the Liquid Water Path (LWP) has been increased in polluted environment.
2. The ice mixing ratios are higher for the polluted cases compared to the clean ones. The lowest ice crystals mixing ratio was found in the case where the ice
15
nucleation process was turned off(BC G noIN reg). The differences in the aver-age ice mixing ratios between the Meyers et al. (1992) and DeMott et al. (2010) parameterizations are very small as could be revealed from the ice mixing ratios in the cases BC G noIN reg and BC G M reg noImFrz.
3. Graupel mixing ratios were high for the clean case and were the highest for the
20
cases in which aerosol regeneration was not applied. In previous studies (Yin et al., 2002; Teller and Levin, 2006; Xue et al., 2012), high mixing ratio of graupel particles was found to be correlated with low ambient aerosol concentration and larger sizes of droplets. The high mixing ratio of graupel in the cases with no regeneration of aerosols is due to the lower aerosol concentration in these cases
25
as will be discussed and shown further in Sect. 4.4.
ACPD
12, 8225–8267, 2012The effects of mineral dust on
clouds and precipitation
A. Teller et al.
Title Page
Abstract Introduction
Conclusions References
Tables Figures
◭ ◮
◭ ◮
Back Close
Full Screen / Esc
Printer-friendly Version
Interactive Discussion
Discussion
P
a
per
|
Dis
cussion
P
a
per
|
Discussion
P
a
per
|
Discussio
n
P
a
per
(C G M reg) snow mixing ratio is low but the lowest value is calculated in the case BC NG M which is characterized by low aerosol concentration because the regeneration was turned off.
These results, while reflecting only a specific case study, support the concept that the cloud microphysics was sensitive to the aerosol properties, however this sensitivity
5
is buffered by the stronger dynamical processes through feedbacks so the effects on precipitation amount are minor (Stevens and Feingold, 2009)
From the above analysis it can be concluded that the impact of mineral dust particles serving as GCCN or as IN on the cloud microphysics was less significant than the effect of the aerosol loading (clean vs. polluted cases). This conclusion is in agreement with
10
results from other studies that utilized the bin-microphysics scheme for a single cloud in a 2-D configuration (i.e. Teller and Levin, 2006) and for a mixed phase orographic cloud (Xue et al., 2012).
4.2 Sensitivity of cloud microphysics and dynamics to aerosol properties
In Fig. 4 we marked with a red thick line a region in which the total ground precipitation
15
is larger compared to the surrounding area. This “hot spot” area is located close to the center of the domain in order to subject it to only minor impacts of the domain boundaries.
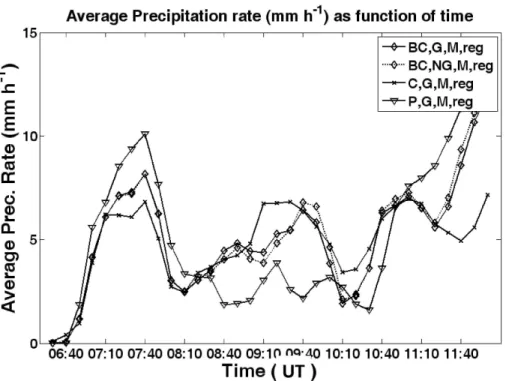
We further explore this region by introducing Fig. 6 that shows the average precipita-tion rate as a funcprecipita-tion of time for grid boxes that are located within the red rectangle. In
20
this section we focus on four simulations that represent well the sensitivity of the cloud and precipitation properties to aerosol loading through the modification of aerosol total number concentration and to the presence of mineral dust through the insertion and removal of GCCN. The cases are BC,G,M,reg (base case), BC,NG,M,reg (to investi-gate effect of the mineral dust serving as giant CCN), C,G,M,reg and P,G,M,reg (to
25
ACPD
12, 8225–8267, 2012The effects of mineral dust on
clouds and precipitation
A. Teller et al.
Title Page
Abstract Introduction
Conclusions References
Tables Figures
◭ ◮
◭ ◮
Back Close
Full Screen / Esc
Printer-friendly Version
Interactive Discussion
Discussion
P
a
per
|
Dis
cussion
P
a
per
|
Discussion
P
a
per
|
Discussio
n
P
a
per
|
Figure 6 shows that the periods of time in which precipitation rate were high are different for the different analyzed cases. More specifically the times 07:40 UT and 09:10 UT are of great interest since the average precipitation rate from the clean and the polluted cases have different values and trends. In the clean case, precipitation rate was low at 07:40 UT while it was the high at 09:10 UT. The opposite happened in the
5
polluted case that produced high precipitation rate at 07:40 UT and low precipitation rate at 09:10 UT. The presence of GCCN had minor effect on the time variation of precipitation rate at all times during the simulations.
Figure 7 shows the time evolution of the average cloud particle contents for the area which is surrounded by the red rectangle. In Fig. 7 the periods in which precipitation
10
rate is high for the different cases are clearly identified by the darker contours of the drops mixing ratios close to the ground (see for example at 07:40 UT and 09:10 UT and after 11:00 UT). Figure 7 adds valuable information to the data of Table 2 by showing the height profiles and time variation of the different cloud particles’ mixing ratios. The following differences were identified between the case studies:
15
1. The average graupel mixing ratio in the clean case (Fig. 7c) was the highest among the cases as depicted by looking at the area that covers the contour of 1.4 g m−3. For the polluted case (Fig. 7d) the graupel mixing ratio was the low-est among the cases. High mixing ratios of graupel particles in clean atmosphere simulations compared to polluted atmosphere were also found in Teller and Levin
20
(2006), Yin et al. (2002) and Xue et al. (2012). From the difference between clean and polluted cases in Fig. 7 it can be speculated that riming of ice crystals by large drops are major channels for the formation of graupel particles, because larger drops are formed in the clean case. Furthermore, whenever large supercooled drops are present at low temperatures as in the clean case, graupel particles will
25
ACPD
12, 8225–8267, 2012The effects of mineral dust on
clouds and precipitation
A. Teller et al.
Title Page
Abstract Introduction
Conclusions References
Tables Figures
◭ ◮
◭ ◮
Back Close
Full Screen / Esc
Printer-friendly Version
Interactive Discussion
Discussion
P
a
per
|
Dis
cussion
P
a
per
|
Discussion
P
a
per
|
Discussio
n
P
a
per
lower concentrations of large ice crystals were present. This was caused by the lower concentrations of droplets in the GCCN case where many of droplets be-came raindrops due to collision and coalescence processes.
2. Cloud droplets climbed to higher altitudes in the polluted case compared to all other cases as revealed by the contour of 0.2 g m−3. Before 07:00 UT the liquid
5
water mixing ratios are very low for the clean case compared to the other cases, resulting in less precipitation at later time periods. The reason is that the early initiation of precipitation at 06:40 UT in the clean case (see Fig. 6) depleted some of the water in the clouds, leaving lower LWC at around after 07:00 UT.
3. The snow mixing ratio in the polluted case is the highest among the cases.
Dif-10
ferences between snow mixing ratios are also found when comparing the GCCN and no GCCN cases. In the case without GCCN more snow is formed (see the blue contours for these cases at 09:00 UT). Formation of snow was due to ice crystals aggregation and was more possible in cases where riming efficiency was low in clouds containing low number concentrations of large drops.
15
4. Ice crystals mixing ratios are high only at the top of the cloud. Since all those cases were set with the Meyers et al. (1992) parameterization for ice nucleation, the differences between the ice crystals contents are minor. Most of the ice mass was converted to graupel particles and to snow through riming and aggregation, respectively.
20
4.3 Sensitivity of cloud microphysics and dynamics to aerosol properties
Next, we focus on the sensitivity of the microphysical development of the clouds to two different parameterization of ice nucleation. The parameterizations of Meyers et al. (1992) and DeMott et al. (2010) used different variables for the calculations of the ice nuclei activation – supersaturation above ice in Meyers et al. (1992) and
temper-25
ACPD
12, 8225–8267, 2012The effects of mineral dust on
clouds and precipitation
A. Teller et al.
Title Page
Abstract Introduction
Conclusions References
Tables Figures
◭ ◮
◭ ◮
Back Close
Full Screen / Esc
Printer-friendly Version
Interactive Discussion
Discussion
P
a
per
|
Dis
cussion
P
a
per
|
Discussion
P
a
per
|
Discussio
n
P
a
per
|
in DeMott et al. (2010). The Meyers et al. (1992) has been widely used in numerical models but the more modern scheme of DeMott et al. (2010) is more suitable for study-ing the interaction of clouds and mineral dust as it takes into account the presence of coarse mode aerosols. The first step in such analysis is to compare the different pa-rameterizations and place them on the same scale.
5
Figure 8 shows the number concentration of activated aerosols as a function of tem-perature in the two parameterizations. In this figure the aerosol size distribution was adopted from Fig. 2c and the supersaturation above water was assumed to be 1 %. At high temperatures, the parameterization of Meyers et al. (1992) produced larger con-centration of activated IN while at temperatures lower than−20◦C and in the presence
10
of GCCN, both parameterizations produced similar concentrations. The effect of the aerosol size distribution and the contribution of GCCN to ice nucleation were signifi-cant when applying the DeMott et al. (2010) parameterization as shown in the cases with and without GCCN. It should be noted that in reality the number concentration of GCCN is expected to be lower at higher elevations and lower temperatures because
15
these larger particles could be more easily scavenged by drops or fall by sedimentation at lower elevations. Thus in reality their concentrations at these high elevations would be smaller than is evident in Fig. 8.
Figure 9 shows the domain average production rate (number-s−1-l−1) of ice crystals for the entire simulation time. Special attention in Fig. 9 should be given to the
mean-20
ing of using different dependent variables in the ice nucleation parameterizations. The Meyers et al. (1992) parameterization depends only on the supersaturation above ice, therefore large differences are found between the clean and the polluted cases where supersaturation above ice is high and low, respectively. The DeMott et al. (2010) pa-rameterization depends on the temperature and the aerosol concentration (>0.5 µm),
25
ACPD
12, 8225–8267, 2012The effects of mineral dust on
clouds and precipitation
A. Teller et al.
Title Page
Abstract Introduction
Conclusions References
Tables Figures
◭ ◮
◭ ◮
Back Close
Full Screen / Esc
Printer-friendly Version
Interactive Discussion
Discussion
P
a
per
|
Dis
cussion
P
a
per
|
Discussion
P
a
per
|
Discussio
n
P
a
per
Though the ice crystals production rates are modified, the modified parameterization did not have significant effect on the total precipitation rate (Fig. 5), resulting in similar values to those obtained in the base case BC G M reg.
Figure 10 shows the time evolution of the average cloud particle content as function of the altitude at the area marked by the red rectangle in Fig. 4. The similar profiles
5
of the cloud particles’ mixing ratios are evident; however, some differences could be seen. For example, there is an increase in precipitation in the case without immersion freezing at 08:00 UT followed by small reduction of the ground precipitation from this case at times after 11:00 UT (Fig. 10c).
It is therefore concluded that while modifications in the IN activation
parameteri-10
zations and ice formation processes are detected by the model and at specific time periods they affect the size and mass distributions of the cloud particles, the integrated effect is minor as compared to the effects of total aerosol concentration as shown in Sect. 4.2. More strictly speaking, it can be concluded that ice crystal formation is af-fected by the presence of mineral dust particles but the entire impact may come from
15
other factors such as the dust storm dynamics.
4.4 Sensitivity of cloud microphysics and dynamics to aerosol properties
In this study we investigated the role of aerosol regeneration in a more realistic scenario than the one used by Xue et al. (2010, 2012) and with a 3-D set up. The comparison was made between the two base cases with and without GCCN (BC G M reg and
20
BC NG M reg) and the same two cases with and without aerosol regeneration (BC G M and BC NG M). Figure 11 shows the average aerosol size distribution as a func-tion of altitude during the simulafunc-tion time. When regenerafunc-tion was turned on (Fig. 11a, b), the aerosol size distribution was wider than when the regeneration was off(Fig. 11c, d). This is evident by the differences at the size range 0.8–1 µm when comparing the
25
ACPD
12, 8225–8267, 2012The effects of mineral dust on
clouds and precipitation
A. Teller et al.
Title Page
Abstract Introduction
Conclusions References
Tables Figures
◭ ◮
◭ ◮
Back Close
Full Screen / Esc
Printer-friendly Version
Interactive Discussion
Discussion
P
a
per
|
Dis
cussion
P
a
per
|
Discussion
P
a
per
|
Discussio
n
P
a
per
|
These results demonstrate that the aerosol regeneration process maintains the pres-ence of the coarse mode aerosols in the simulation domain even for the cases in which GCCN were not added initially (Fig. 11b) following the assumption that the released aerosols are larger than those initially activated. As a result of the cleaner environment in the cases where regeneration was not active, one can see that the cases BC G M
5
and BC NG M produced slightly more precipitation per grid box than the cases BC G M reg and BC NG M reg (Fig. 5).
The average aerosol concentration in non-cloudy regions (with total condensate of less than 0.001 g m−3) as function of the altitude during the simulation time is shown in Fig. 12. Figure 12 reveals that the regeneration process released significant amount of
10
aerosols back to the atmosphere at altitudes of less than 2000 m a.s.l., while ignoring this process caused aerosol concentration to be lower. For the cases in which regen-eration was turned off, more aerosols were present when GCCN had been added to the initial aerosol spectrum. This result is expected as the initial aerosol concentration is slightly higher for the GCCN cases.
15
In contrast, when regeneration was turned on, the ambient aerosol concentration was lower when GCCN were present at low altitudes. This result is attributed to the for-mation of larger drops by the GCCN, which subsequently grow by collection of smaller drops, leading to the release of only one aerosol per drop while evaporating. More aerosols were released in the case without GCCN as the collection efficiency of small
20
droplets was lower, leaving more small droplets to evaporate.
Figure 13 shows the difference between the aerosols concentration as function of time and height between the cases where regeneration was turned on and offfor the GCCN (Fig. 13a) and no GCCN (Fig. 13b) cases. Figure 13 demonstrates once more the significant fractional contribution of regenerated aerosols to the total aerosol
con-25
ACPD
12, 8225–8267, 2012The effects of mineral dust on
clouds and precipitation
A. Teller et al.
Title Page
Abstract Introduction
Conclusions References
Tables Figures
◭ ◮
◭ ◮
Back Close
Full Screen / Esc
Printer-friendly Version
Interactive Discussion
Discussion
P
a
per
|
Dis
cussion
P
a
per
|
Discussion
P
a
per
|
Discussio
n
P
a
per
From this section it is evident that ignoring the aerosols that are released from evap-orated droplets and their properties may result in large deviations from a realistic rep-resentation of the environmental effects by underestimating the aerosol loading.
5 Summary and conclusions
This paper presents results from a numerical cloud scheme that provides an explicit
5
description of cloud development processes and precipitation formation and their in-teraction with aerosols in a 3-D configuration. Specifically, we carried out numerical simulation to study the impact of mineral dust particles possibly acting as giant Cloud Condensation Nuclei and Ice Nuclei on the cloud microphysical and dynamical pro-cesses. In addition, the paper demonstrates the effect of the aerosol regeneration
pro-10
cess on the ambient aerosol properties due to cloud droplets evaporation.
We found that the impact of mineral dust on the cloud particles’ mixing ratios is more substantial than its impact on the total precipitation. The unique configuration used for running the numerical model (3-D configuration with a realistic meteorological data) enabled us to demonstrate how the concept of a cloud system that buffers the aerosol
15
effects through micro and macrophysical processes is evident in a numerical model. The main conclusions from the research are the following:
1. Mineral dust particles acting as giant CCN (GCCN) modified the size distribution of cloud droplets and the spatial distribution of precipitation but had only relatively small effect on the integrated precipitation. In addition, GCCN modify only slightly
20
the location of the cloud and its dynamics leading, again, to only minor effect on the integrated precipitation on the ground.
2. The inclusion of mineral dust particles acting as IN affected the ice crystals for-mation rate when the new parameterization of DeMott et al. (2010) was utilized in the simulation, however, the effect of mineral dust on total precipitation was minor.
ACPD
12, 8225–8267, 2012The effects of mineral dust on
clouds and precipitation
A. Teller et al.
Title Page
Abstract Introduction
Conclusions References
Tables Figures
◭ ◮
◭ ◮
Back Close
Full Screen / Esc
Printer-friendly Version
Interactive Discussion
Discussion
P
a
per
|
Dis
cussion
P
a
per
|
Discussion
P
a
per
|
Discussio
n
P
a
per
|
The use of Meyers et al. (1992) parameterization led to an increase in the number concentration of ice crystals as compared to DeMott et al. (2010).
3. Aerosol regeneration was found to be an important process that modifies signifi-cantly the aerosol characteristics especially at low altitudes, however, the effects on the integrated precipitation amount was relatively small. The aerosol
regen-5
eration process released significant amount of aerosols back to the atmosphere. Many of these aerosols could nucleate cloud droplets and ice crystals after re-entering the cloud. This process should be taken into account especially when considering the effects of mineral dust on clouds as the cloud chemistry may alter the size and solubility of the dust aerosols and allow them to act as GCCN after
10
a number of cloud cycles (Wurzler et al., 2000).
We end this discussion with the hope that this study will stimulate future field observa-tions for measuring mineral dust and cloud particles in regions where the two strongly interact, like over the Eastern Mediterranean. One of the objectives of such measure-ments and a current challenge in dust-cloud interaction research is to develop a more
15
accurate and representative parameterizations for the ice nuclei activation and their role in cloud microphysics.
Acknowledgements. This research was partially funded by the Autonomous Flying Platform for Atmospheric and Earth Surface Observation (APAESO) project, funded by the Research Promotion Foundation of Cyprus. AT and LX would like to thank the Advanced Study Program 20
division in NCAR for the partial funding of this research.
References
Ansmann, A., Tesche, M., Althausen, D., M ¨uller, D., Seifert, P., Freudenthaler, V., Heese, B., Wiegner, M., Pisani, G., Knippertz, P., and Dubovik, O.: Influence of Saharan dust on cloud glaciation in Southern Morocco during the Saharan Mineral Dust Experiment, J. Geophys. 25
ACPD
12, 8225–8267, 2012The effects of mineral dust on
clouds and precipitation
A. Teller et al.
Title Page
Abstract Introduction
Conclusions References
Tables Figures
◭ ◮
◭ ◮
Back Close
Full Screen / Esc
Printer-friendly Version
Interactive Discussion
Discussion
P
a
per
|
Dis
cussion
P
a
per
|
Discussion
P
a
per
|
Discussio
n
P
a
per
Bigg, E. K.: The formation of atmospheric ice crystals by the freezing of droplets, Q. J. Roy. Meteor. Soc., 79, 510–519, 1953.
Brauch, H. G.: Urbanization and Natural Disasters in the Mediterranean: Population Growth and Climate Change in the 21st Century, Building Safer Cities: The Future of Disaster Risk, World Bank Publications, 324 pp. 2003.
5
Cantrell, W. and Heymsfield, A.: Production of ice in tropospheric clouds, B. Am. Meteorol. Soc., 86, 795–807, 2005.
Chenoweth, J., Hadjinicolaou, P., Bruggeman, A., Lelieveld, J., Levin, Z., Lange, M. A., Xo-plaki, E., and Hadjikakou, M.: Impact of climate change on the water resources of the East-ern Mediterranean and Middle East region: modeled 21st century changes and implications, 10
Water Resour. Res., 47, W06506, doi:10.1029/2010WR010269, 2011.
DeMott, P. J., Prenni, A. J., Liu, X., Kreidenweis, S. M., Petters, M. D., Twohy, C. H, Richard-son, M. S., Eidhammer, T., and Rogers, D. C.: Predicting global atmospheric ice nuclei distributions and their impacts on climate, P. Natl. Acad. Sci. USA, 107, 11217–11222, doi:10.1073/pnas.0910818107, 2010.
15
Giorgi, F.: Climate change hot-spots, Geophys. Res. Lett., 33, L08707, doi:10.1029/2006GL025734, 2006.
Hallett, J. and Mossop, S. C.: Production of secondary ice crystals during the riming process, Nature, 249, 26–28, 1974.
van den Heever, S. C., Carrio, G., Cotton, W. R., DeMott, P. J., and Prenni, A. J.: Impacts of 20
nucleating aerosol on Florida convection. Part I: Mesoscale simulations. J. Atmos. Sci., 63, 1752−1775, 2006.
Hui, W. J., Cook, B. I., Ravi, S., Fuentes, J. D., and D’Odorico, P.: Dust-rainfall feedbacks in the West African Sahel, Water Resour. Res., 44, W05202, doi:10.1029/2008WR006885, 2008. Khain, A., Ovtchinnikov, M., Pinsky, M., Pokrovsky, A., and Krugliak, H.: Notes on the state-of-25
the-art numerical modeling of cloud microphysics, Atmos. Res., 55, 159–224, 2000.
Khain, A. and Lynn, B.: Simulation of a supercell storm in clean and dirty atmosphere using weather research and forecast model with spectral bin microphysics, J. Geophys. Res., 114, D19209, doi:10.1029/2009JD011827, 2009.
Khain, A., Lynn, B., Dudhia, J.: Aerosol effects on intensity of landfalling hurricanes as seen 30
ACPD
12, 8225–8267, 2012The effects of mineral dust on
clouds and precipitation
A. Teller et al.
Title Page
Abstract Introduction
Conclusions References
Tables Figures
◭ ◮
◭ ◮
Back Close
Full Screen / Esc
Printer-friendly Version
Interactive Discussion
Discussion
P
a
per
|
Dis
cussion
P
a
per
|
Discussion
P
a
per
|
Discussio
n
P
a
per
|
Kogan, Y. L.: The simulation of a convective cloud in a 3-D model with explicit microphysics: Part I. Model description and sensitivity experiments, J. Atmos. Sci., 48, 1160–1189, 1991. Koehler K. A., Kreidenweis, S. M., DeMott, P. J., Prenni, A. J., and Petters, M. D.: Potential
impact of Owens (dry) Lake dust on warm and cold cloud formation, J. Geophys. Res. 112, D12210, doi:10.1029/2007JD008413, 2007.
5
Klemp, J. B., Skamarock, W. C., and Dudhia, J.: Conservative splitexplicit time integration meth-ods for the compressible nonhydrostatic equations, Mon. Weather Rev., 135, 2897–2913, 2007.
Lelieveld, J., Berresheim, H., Borrmann, S., Crutzen, P. J., Dentener, F. J., Fischer, H., Fe-ichter, J., Flatau, P. J., Heland, J., Holzinger, R., Korrmann, R., Lawrence, M. G., Levin, Z., 10
Markowicz, K. M., Mihalopoulos, N., Minikin, A., Ramanathan, V., de Reus, M., Roelofs, G. J., Scheeren, H. A., Sciare, J., Schlager, H., Schultz, M., Siegmund, P., Steil, B., Stephanou, E. G., Stier, P., Traub, M., Warneke, C., Williams, J., and Ziereis, H.: Global Air Pollution Crossroads over the Mediterranean, Science, 298, 794–799, 2002.
Levin, Z. and Cotton, W.: Aerosol Pollution Impact on Precipitation: A Scientific Review. 15
Springer, The Netherlands, ISBN:140208689X, 9781402086892, 386 pp., 2009.
Levin, Z., Ganor, E., and Gladstein, V.: The effects of desert particles coated with sulfate on rain formation in the Eastern Mediterranean, J. Appl. Meteorol., 35, 1511–1523, 1996. Levin, Z., Teller, A., Ganor, E., and Yin, Y.: On the interactions of mineral dust, sea salt particles
and clouds – measurements and modeling study from the MEIDEX campaign, J. Geophys. 20
Res., 110, D20202, doi:10.1029/2005JD005810, 2005.
Lin, Y.-L., Farley, R. D., and Orville, H. D.: Bulk parameterization of the snow field in a cloud model, J. Clim. Appl. Meteorol., 22, 1065–1092, 1983.
Lynn, B., Khain, A., Dudhia, J., Rosenfeld, D., Pokrovsky, A., and Seifert, A.: Spectral (bin) microphysics coupled with a mesoscale model (MM5). Part 1. Model description and first 25
results, Mon. Weather Rev., 133, 44–58, doi:10.1175/MWR-2840.1, 2005.
Lynn, B., Khain, A., Rosenfeld, D., and Woodley, W. L.: Effects of aerosols on precipitation from orographic clouds, J. Geophys. Res., 112, D10225, doi:10.1029/2006JD007537, 2007. Mahowald, N. M., Ballantine, J. A., Feddema, J., and Ramankutty, N.: Global trends in visibility:
implications for dust sources, Atmos. Chem. Phys., 7, 3309–3339, doi:10.5194/acp-7-3309-30
2007, 2007.
ACPD
12, 8225–8267, 2012The effects of mineral dust on
clouds and precipitation
A. Teller et al.
Title Page
Abstract Introduction
Conclusions References
Tables Figures
◭ ◮
◭ ◮
Back Close
Full Screen / Esc
Printer-friendly Version
Interactive Discussion
Discussion
P
a
per
|
Dis
cussion
P
a
per
|
Discussion
P
a
per
|
Discussio
n
P
a
per
Meyers, M. P., DeMott, P. J., and Cotton, W. R.: New primary ice-nucleation parameterizations in an explicit cloud model, J. Appl. Meteorol., 31, 708–721, 1992.
Min, Q.-L., Li, R., Lin, B., Joseph, E., Wang, S., Hu, Y., Morris, V., and Chang, F.: Evidence of mineral dust altering cloud microphysics and precipitation, Atmos. Chem. Phys., 9, 3223– 3231, doi:10.5194/acp-9-3223-2009, 2009.
5
Mitra, S. K., Brinkmann, J., and Pruppacher, H. T.: A wind tunnel study on th drop-to-particle conversion, J. Aerosol Sci., 23, 245–256, 1992.
Muhlbauer, A., Hashino, T., Xue, L., Teller, A., Lohmann, U., Rasmussen, R. M., Geresdi, I., and Pan, Z.: Intercomparison of aerosol-cloud-precipitation interactions in stratiform orographic mixed-phase clouds, Atmos. Chem. Phys., 10, 8173–8196, doi:10.5194/acp-10-8173-2010, 10
2010.
Phillips, V. T. J., DeMott, P. J., and Andronache, C.: An empirical parameterization of heteroge-neous ice nucleation for multiple chemical species of aerosol, J. Atmos. Sci., 65, 2757–2783, 2008.
Prospero, J., Ginoux, P., Torres, O., and Nicholson, S. E.: Environmental Characterization 15
of Global sources of atmospheric soil dust derived from the NIMBUS-7 TOMS absorbing aerosol product, Rev. Geophys., 40, 1002, doi:10.1029/2000RG000095, 2002.
Pruppacher, H. R. and Klett, J. D.: Pruppacher, H. R. and Klett, J. D.: Microphysics of Clouds and Precipitation, Kluwer Acad., Dordrecht, The Netherlands, 1954 pp., 1997, 1997.
Rasmussen, R. M., Geresdi, I., Thompson, G., Manning, K., and Karplus, E.: Freezing drizzle 20
formation in stably stratified layer clouds: the role of radiative cooling of cloud droplets, cloud condensation nuclei, and ice initiation, J. Atmos. Sci., 59, 837–860, 2002.
Reid, J. S., Kinney, J. E., Westphal, D. L., Holben, B. N., Welton, E. J., Tsay, S.-C., Eleu-terio, D. P., Campbell, J. R., Christopher, S. A., Colarco, P. R., Jonsson, H. H., Liv-ingston, J. M., Maring, H. B., Meier, M. L., Pilewskie, P., Prospero, J. M., Reid, E. A., 25
Remer, L. A., Russell, P. B., Savoie, D. L., Smirnov, A., and Tanr ´e, D.: Analysis of measurements of Saharan dust by airborne and ground-based remote sensing methods during the Puerto Rico Dust Experiment (PRIDE), J. Geophys. Res., 108 (D19), 8586, doi:10.1029/2002JD002493, 2003.
Rosenfeld, D., Rudich Y., and Lahav, R.: Desert dust suppressing precipitation: A possible 30