181 REM: R. Esc. Minas, Ouro Preto, 67(2), 181-184, apr. jun. | 2014
Metallurgy and materials
Metalurgia e materiais
Synthesis and characterization
of the Fe-Zn intermetallic
phases using the Rietveld
Method
Síntese e caracterização de fases intermetálicas
Fe-Zn por intermédio do Método Rietveld
Leandro de Arruda Santos
Professor
Universidade Federal de Minas Gerais (UFMG) Belo Horizonte, MG.
Leonardo Ulian Lopes
Master of Science – Programa de Pós-Graduação em Ciência e Engenharia de Materiais (PGMAT) Universidade Federal de Santa Catarina (UFSC) Florianópolis, SC.
Paulo Antônio Pereira Wendhausen
Professor
Universidade Federal de Santa Catarina (UFSC) Florianópolis, SC.
Abstract
The Rietveld Method was used to investigate the structure of three Fe-Zn inter-metallic phases and to quantify their proportion. The zeta, delta and gamma phases were successfully obtained by the sintering process. A simple mixture of the three in-termetallic phases was made with a known mass percentage and the XRD pattern of this mixture was collected and analyzed by the Rietveld Method. A difference of 14% between the simulated and the experimental XRD patterns was found, indicating a satisfactory itting. Slightly different lattice parameters from those given in the ICSD cards were observed. Because of the good itting, the calculated phase percentages of the mixture agreed closely with the real ones. Thus, it was concluded that the Rietveld Method is a reliable method to quantify the phases in galvannealed steel sheets and the same methodology applied in this laboratorial study can be applied to industrial sheets.
Keywords: Fe-Zn intermetallic phases, galvannealed steel sheets, Rietveld Method, X-ray diffraction.
Resumo
O Método Rietveld foi utilizado para investigar a estrutura de três fases interme-tálicas Fe-Zn e quantiicar sua proporção. As fases zeta, delta e gama foram obtidas com sucesso pelo processo de sinterização. Uma mistura simples das três fases interme-tálicas foi realizada com uma porcentagem de massas conhecida e seu padrão DRX foi coletado e analisado pelo Método Rietveld. Uma diferença de 14% entre os padrões DRX simulado e experimental foi encontrada, indicando um ajuste satisfatório. Uma pequena diferença entre os valores dos parâmetros de rede calculados e aqueles con-tidos nos cartões ICSD foi observada. Por conta do bom ajuste, as porcentagens de fase da mistura calculadas concordaram de maneira próxima com as porcentagens experimentais. Logo, concluiu-se que o Método Rietveld é um método coniável para quantiicar as fases presentes em aços galvannealed e que a mesma metodologia apli-cada nesse estudo laboratorial pode ser apliapli-cada em chapas industriais.
Palavras chave: Fases intermetálicas Fe-Zn, chapas de aço galvannealed, difração de raios X, Método Rietveld.
1. Introduction
The combination of corrosion re-sistance, surface quality and workability is one of the biggest challenges in the
automotive industry. In the last decades, several improvements led to the develop-ment of techniques that increased the
182
Synthesis and characterization of the Fe-Zn intermetallic phases using the Rietveld Method
REM: R. Esc. Minas, Ouro Preto, 67(2), 181-184, apr. jun. | 2014
2. Materials and methods
3. Results and discussion
In order to synthesize the pure Fe-Zn intermetallic phases, the powders of iron (purity: 99.99%) and zinc (purity: 99.98%) were mixed in the nominal com-positions of Fe11Zn40, FeZn13 and FeZn10. The powder mixtures were pressed in tablet shape and then sealed into a quartz tube under an argon atmosphere. The tablets were sintered at 420°C for 11 hours, following the conditions previ-ously reported by Kubascheweski (1982). After the sintering process, the tablets were milled and returned to the powder shape to avoid possible crystallographic
texture due the pressing step. The sample phases were identiied by the qualitative analysis of XRD patterns using a powder diffractometer (Rigaku, model Minilex, Japan) with Cu Kα radiation (λ = 1.5418 Å). The XRD patterns were recorded from 30° to 60°, which is a suficient range to obtain the main peaks of the Fe-Zn intermetallic phases, to prove that the zeta, delta and gamma phases were successfully obtained.
A specific quantity of each syn-thesized Fe-Zn intermetallic phase was selected and mixed. The selected mass
percentage of the mixture contained 50% of delta phase, 30% of zeta phase and 20% of gamma phase. This proportion was arbitrarily chosen, only as a matter of theoretical study. The XRD pattern of the mixture was also collected under the same conditions described previously. Finally, the XRD pattern of the mixture was analyzed by the Rietveld Method, using the DBWS 9708 software package. The theoretical quantities calculated by the Rietveld Method were then compared with the already known phase quantities to prove the accuracy of the method.
Three Fe-Zn intermetallic phases,
such as zeta, delta and gamma, which are often formed in the galvannealed coating layer, were investigated in this work. Their crystallographic properties are presented in Table 1.
Phases Formula Crystal structure Space group Lattice Parameter ICSD
zeta FeZn13 monoclinic C12/m1
a = 13.3940 Å
b = 7.5980 Å
c = 5.0660 Å
β = 100.53°
240050
delta Fe0.64Zn10.48 hexagonal P63mc a = 12.7870 Å
c = 57.2220 Å 150199 gamma Fe11.68Zn39.32 cubic F43m a = 17.9630 Å 103711
Table 1
Summarization of crystal structures, lattice parameters and chemical formulas of the Fe-Zn intermetallic phases (ICSD, 2005).
as dual phase or interstitial free steels, in the production of vehicle components. In the galvannealing process, steel sheets are subjected to a zinc bath followed by a heat treatment that converts the entire coating to a zinc-iron alloy (Kao et al., 2009). Thus, the main difference of this process when compared with a typical galvanized coating is the formation of intermetallic compounds between the deposited zinc layer and the iron from the substrate (McDevitt et al., 1997; Morimoto et al., 1997; Kato et al., 2000). The excellent weldability observed in galvannealed steels is one of the main advantages of this process, once the resultant coating pres-ents a melting point similar to the melting point of the substrate, providing a better usage of the electrodes. Furthermore, the cohesion between coating and sheet allows the production of a thinner layer with higher mechanical strength, result-ing in a steel sheet with superior work-ability and a surface that can be readily painted. Additionally, the galvannealed coating is less reactive when exposed to the atmosphere and the dissolution that occurs during corrosion process is more slowly than for a galvanized coating
(McDevitt et al., 1997; Morimoto et al., 1997; Kato et al., 2000).
The galvannealed coating is usually composed of three Fe-Zn intermetallic phases denominated as zeta (ζ), delta (δ) and gamma (Γ) (Hansen, 1958). In galvannealed steel sheets, the zeta phase is the top layer of the multi-layer system. The gamma phase is the layer next to the steel substrate and usually is the com-pound with the lowest mass percentage. The delta phase is the middle layer with the highest mass percentage (Wienströer
et al., 2003). Since the crystallographic properties of these phases are different from each other, the mechanical and metallurgical properties presented by a galvannealed steel sheet can be depen-dent on the phase fraction found in the coating (Nakamori et al., 1995). For example, the presence of a zeta phase may jeopardize the former process due to its high fragility, which makes an zeta phase amount of over ~8% not desirable for steel sheets applied in the automotive industry. Thus, it is very important to apply a method to quantify the phases present in the galvannealed coating to control the properties of this layer. Hong
et al. (2003) investigated and quantiied Fe-Zn intermetallic phases using Möss-bauer analysis, but this is too complex to be used as an industrial routine. On the other hand, X-ray diffraction (XRD) is an analytical method which already has been used in the characterization of crystalline steel sheet coatings for presenting reduced measuring time (Wienströer et al., 2003). The phases present in a crystalline alloy can be easily quantiied through its X-ray diffraction (XRD) pattern by means of the Rietveld Method. This method uses a least square approach to obtain a theoretical line proile that must match the experimental proile. Parameters as atomic positions and lattice parameters are reined to obtain this theoretical line (Young, 1993).
183 Leandro de Arruda Santos et al.
REM: R. Esc. Minas, Ouro Preto, 67(2), 181-184, apr. jun. | 2014 The XRD patterns recorded for the
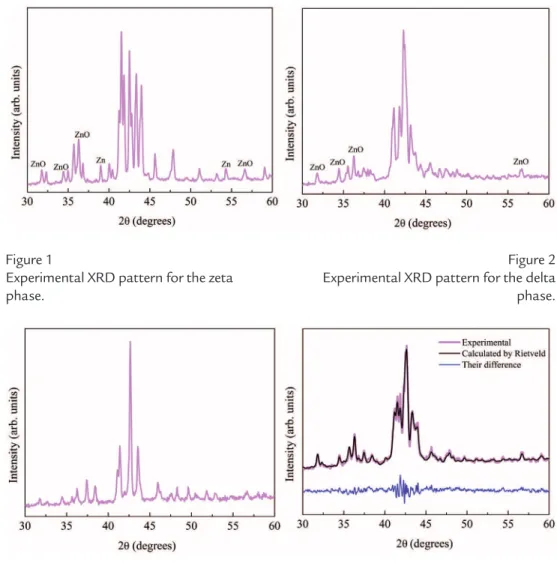
Fe-Zn intermetallic samples are shown in Figures 1-3. By comparing the peak patterns of igures 1, 2 and 3 with the reference ones (ICSD, 2005), it is possible to identify the Fe-Zn intermetallic samples as zeta, delta and gamma phases, respec-tively. Figure 2 shows the presence of pure Zn and ZnO phases because of the non-completion of the sintering process and oxidization during this process. However, the low intensity of these peaks represents a low quantity of these compounds, which
is not relevant to this study. The same is shown in Figure 3 where the presence of a low quantity of ZnO was detected.
Once the XRD results showed that the zeta, delta and gamma phases were successfully synthesized, the mixture of the three intermetallic phases (50% of delta, 30% of zeta and 20% of gamma) was performed and analyzed by XRD and the resultant pattern was used as in-put data to the Rietveld reinement. The experimental XRD pattern, the theoreti-cal line proile theoreti-calculated by Rietveld and
their difference are shown in Figure 4. The total difference between experimental and Rietveld calculated patterns was 14%, which is considered as a good itting, especially in the case of a pattern contain-ing many peaks. Through the difference line, it is possible to observe that the most relevant differences were observed in the 42° to 44° range. It was already expected because a considerable peak overlapping occurs in this range, resulting in eventual mismatches between experimental and calculated patterns.
Figure 1
Experimental XRD pattern for the zeta phase.
Figure 2 Experimental XRD pattern for the delta phase.
Figure 3
Experimental XRD pattern for the gamma phase.
Figure 4 Rietveld refinement for the phase mixture.
The mass percentage of the phase mixture calculated by the Rietveld re-inement is shown in Table 2. Since the mass percentage of the phases is related to the peak intensities, the eventual dif-ferences found between the calculated and experimental patterns could result in unreliable results. However, it is observed in Table 2 that the calculated
mass percentages are very close to the real ones. Thus, it is possible to afirm that the Rietveld Method is an accu-rate method to calculate the unknown mass percentage of Fe-Zn intermetallic phases. Since the Rietveld Method re-ines atomic parameters, such as lattice parameters, to obtain a line profile, this information was also calculated.
The best simulation was achieved with the lattice parameters a = 13.3540 Å,
b=7.5891 Å, c = 5.0773 Å, β=100.32° for the monoclinic FeZn13 phase,
184
Synthesis and characterization of the Fe-Zn intermetallic phases using the Rietveld Method
REM: R. Esc. Minas, Ouro Preto, 67(2), 181-184, apr. jun. | 2014
Phase Real Calculated
zeta 20% 19% delta 30% 27% gamma 50% 54%
Table 2
Comparison between the real and the Rietveld calculated mass percentage of the phase mixture.
Some limitations of this study should be pointed out. The Cu Kα ra-diation used in this work is not the ideal one to perform XRD analysis on alloys containing iron. This radiation interacts with iron causing luorescence, what may degrade the data quality. It was avoided in this study by means of a monochroma-tor and selection of a low angle range. Furthermore, the Rietveld Method is
known for being a powder method, in order to randomize the crystals on the analyzed surface, avoiding eventual mistakes generated by crystallographic texture, a common effect found in cold-rolled steel sheets. However, the galvan-nealed coating is resultant from a heat treatment performed after cold work, and then it is possible to afirm that the main effects of the crystallographic texture
are eliminated on the surface. Thus, per-forming this same analysis on industrial sheets would not represent considerable differences in the results. Additionally, once the reference patterns are known, the Rietveld reinement can be promptly performed in any XRD pattern from dif-ferent galvannealed steel sheets produced industrially by using the same methodol-ogy demonstrated in this study.
The Rietveld Method was used to investigate the structure of three Fe-Zn intermetallic phases and to quantify their proportion. The main conclusions of this study are the following:
• The zeta, delta and gamma phases were successfully obtained by a sintering process. This was proved through the XRD pattern analysis.
• A simple mixture of the three intermetallic phases was performed containing a known mass percentage. The XRD pattern of the mixture was collected and then analyzed by the Rietveld Method. A good agreement between experimental and calculated patterns was obtained with slightly different lattice parameters from those
given in the ICSD cards.
• Consequently, a good accor-dance among the mass percentage val-ues (calculated by the Rietveld Method and the real values) was found. It shows that the Rietveld Method can be used to quantify phases in galvannealed steel sheets produced industrially.
4. Conclusions
5. Acknowledgements
6. References
The authors thank Conselho
Na-cional de Desenvolvimento Científico e Tecnológico (CNPq) for the inancial support and Professor João Cardoso de Lima for the XRD measurements.
HANSEN, M. Constitution of binary alloys. New York: McGraw-Hill, 1958. 737p. HONG, J. H., OH, S. J., KWON, S. J. Mössbauer analysis of the iron-zinc intermetallic
phases. Intermetallics, v. 11, p. 207-213, 2003.
Inorganic Crystal Structure Database (ICSD). Gmelin-Institut für Anorganische Chemie and Fachinformationszentrum. FIZ Karlsruhe, 2005.
KAO, F. H., LI, W. C., CHEN, C. Y., HUANG, C. Y., YANG, J. R., WANG, S. H. Cross-sectional observation of the intermetallic phase in a galvannealed steel. Mate-rials Science and Engineering A, v. 499, n. 1-2, p. 45-48, 2009.
KATO, T., NUNOME, K., KANEKO, K., SAKA, H. Formation of the ζ phase at an in-terface between an Fe substrate and a molten 0.2 mass% Al–Zn during galvannealing.
Acta Materialia, v. 48, n. 9, p. 2257-2262, 2000.
KUBASCHEWESKI, O. Iron-binary phase diagrams. Springer-Verlag, 1982. 86p. MCDEVITT, E., MORIMOTO, Y., MESHII, M. Characterization of the Fe-Al
interfa-cial layer in a commerinterfa-cial hot-dip galvanized coating. ISIJ International, v. 37, n. 8, p. 776-782, 1997.
MORIMOTO, Y., MCDEVITT, E., MESHII, M. Characterization of the Fe-Al inhibi-tion layer formed in the initial stages of hot-dip galvannealing. ISIJ International, v. 37, n. 9, p. 906-913, 1997.
NAKAMORI, T., ADACHI, Y., ARAI, M., SHIBUYA, A. Coating adhesion and interfa-ce structure of galvannealed steel. ISIJ International, v. 35, n. 12, p. 1494-1501, 1995. WIENSTRÖER, S., FRANSEN, M., MITTELSTÄDT, H., NAZIKKOL, C., VÖLKER,
M. Zinc/Iron phase transformation studies on galvannealed steel coatings by X-ray diffraction. International Centre for Diffraction Data, v. 46, p. 291-296, 2003. YOUNG, R. A. The Rietveld Method. Oxford: University Press, 1993.