DOI: http://dx.doi.org/10.1590/2446-4740.0693
*e-mail: [email protected]
Received: 04 December 2014 / Accepted: 20 April 2015
Drowsiness detection for single channel EEG by DWT best m-term
approximation
Tiago da Silveira, Alice de Jesus Kozakevicius, Cesar Ramos Rodrigues*
Abstract Introduction: In this paper we propose a promising new technique for drowsiness detection. It consists of applying the best m-term approximation on a single-channel electroencephalography (EEG) signal preprocessed through a discrete wavelet transform. Methods: In order to classify EEG epochs as awake or drowsy states, the most signiicant m terms from the wavelet expansion of an EEG signal are selected according to the magnitude of their coeficients related to the alpha and beta rhythms. Results: By using a simple thresholding strategy it provides hit rates comparable to those using more complex techniques. It was tested on a set of 6 hours and 50 minutes EEG drowsiness signals from PhysioNet Sleep Database yielding an overall sensitivity (TPR) of 84.98% and 98.65% of precision (PPV). Conclusion: The method has proved itself eficient at separating data from different brain rhythms, thus alleviating the requirement for complex post-processing classiication algorithms.
Keywords: Signal processing, Drowsiness detection, Wavelet transform, Best m-term approximation, Frequency bands, DB2 Wavelet.
Introduction
The World Health Organization (WHO) has been
concerned with road trafic injuries for over four
decades. According to WHO’s report (Peden et al., 2004), around 1.2 million people die worldwide because
of road trafic accidents every year. According to the
same document, nearly 30% of fatal crashes involving heavy commercial transport in USA, and approximately 20% of commercial transport crashes in Europe were fatigue-related. In 2007 a similar scenario was revealed
on the Brazilian federal highways, when 3.367 trafic
accidents were also attributed to drowsiness (Bacchieri and Barros, 2011). Hence, drowsy driving is the major cause of hundreds of thousands of deadly accidents every year around the world. Being considered as a public health issue, a variety of countermeasures are currently under investigation to mitigate it.
Attempts to develop fatigue countermeasure EEG-based devices date back to 1993 (Hunn, 1993) when EEG was investigated as an assessment tool of
fatigue in light pilots. After that, researches addressing
association between brain wave variations and driver drowsiness using EEG (Lal and Craig, 2001), and sleep
stages classiication methods as in (McKeown et al., 1998), have become increasingly frequent.
In a neurophysiological approach, drowsiness is known as the transition from awake into the sleeping
state, characterized by decreased attention and slow movements. The sleep process starts with the activation and inhibition of neurons in different brain areas. As this process is rhythmic and synchronized, when
observed through EEG signals it is identiied by:
(i) decreased activity of beta rhythm ([13-30]Hz); (ii) increase and subsequent reduction of alpha rhythm activity ([8-13]Hz); and (iii) increased theta rhythm activity ([4-8]Hz) (Blinowska and Durka, 2006).
In order to identify these variations in a realistic environment, Papadelis et al. (2006; 2007) performed EEG measurements on drivers after normal sleeping or after remaining awake for at least 24 hours prior to the driving experiment. This study showed
signiicant alterations in all frequency bands except gamma. The irst minutes of the experiment revealed
also the sensitivity in the beta and alpha bands with respect to the driver’s drowsiness level. It is worth to notice that EEGs acquired from voluntary sleep in bed and involuntary sleep during driving exhibit differences in vertex and spindle waves morphologies (Yeo et al., 2007), nevertheless it is assumed that the main variations on beta, alpha and theta rhythms are present in every sleep context. Since those differences
are restricted to speciic EEG events while the
proposed methodology considers only alpha and beta rhythms, this study developed from a voluntary sleep
database is considered a reliable approach for a real world application.
Besides experimental knowledge, signal processing approaches have contributed to complement different aspects of the problem, treating drowsiness as a pattern to be recognized from brain signals. Previous studies commonly used Fast Fourier Transform (FFT) or Discrete Wavelet Transform (DWT) (Akay, 1998; Correa and Leber, 2010; De Carli et al., 1999; Liang et al., 2006; Subasi, 2005) as a feature selection technique, while Mahalanobis distance (Lin et al., 2010), independent component analysis (Lin et al., 2005) or neural network were used as
classiiers (Subasi, 2005). Correa and Leber (2010)
also used an artiicial neural network to classify
drowsiness through the extracted characteristics from an EEG signal using wavelets and Fourier spectrum. However, it is the multiresolution capability of the wavelet transform, providing a measure of EEG energy at each decomposition level, that makes it a better choice for automatic detection of arousals during the sleep (De Carli et al., 1999), as well as for many other applications using EEG and other biomedical signals (Akay, 1998).
Once dynamic power consumption of CMOS based processors is proportional to the product of supply voltage squared and clock frequency ( 2.
dd ck
V f )
(Tan et al., 2014), the increasing processing power of portable devices is also incrementing the energy demand. In order to enable the implementation of EEG real-time processing on mobile, wearable or even implantable devices in a near future, the availability
of both eficient and lightweight algorithms is a
needful feature.
We therefore propose the application of best m-term approximation, a technique commonly considered for data compression, on wavelet transformed EEG signals as an alternative for identifying drowsiness patterns. The technique can be attractive for implementing fatigue detection on low-power devices because DWT kernels require fewer execution steps than FFT algorithms (complexities for transforming 1D signals with N points are respectively in the order of N and
N.log2 (N) steps (Beylkin et al., 1991)). Additionally, simple threshold techniques are employed instead
of classiication strategies based on heavy matrix
operations (Lawhern et al., 2013; Liang et al., 2006; Lin et al., 2010). Another advantage of the proposed technique is the fact that no previous artifact
rejection is necessary, since the thresholded wavelet
representation of the EEG signal already works as a
type of iltering process, removing low frequencies
from the analyzed signal.
As a starting point for introducing the main tools of our analysis scheme, a short overview about the considered wavelet transform and the best m-term approximation strategy are summarized, followed by the proposed algorithm, the simulation results
and the inal discussion.
Methods
Wavelets have become an alternative and eficient
tool to analyze EEG signals in association with other heuristics and methods. In (Sinha, 2008) wavelets were combined with neural networks for detecting sleep spindles, REM and wake states. In (Rosso et al., 2001) the relative wavelet energy provided information about the relative energy associated with different frequency bands present in the EEG. In the current work we consider the discrete wavelet transform
irstly to recognize different brain rhythms and then
to propose a heuristic to automatically detect the drowsiness state.
Wavelet series expansion
The wavelet analysis of a signal provides time and frequency information at different levels of resolution, representing also non-stationary signals (Daubechies, 1992). These characteristics justify the use of wavelets in the brain signal processing.
Discrete Wavelet Transform
The DWT can be understood as the discretization of the continuous wavelet transform (CWT). CWT consists
of determining the coeficients of the wavelet series
expansion of the signal f (t), given by the correlation between f (t) and the analyzing wavelet Ψ (t).
( ), , , ( ) , ( )
Wf f f t t dt
+∞ α τ α τ
−∞
α τ = ψ = ∫ ψ
(1)
In Equation 1 the parameter α indicates the wavelet
scale and the parameter τ indicates its position.
The analysis is performed by varying these parameters continuously. On the other hand, DWT uses discrete values for α and τ. The implementation of the DWT
can be eficiently and accurately computed through ilter banks (Mallat, 1989) when dyadic values are chosen for α and special restrictions are imposed to the wavelet family.
In this study, the ilters considered are associated
( ) 0 ( ) ( )
0 0
0
2 1 1 2 1
, , , ,
0 0
J J j
J l J l j l j l
l j J l
f t −c t − −d t
= = =
= ∑ ∅ + ∑ ∑ ψ
(2)
For the Equation 2 and the others in this study, the following notation is used: J0 is the coarsest level for the DWT, in which the inverse wavelet transform (IWT) starts, J is the inest level with 2Jelements,
equivalent to the input samples of the signal.
The coeficients set f =
{
CJ0,DJ0,DJ0+1, ..., DJ−1}
is obtained by applying the DWT. Each level j has 2Jelements, j = J
0, ..., J-1, and therefore the total number
of wavelet coeficients for the entire decomposition is
N = 2J-1 - 2J0. The subset C
J0 contains the scale coeficients CJ0,l for thelevel J0 and positions l = 0,1, ... ,2J0 -1. The subsets Dj contain the wavelet coeficients dj,l for the level j and positions l = 0,1, ... ,2j -1.
To allow multiresolution analysis of the signal f, the levels of DWT are ordered so that J0 ≤ j ≤ J. The choice of J value depends on the signal length and the sample rate, while J0 must be chosen with the highest possible value in order to minimize the border effects of the wavelet decomposition algorithm, when periodic boundary conditions are chosen.
Relationship between scale and frequency
Once drowsiness is characterized through brain rhythms, it is fundamental to establish a relationship between scales from the DWT decomposition and frequencies being considered intrinsic for the phenomena. Considering that each wavelet Ψ (t) has a central frequency fc – which corresponds to the
frequency of the sinusoid that best its the waveform
of Ψ (t) – the relationship between scale and frequency can be given through the pseudo-frequencies fα , which relates fc to the scale α and to the sampling period
Ts (Misiti et al., 2010).
c s
f f
T
α=α
(3)
Table 1 lists the pseudo-frequency equivalent to the main scales used in this study. Its values were computed with Equation 3 considering the sample period Ts = 0.01s, once the EEG signal was obtained with a sample frequency fs = 100Hz.
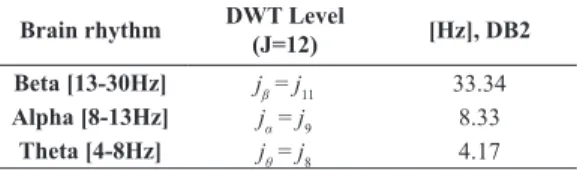
Once the wavelets DB2 have compact support in time, their bandwidth cannot be limited (Strang and Nguyen, 1996), implying a spread frequency spectrum with some overlap between the DWT levels, as showed in Figure 1. However, this frequency response still allows to distinguish the main brain rhythms in an appropriate way for this study. The central frequency must be understood as a scale equivalence in the frequency domain, yet it might not be exact. To work with discrete wavelet transform in
the frequency domain, the spectrum shown in Figure 1
must be analyzed jointly with Table 1. For example, the alpha rhythm comprises the frequencies between 8Hz and 13Hz. Table 1 shows that, for a J=10 DWT, the central frequency of 8.33Hz is equivalent to level j7. Then looking at Figure 1 we see that the whole alpha
rhythm spectrum best its DB2 wavelet in the level j7. Further, the Daubechies Wavelet with two vanishing moments (DB2) was chosen, considering the fewer
ilters available, since it preserves the border values
of the signal and introduces the smallest possible error on the borders of the analyzed signal, when dealing with the periodic form of the transform.
Best m-term approximation
Given
{
}
0, 0, 0 1, ..., 1 J J J J
f = C D D + D− the set of
coeficients from the wavelet series expansion of f (t),
the best m-term approximation chooses only the irst
m wavelet coeficients of higher modulus from the total N wavelet coeficients, with m < N (Stollnitz et al., 1995; Temlyakov, 2003). The N - m wavelet coeficients
with lower magnitude are replaced by zero and the
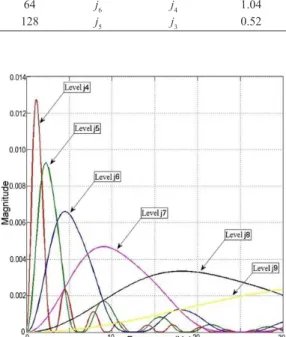
Table 1. Relationship between scales, resolution level and frequency for DB2 wavelet (fc = 0,6667, fs = 100Hz).
Scale Level (J = 12)
Level
(J =10) [Hz]
2 j11 j9 33.34
4 j10 j8 16.67
8 j9 j7 8.33
16 j8 j6 4.17
32 j7 j5 2.08
64 j6 j4 1.04
128 j5 j3 0.52
scale coeficients Cj0 are kept. The new set of modiied
coeficients is called p and its inverse wavelet transform (IWT) generates the approximated signal p (t).
In fact, the number m of active coeficients in the
new expansion is chosen such that the approximation
p (t) of the signal f(t) presents an error p (t) - f (t)2 as small as possible, which is measured by the distance between the signal f(t) and its approximation p (t).
( ) ( ) ( ) ( )
2 1
2 0 2
N
i p ti f ti
p t f t
N −
= −
∑
= − =
∈
(4)
Due to orthonormality of the Daubechies wavelet basis, the error for the best m-term approximation method can be obtained as follows:
Let σ (i) = (j,k), i = 1,2, ..., m, be the correspondence to the original level j and position k of the wavelet
coeficients selected on the ordering process. In the
same way, there is a correspondence ρ (i) = (j,k) for
all the non-signiicant coeficients, i.e. those replaced
by zero. The square error for this approximation
can be written just in function of the non-signiicant coeficients (Stollnitz et al., 1995).
( ) ( )2 ( ) ( )( )2 ( )
1 1
N m N m
i i i
i i
p t f t −dρ ρ t −dρ
= =
− = ∑ ψ = ∑
(5)
Equation 5 shows that the minimum square error between the original function and the approximate
function occurs when the wavelet coeficients are sorted
in a decreasing way according to their magnitude,
exactly as stated by the best m-term approximation method (Stollnitz et al., 1995).
What allows the application of this strategy to the drowsiness detection is that, according to numerical experiments from (Silveira, 2012), this operation maintains the frequency spectrum of the signal, even when mN (much smaller than). Furthermore, the wavelet transform time resolution is far superior when compared to the Short Time Fourier Transform (STFT), considering the levels associated to the higher frequencies (Mallat, 1989). To illustrate this, consider a signal f (t) with the pure harmonic components of 5Hz and 20Hz, as shown on Figure 2a. The signiicant
coeficients after best m-term approximation (p) are given on Figures 2b-d show the STFT analysis for
f (t) and p(t) , respectively.
A closer inspection of Figure 2b shows that the best m-term approximation further separates frequency contents. After applying the best m-term approximation,
only signiicant coeficients from those DWT levels
related to the frequency of input signal are preserved at each period of time.
Drowsiness detection
Through the joint analysis of Table 1 and Figure 1 we observe that there exists a connection between brain rhythms and DWT levels. Thus, considering an individual initially awake and alert, the drowsiness state is here characterized by (i) the absence of
signiicant coeficients in levels that represent the
Figure 2. Best m-term approximation applied to a signal whose fundamental frequency is switched from 5 to 20Hz at 5.1s. (a) f(t) in black,
beta rhythm, jβ; (ii) concentration and a subsequent
decrease of signiicant wavelet coeficients in levels
related to alpha activity, jα, which means the person has closed his/her eyes in the moments preceding the drowsy state. The theta rhythm is represented by the lower DWT levels, which also represents noises and muscular movements. For this reason, the proposed
algorithm considers, in the most analysis, just the
alpha and beta rhythms.
Moreover, the best m-term approximation was applied to a study database (UniNova, 2010) in order
to deine the DWT levels that better represent each
cognitive state. The signals were sampled at fs = 100Hz and analyzed in epochs of 30s – each one zero-padded to 4096 samples, allowing a DWT with 12 levels. Considering these parameters, Table 2 shows the DWT level that corresponds to each brain rhythm.
Once it is known which brain rhythm is associated to the drowsiness process, this cognitive state can be detected by observing the DWT level that has more
signiicant coeficients. Considering that each level j of DWT has 2j coeficients, the signiicant coeficients
from levels jβ and Jα must be weighted.
.100; .100
2 2
j j
j j
m m
P α P
α
α= β= ββ
(6)
Where m is the number of signiicant coeficients on
each level indicated by the index jβ or jα. Pα, and pβ are called alpha weight and beta weight, respectively.
Based on these statements, the following is proposed for analyzing EEG signals aiming to detect drowsiness characteristics:
Require:Signal f(t) with 2J samples; value of m
signiicant coeficients.
Ensure: AWAKE or DROWSY state.
1: TWD(f) → f
2: Best m-term approximation on f → p 3: From p, calculates Pα
4: From p, calculates Pβ 5: ifPα > λαthen
6: Calculates λβ ( Pα )
7: ifPβ < λβthen
8: State ← DROWSY
9: else
10: State ← AWAKE
11: end if
12: else
13: State ← AWAKE
14: end if
The threshold parameters λα and λβ are obtained empirically when the proposed algorithm is applied to a training data. The training signals used in this study are from four patients of PhysioNet Sleep
Database (Goldberger et al, 2000). The training
data contains 200 epochs of 30s with the cognitive state evaluated on its hypnogram.
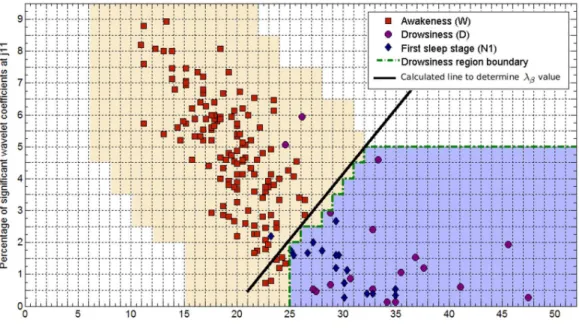
The steps 01 to 04 of the proposed algorithm were applied to each epoch of the training data in order to obtain the Pα and Pβ parameters. The results are shown in the feature space of Figure 3, where
blue diamonds represent the epochs classiied as the irst sleep stage (N1) on the hypnogram, the purple
circles represent the epochs considered as drowsy,
while the red squares represent the epochs classiied
as awake on the hypnogram.
Analyzing the location of points in Figure 3, two classes of data can be distinguished: the red one, associated to awake state; and the blue one, associated
to drowsiness. Based on this classiication, the thresholding values are deined to limit the drowsiness
region (bounded by the dashed green line). There are
different ways to deine mathematically this region.
In this work, the simplest way is to, empirically, set a
ixed λα = 25. Performance can be optimized through the use of adaptive classiiers, at the cost of a higher
computational burden, being beyond the scope of this
paper. The value of λβ can be obtained by the line
equation calculated by interpolating points (Pα = 25; Pβ) and (Pα = 32; Pβ = 5) the black line on Figure 3,
whose equation is given by λβ = 0.429 Pα - 8.714.
Results
To validate the algorithm proposed in the section before, 41 signals from 13 distinct patients of
PhysioNet Sleep Database (Goldberger et al., 2000) were selected. Considering that each selected signal contains 20 epochs of 30 seconds, the algorithm was employed to evaluate a period equivalent to 6 hours and 50 minutes. The signals were collected from
Fpz channel (EEG electrode positioned at prefrontal region due to its ease of use in a driver facility, as in other studies (Hsu et al., 2013)) and sampled at
fs = 100Hz.
The signal selection was made in order to demonstrate the following cognitive states, based on the specialist hypnogram: (W) awake, with eyes opened and performing concentration activity; (D) awake but with closed eyes in a relaxed state, with
Table 2. Relationship among brain rhythms and DWT levels (DB2,
fc = 0,6667, fs = 100Hz).
Brain rhythm DWT Level
(J=12) [Hz], DB2 Beta [13-30Hz] jβ = j11 33.34 Alpha [8-13Hz] jα = j9 8.33
EEG predominance of alpha rhythm (unlocked alpha)
and (N1) corresponding to the irst stage of sleep on R&K classiication (Avidan and Barkoukis, 2011).
Considering the cognitive states listed above, the selected signals were divided into three control groups:
A) The patient was awake during all the sampled period (W state).
B) The patient alternated between awake and relaxed state (W and D states).
C) The patient goes from an awake state to a relaxed state and then becomes sleepy (W, D and N1 states).
Drowsiness is then considered when the patient is on D or N1 states. However, the characteristics of each patient must be taken into account to interpret the results: the signals from Patient Sc4002e0 and Sc4112e0 contain all the cognitive states well
deined and occurring in separate time. In turn, Patient Sc4012e0 presents just a relaxed state before
becoming drowsy, which leads to some false-positives,
i.e., awake states identiied as drowsy state. Patient
Sc4102e0 has the absence of alpha activity (locked alpha), which is associated to cognitive and personal characteristics of the patient. In this case, drowsiness is detected mainly by the theta rhythm. All the other patients contains the group C characteristics.
For the sake of comparison, the metrics for awake and
drowsy identiications was chosen based on confusion
matrix in the same way as (Lin et al., 2010): True
Positive (TP - drowsy people correctly diagnosed as drowsy), False Positive (FP - alert people incorrectly
identiied as drowsy), True Negative (TN - alert people correctly identiied as alert), and False Negative (FN - drowsy people incorrectly identiied as alert).
Hence, precision (PPV) and sensitivity (TPR) can be calculated as shown in Equation 7.
,
TP TP
PPV TPR
TP FP TP FN
= =
+ +
(7)
Where PPV represents the precision of drowsiness prediction, and TPR is the percentage of patients
correctly identiied as drowsy.
Based on this, Table 3 shows parameters of confusion matrix for each signal group, and for the whole set of epochs employed in this study.
Discussion
An increasing number of papers on EEG-based techniques for automatic fatigue detection can be found in literature. Proposed solutions comprehend
combination of processing and classiication techniques such as electronic iltering, FFT, WT and ANN,
SVM, k-means and PCA. Nevertheless, devices for drowsiness detection and countermeasure, besides being the most pervasive as possible, must exhibit high reliability standards in order to prevent false alarms or undetected events. Hence, low-computational burden (and low-power consumption) allied to high hit rates are highly desirable features.
Our results are compared to results from other works in Table 4. Lin et al. (2010) have proposed a portable real-time microprocessed brain-computer interface (BCI) system for detecting drowsiness in drivers. They developed a detection algorithm that continuously computes the Mahalanobis distance between a set of alpha and beta rhythm amplitudes and an alertness reference model. In their work, alpha and beta components were obtained through a 512-point FFT. Hu et al. (2013) used a classiication method based on support vector machine (SVM) on a collection of three-channel EEG signals for drive fatigue detection. EEG signals were preprocessed with an independent component analysis with reference (ICA-R) algorithm for electrooculography (EOG) interference removal. Another interesting set of results was presented by Lawhern et al. (2013):
their detection strategy relied on the identiication of
alpha spindles employing discounted autoregressive (DAR) modeling.
Recently, some encouraging results were published reporting sensitivities higher than 88% (Lin et al., 2010) by allying FFT to Mahalanobis distance for
classiication of alpha and theta rhythms. Higher
rates were reported by Lawhern et al. (2013). Hit rates higher than 94% were obtained by applying a sequential discounted autoregressive algorithm on
a digital iltered EEG for detecting alpha spindles.
According to Blinowska and Durka (2006), the basic criterion for accepting an automatic method in the EEG analysis is its agreement to visual inspection of the hypnogram. According to the same authors, the
correlation between the same classiications made
by different specialists is 87.5% which is not high enough for implementing a safety system.
The analysis of results from Table 4 suggests that the proposed technique is promising for implementing drowsiness detection systems on portable devices, since discrete wavelet transform has lower computational cost when compared to FFT and the m-term best
approximation seems to ease the identiication job.
Furthermore, the proposed technique provides comparable sensitivities with a relative lower complexity. When applied to Daubechies WT, the best m-term
approximation is able to select a set of coeficients
highly correlated to alpha and beta rhythms. A simple
thresholding strategy was suficiently selective to
reach precision rate higher than 98%. Future works include testing it on a more comprehensive data
set and investigating classiication based on other
parameters than alpha and beta rhythms.
Acknowledgements
The authors would like to thank to PPGI of Federal University of Santa Maria, to CNPq and FAPERGS, PG 1873-25.51/13-0.
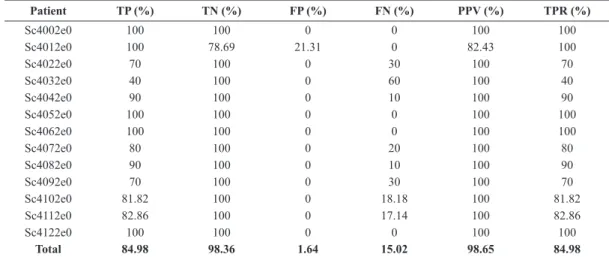
Table 3.
Confusion matrix parameters considering the results when the algorithm is applied to the PhysioNet Sleep Database patients.
Patient TP (%) TN (%) FP (%) FN (%) PPV (%) TPR (%)
Sc4002e0 100 100 0 0 100 100
Sc4012e0 100 78.69 21.31 0 82.43 100
Sc4022e0 70 100 0 30 100 70
Sc4032e0 40 100 0 60 100 40
Sc4042e0 90 100 0 10 100 90
Sc4052e0 100 100 0 0 100 100
Sc4062e0 100 100 0 0 100 100
Sc4072e0 80 100 0 20 100 80
Sc4082e0 90 100 0 10 100 90
Sc4092e0 70 100 0 30 100 70
Sc4102e0 81.82 100 0 18.18 100 81.82
Sc4112e0 82.86 100 0 17.14 100 82.86
Sc4122e0 100 100 0 0 100 100
Total 84.98 98.36 1.64 15.02 98.65 84.98
Table 4. Comparison to other techniques.
Results Sensitivity (%) Speciicity (%) Accuracy (%) Precision (%)
(Lin et al., 2010) 88.7 - - 76.9
(Hu et al., 2013) 86 64 75
-(Lawhern et al., 2013) 94.2 98.4 - 72.8
References
Akay M. Time Frequency and wavelets in biomedical signal processing. New York: IEEE Press; 1998.
Avidan AY, Barkoukis TJ. Review of sleep medicine: expert consult. 3rd ed. St. Louis: Saunders; 2011.
Bacchieri G, Barros AJD. Traffic accidents in Brazil from 1998 to 2010: many changes and few effects. Revista de Saude Publica. 2011; 45(5):949-63. http://dx.doi.org/10.1590/ S0034-89102011005000069. PMid:21953026.
Blinowska K, Durka P. Electroencephalography (EEG). New York: John Wiley; 2006.
Beylkin G, Coifman RRV, Rokhlin V. Fast wavelet transforms and numerical algorithms I. Communications on Pure and Applied Mathematics. 1991; 44(2):141-83. http://dx.doi. org/10.1002/cpa.3160440202.
Correa AG, Leber EL. An automatic detector of drowsiness based on spectral analysis and wavelet decomposition of EEG records. In: Annual International Conference of the IEEE; 2010 Aug 31-Sept 4; Buenos Aires, Argentina. Piscataway: IEEE; 2010. p. 1405-8. http://dx.doi.org/10.1109/ IEMBS.2010.5626721.
Daubechies I. Ten lectures on wavelets. Philadelphia: SIAM; 1992.
De Carli F, Nobili L, Gelcich P, Ferrillo F. A method for the automatic detection of arousals during sleep. Sleep. 1999; 22(5):561-72. PMid:10450591.
Goldberger AL, Amaral LAN, Glass L, Hausdorff JM, Ivanov PC, Mark RG, Mietus JE, Moody GB, Peng C-K, Stanley HE. PhysioBank, PhysioToolkit, and PhysioNet: components of a new research resource for complex physiologic signals. Circulation. 2000; 101(23):E215-20. http://dx.doi. org/10.1161/01.CIR.101.23.e215. PMid:10851218.
Hsu Y-L, Yang Y-T, Wang J-S, Hsu C-Y. Automatic sleep stage recurrent neural classifier using energy features of EEG signals. Neurocomputing. 2013; 104:105-14. http:// dx.doi.org/10.1016/j.neucom.2012.11.003.
Hu S, Peters B, Zheng G. Driver fatigue detection from electroencephalogram spectrum after electrooculography artifact removal. IET Intelligent Transport Systems. 2013; 7(1):105-13. http://dx.doi.org/10.1049/iet-its.2012.0045.
Hunn BP. The use of EEG as a workload assessment tool in flight test. California: Air Force Flight Test Center; 1993. Available from: http://www.dtic.mil/dtic/tr/fulltext/ u2/a274568.pdf.
Lal SKL, Craig A. Electroencephalography activity associated with driver fatigue: implications for a fatigue countermeasure device. Journal of Psychophysiology. 2001; 15(3):183-9. http://dx.doi.org/10.1027//0269-8803.15.3.183.
Lawhern V, Kerick S, Robbins KA. Detecting alpha spindle events in EEG time series using adaptive autoregressive models. BMC Neuroscience. 2013; 14(101):1. http://dx.doi. org/10.1186/1471-2202-14-101. PMid:24047117.
Liang S-F, Lin C-T, Wu R-C, Chen YC, Huang TY, Jung T-P. Monitoring driver’s alertness based on the driving performance estimation and the EEG power spectrum
analysis. In: Annual International Conference of the IEEE; 2006 Jan 17-18; Shangai, China. Piscataway: IEEE; 2006. p. 5738-41. http://dx.doi.org/ 10.1109/IEMBS.2005.1615791.
Lin C-T. Wu R-C, Liang S-F, Chao W-H, Chen Y-J, Jung T-P. EEG-based drowsiness estimation for safety driving using independent component analysis. IEEE Transactions on Circuits and Systems. 2005; 52(12):2726-38. http:// dx.doi.org/10.1109/TCSI.2005.857555.
Lin C-T, Chang C-J, Lin B-S, Hung S-H, Chao C-F, Wang I-J. A real-time wireless brain-computer interface system for drowsiness detection. IEEE Biomedical Circuits and Systems. 2010; 4(4):214-22. http://dx.doi.org/10.1109/ TBCAS.2010.2046415. PMid:23853367.
Mallat SG. A theory for multiresolution signal decomposition: the wavelet representation. IEEE Transactions on Pattern Analysis and Machine Intelligence. 1989; 11(7):674-93. http://dx.doi.org/10.1109/34.192463.
McKeown MJ, Humphries C, Achermann P, Borbély AA, Sejnowski TJ. A new method for detecting state changes in the EEG: exploratory application to sleep data. Journal of Sleep Research. 1998; 7(Suppl 1):48-56. http://dx.doi. org/10.1046/j.1365-2869.7.s1.8.x. PMid:9682194. Misiti M, Oppenheim G, Poggi JM. Wavelet toolbox 4 user’s guide. Natick: Mathworks; 2010.
Nielsen OM. Wavelets in scientific computing. Lyngby: Technical University of Denmark; 1998.
Papadelis C, Kourtidou-Papadeli C, Bamidis PD, Chouvarda I, Koufogiannis D, Bekiaris E, Maglaveras N. Indicators of sleepiness in an ambulatory EEG study of night driving. In: 28th Annual International Conference of the IEEE; 2006 Aug 30-Sep 03; New York, USA. Piscataway: IEEE; 2006. p. 5738-41. http://dx.doi.org/ 10.1109/IEMBS.2006.259614.
Papadelis C, Chen Z, Kourtidou-Papadeli C, Bamidis PD, Chouvarda I, Bekiaris E, Maglaveras N. Monitoring sleepiness with on-board electrophysiological recordings for preventing sleep-deprived traffic accidents. Clinical Neurophysiology : Official Journal of the International Federation of Clinical Neurophysiology. 2007; 118(9):1906-22. http://dx.doi. org/10.1016/j.clinph.2007.04.031. PMid:17652020. Peden M, Scurfield L, Sleet D, Mohan D, Hyder AA, Jarawan E, Mathers C. World report on road traffic injury prevention. Geneva: World Health Organization; 2004. Available from: http://whqlibdoc.who.int/publications/2004/ 9241562609.pdf.
Rosso OA, Blanco S, Yordanova J, Kolev V, Figliola A, Schürmann M, Başar E. Wavelet entropy: a new tool for analysis of short duration brain electrical signals. Journal of Neuroscience Methods. 2001; 105(1):65-75. http://dx.doi. org/10.1016/S0165-0270(00)00356-3. PMid:11166367.
Silveira, T. Drowsiness detection from a single electroencephalography channel through discrete wavelet transform [dissertation]. Santa Maria: Federal University of Santa Maria; 2012.
Stollnitz EJ, Derose TD, Salesin DH. Wavelets for computer graphics: a primer, part 1. IEEE Computer Graphics and Applications. 1995; 15(3):76-84. http://dx.doi. org/10.1109/38.376616.
Strang G, Nguyen T. Wavelets and filter banks. Wellesley: Wellesley College; 1996.
Subasi A. Automatic recognition of alertness level from EEG by using neural network and wavelet coefficients. Expert Systems with Applications. 2005; 28(4):701-11. http://dx.doi.org/10.1016/j.eswa.2004.12.027.
Tan L, Kothapalli S, Chen L, Hussaini O, Bissiri R, Chen Z. A survey of power and energy efficient techniques for high performance numerical linear algebra operations.
Parallel Computing. 2014; 40(10):559-73. http://dx.doi. org/10.1016/j.parco.2014.09.001.
Temlyakov VN. Nonlinear methods of approximation. Foundations of Computational Mathematics. 2003; 3(1):33-107. http://dx.doi.org/10.1007/s102080010029.
UniNova. Sleep electroencephalography signal database. Lisbon: UNINOVA; 2010.
Yeo MV, Li X, Wilder-Smith EP. Characteristic EEG differences between voluntary recumbent sleep onset in bed and involuntary sleep onset in a driving simulator. Clinical Neurophysiology : Official Journal of the International Federation of Clinical Neurophysiology. 2007; 118(6):1315-23. http:// dx.doi.org/10.1016/j.clinph.2007.02.001. PMid:17398150.
Authors
Tiago da Silveira1, Alice de Jesus Kozakevicius2, Cesar Ramos Rodrigues3*
1 Programa de Pós-Graduação em Informática – PPGI, Universidade Federal de Santa Maria – UFSM, Santa Maria, RS,
Brazil.
2 Laboratório de Análise Numérica e Astrofísica – LANA, Departamento de Matemática, Universidade Federal de Santa
Maria – UFSM, Santa Maria, RS, Brazil.
3 Departamento de Eletrônica e Computação – DELC,Universidade Federal de Santa Maria – UFSM, CEP 97105-900,