*e-mail: [email protected]
Received: 12 August 2014 / Accepted: 30 March 2015
Diabetes classiication using a redundancy reduction preprocessor
Áurea Celeste Ribeiro*, Allan Kardec Barros, Ewaldo Santana, José Carlos Príncipe
Abstract Introduction Diabetes patients can beneit signiicantly from early diagnosis. Thus, accurate automated screening is becoming increasingly important due to the wide spread of that disease. Previous studies in automated screening have found a maximum accuracy of 92.6%. Methods: This work proposes a classiication methodology based on eficient coding of the input data, which is carried out by decreasing input data redundancy using well-known ICA algorithms, such as FastICA, JADE and INFOMAX. The classiier used in the task to discriminate diabetics from non-diaibetics is the one class support vector machine. Classiication tests were performed using noninvasive and invasive indicators. Results: The results suggest that redundancy reduction increases one-class support vector machine performance when discriminating between diabetics and nondiabetics up to an accuracy of 98.47% while using all indicators. By using only noninvasive indicators, an accuracy of 98.28% was obtained. Conclusion: The ICA feature extraction improves the performance of the classiier in the data set because it reduces the statistical dependence of the collected data, which increases the ability of the classiier to ind accurate class boundaries.
Keywords: Diabetes, Clustering, Eficient coding, Independent Component Analysis, Support Vector Machine.
Introduction
Diabetes is a disease caused by the pancreas failing to produce insulin or when the body cannot effectively process this hormone. Despite an increasing amount of information about the disease, traditional data analysis approaches have become ineficient, and automated methods for eficient extraction of information are essential for diagnosis. It has been suggested that applying machine learning to medical analysis may increase diagnostic accuracy and reduce costs and human resources (Kayaer and Yildirim, 2003).
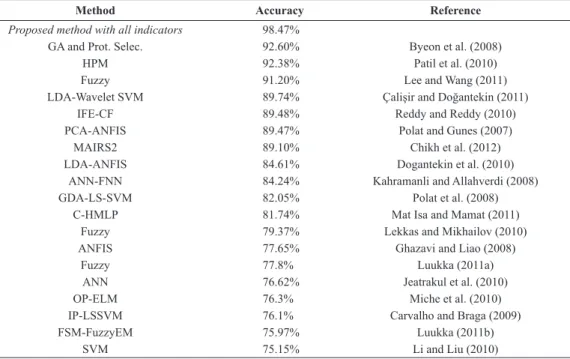
Many studies have contributed to the improvement of the classiication of diabetes by using the Pima Indian database, as is shown in Table 1. For example, Byeon et al. (2008) used genetic algorithms (GAs) and prototyped selection methods with an accuracy rate of 92.60%, which to the best of our knowledge achieves the best performance to date. Patil et al. (2010) used a hybrid prediction model with an accuracy rate of 92.38%. Lee and Wang (2011) used a fuzzy expert system with an accuracy rate of 91.20%, and Polat and Güneş (2007) used principal component analysis (PCA) with an adaptive neuro fuzzy inference system with an accuracy rate of 89.47%. The proposed method adopts the basic idea of Byeon et al., which removes redundancy in a database by means of GAs.
Table 1 also presents other relevant studies, and the general conclusion is that the automatic classiication of diabetes, at least for a homogeneous population,
can be performed with high accuracy. However, some features are invasive and preclude the general triage of diabetes. Moreover, there is room for improvement, which can result in more conidence in machine learning techniques.
simpliies the design of classiiers. In this paper, we propose an information theoretic approach for feature extraction. The proposed method uses higher order statistical information about the collected data in order to provide a projection space, which, in contrast to PCA, preserves better the information contained in the data cloud. Our method uses independent component analysis (ICA) decomposition. ICA uses higher-order statistical information about input data; thus, it has the potential to improve the separability of classes in the projected space, thus improving the performance of the One-class support vector machines used here (Costa et al., 2011; Lucena et al., 2011; Sample et al., 2005; Smith and Lewicki, 2006).
Methods
Computer Aided Diagnosis (CAD) techniques may assist in diabetes treatment by preventing complications of the disease. Consequently, they reduce social and economic costs, because diabetes has a decade long asymptomatic phase which, if not diagnosed early, can cause complications (Silva et al., 2014). Therefore, we propose a CAD method with a methodology that can be summarized in the block diagram in Figure 1. The input data (1) are subjected to a feature extraction process (2) to create a new representation of the original data with minimum redundancy. The new representation, according to the extraction based on eficient coding, is the input for the one-class SVM
classiier (3) that clusters the two classes. To model eficient coding, three algorithms which are already well tested in the literature were used to ind a better way to represent the data: JADE, INFOMAX, and FastICA. In the following sections we will describe the methods used here.
Minimizing statistical dependency with eficient coding
Sensory processing studies have suggested that neural processes may deal with information by using the eficient coding strategy (Baddeley et al., 1997; Barros and Chichocki, 2002; Deweese et al., 2003; Doi et al., 2003; Hubel and Wiesel, 1962; Simoncelli and Olshausen, 2001). The fundamental assumption here is that data x colected by sensors is an unknown
linear instantaneous mixture of unknown independent external stimulus s mixed by an unknown matrix A (i.e., A are the underlying “causes” of the observed
characteristics) that were important in the formation of the observed data x.
Table 1. List of works-related the experiment with all indicators. In these works were used all clinical indicators of the PIMA database (invasive and non-invasive indicators).
Method Accuracy Reference
Proposed method with all indicators 98.47%
GA and Prot. Selec. 92.60% Byeon et al. (2008)
HPM 92.38% Patil et al. (2010)
Fuzzy 91.20% Lee and Wang (2011)
LDA-Wavelet SVM 89.74% Çalişir and Doğantekin (2011)
IFE-CF 89.48% Reddy and Reddy (2010)
PCA-ANFIS 89.47% Polat and Gunes (2007)
MAIRS2 89.10% Chikh et al. (2012)
LDA-ANFIS 84.61% Dogantekin et al. (2010)
ANN-FNN 84.24% Kahramanli and Allahverdi (2008)
GDA-LS-SVM 82.05% Polat et al. (2008)
C-HMLP 81.74% Mat Isa and Mamat (2011)
Fuzzy 79.37% Lekkas and Mikhailov (2010)
ANFIS 77.65% Ghazavi and Liao (2008)
Fuzzy 77.8% Luukka (2011a)
ANN 76.62% Jeatrakul et al. (2010)
OP-ELM 76.3% Miche et al. (2010)
IP-LSSVM 76.1% Carvalho and Braga (2009)
FSM-FuzzyEM 75.97% Luukka (2011b)
SVM 75.15% Li and Liu (2010)
The idea behind eficient coding is that the collected data is a combination of causes or basisfunctions
that, in turn, produce the observations. Because the combined data usually becomes more redundant, the goal is to undo this increase in statistical dependence by performing ICA on the collected data. Although the space might be composed of nonorthogonal basis functions belonging to A, the projections s are
statistically independent. This is where ICA appeals
to eficient coding. Here, let x = (x1,x2,x3,...,xn)be a set of observations taken from the same data. Using
x=As as training input, ICA learns the basis functions
in the columns of a matrix A for the features such
that the variables comprising vector s are mutually
statistically independent (Hyvärinen and Oja, 2000; Comon, 1994).
There are several ways to estimate the matrix,
W where W=A-1 from the projection phase s=A-1x, and each method involves different algorithms. We have used three of the most used algorithms in our tests. These algorithms are reviewed in the following sections.
FastICA algorithm
The FastICA is a computationally eficient and well-tested algorithm. We assume that vector x is whitened by PCA, which is typical in ICA literature (Hyvärinen et al., 2001). The weight vector W is updated such that the projection y=WQT x maximizes the distance of the pdf (probability density function)
to a Gaussian, where Q is the whitening matrix.
This distance is measured by the negentropy J(y))
(Hyvärinen et al., 2001), which is expressed as follows.
( )
{
( )}
{
( )}
2J y ∝E G y −E G v
(1)
Here, v is a zero mean Gaussian variable with unit
variance and G is some nonquadratic function. We
must run the FastICA algorithm repeatedly (i.e., up to the dimensionality of the collected data) to estimate the desired number of independent components.
Jade algorithm
The joint approximation diagonalization of eigen matrices (JADE) algorithm (Cardoso and Souloumiac, 1993) takes the cumulant to ind the mixing matrix. First, the whitening matrix Q and signal z = Qx are estimated. Next, the cumulants of the whitened mixtures Qz are computed. An estimate of the unitary
matrix U is obtained by maximizing the criteria
λzVi by means of joint diagonalization. If λzVi is not exactly jointly diagonalizable, the maximization of the criteria deines a joint approximate diagonalization. An orthogonal contrast is optimized by inding the
rotation matrix U such that the cumulant matrices are as diagonal as possible.
arg min ( Tˆz ),
i
U= ∑Off U Q U
(2)
The mixing matrix A is calculated as A = UQ-1, and the independent components are estimated as
y = Wx = VTz, where W = UT Q.
Infomax algorithm
The algorithm proposed by Amari et al. (1996) takes mutual information I (X;Y), which is minimized
using the natural gradient technique, thus maximizing the independence between components. Mutual information is given by
( , ) ( ) ( | ),
I X Y =H X −H X Y
(3)
where H (X | Y) is the conditional entropy and H (X) is the entropy of X. The conditional entropy is
given by H (X;Y) = H (X,Y) - H (Y). Kullback–Leiber
(KL) divergence can also be used to the same end. The KL divergence minimization uses an algorithm to estimate the separation matrix
( )1 ( ) ( ) ( )
T t
t t t
W + =W + η I−g y y W
(4)
where t represents a given approximation step and g(.) is a nonlinearity selected according to the output
signals, i.e., generally, it is used for super-Gaussian distributions g (y) = tanh (y) and for sub-Gaussian
distribution cases g (y) = y - tanh (y).
One-class Support Vector Machines
A one-class SVM constructs a classiier from only a set of labeled positive patterns called positive training samples (Burges, 1998; Manevitz and Yousef, 2001). The one-class SVM strategy maps data into the feature space and then uses a hypersphere to describe the data. Therefore, this method requires information from a single class, and imbalanced datasets can be used without performance issues (Tran et al., 2003).
The process begins with a training set of points and assumes that a dataset has a probability distribution
P in the feature space. Here, the goal is to ind a subset S of the feature space such that the probability of a
point P outside S is determined by an a prior condition
speciied by Equation 5.
( )0,1 ,
v∈
(5)
The solution to this problem is obtained by the estimation of a function f, which is positive in S and negative in the complement S. Schölkopf et al. (2001)
developed an algorithm that returns a function f. This
function takes values of +1 in a small region, i.e., the hypersphere, by capturing the largest number of data and takes values of -1 everywhere else.
( ) 1
1
if x S f x
if x S
+ ∈
= − ∈
(6)
The algorithm can be summarized as a mapping of data into a feature space H by using an appropriate
kernel function. The algorithm then attempts to separate data mapped from the source to a maximum margin.
In our context, we have training samples
x1, x2, ..., xl that belong to class X, where X is a small subset of RN. Here, let Φ: X → H be the kernel that transforms the training samples to another space. Thus, to separate the set of source data, the following objective function in the primary form is minimized:
2
min i i l r
vl − ρ + ∑ζ
subject to
( ) 2 2
[ ]
||Φ xi − ≤ + ζ ζ ≥c r , i i 0 to i∈l
where v∈ [0,1] represents the total number of training samples, r is an orthogonal array that separates the
training samples from the source to a threshold
ρ, l is the part of the training data rejected by the
hypersphere, and Φ is used to reject the hypersphere training samples.
This optimization problem is solved with Lagrange multipliers. (Scholkopf and Smola, 2002).
( ) 2 ( ) 2 2
1
, , , , l i i i i
L r c r x c r
=
ζ α β = + α Φ∑ − − − ζ
1 1
l l
i i i
i i
l
vl = =
+ ∑ζ − β ζ∑
2 (1 i) 0 i 1,
L r r
∂ = − α = ⇒ α =∑ ∑
∂
(7)
0 0 ,
i i i
i
L l l
vl vl
∂ = − α − β = ⇒ ≤ α ≤
∂ζ
(8)
( )
2 i( i ) 0
L
x c
c
∂ = −∑ α Φ − =
∂
( ).
i i
c x
⇒ = α Φ∑
(9)
Equations 7 and 8 lay out the rejected hyper hold training samples, and Equation 9 reports c (i.e., the center of the hypersphere), which can be expressed as the linear combination Φ (X) and can be solved in a dual form with the following optimization:
( )
,
min i j ( ,i j) i, i
i j i
K x x x x
α α −
∑ ∑
subject to
0 i , i 1 .
i l vl
≤α ≤ ∑α =
An important family of kernels is the radial basis function (RBF) used in the proposed method. The RBF is very commonly used in pattern recognition problems and is deined by
( ) 2
, x y
k x y =e−γ −
(10)
where γ > 0 is a user-deined bandwidth parameter (Scholkopf and Smola, 2002).
To evaluate classiier performance, it is necessary to quantify its sensitivity, speciicity, and accuracy. In the diabetic classiication problem, sensitivity measures the accuracy of the classiier to identify diabetics in the population, and speciicity measures the accuracy of the classiiers to identify healthy people in the population. The validation is done using the following quantities:
1. True-positive (TP): Diagnosis of patients correctly classiied as diabetic. 2. False-positive (FP): Diagnosis of nondiabetic
patients classiied as diabetic. 3. True-negative (TN): Diagnosis of patients correctly
classiied as nondiabetic. 4. False-negative (FN) Diagnosis of diabetic patients
classiied as nondiabetic. and the accuracy of the classiier is deined by:
Sensitivity: TP/(TP + FN)
Speciicity: TN/(TN + FP)
Database descriptions
Here, we have used three databases. The irst is the PIMA database (Blake and Merz, 1996), which has the disadvantage of being composed only of Indian females, which reduces the possibility of generalizing the results. To diminish this drawback, we have used two additional databases: a Brazilian database (Brasil, 2014) and an African–American database (Wang, 2014). These databases are composed of both genders, and the Brazilian data includes multiracial population. The PIMA database was obtained from the UCI (University of California, Irvine) repository of machine learning databases (Blake and Merz, 1996). This database was selected from a larger database held by the National Institutes of Diabetes and Digestive and Kidney Diseases. All patients were females aged at least 21 years of Pima Indian heritage.
We labeled the results as ‘0’ or ‘1,’ where ‘1’ is a positive test for diabetes and ‘0’ is a negative test. There were 268 (34.9%) cases in class ‘1’ and 500 (65.1%) cases in class ‘0.’ In addition, there were eight clinical indicators:
1. Number of pregnancies.
2. Plasma glucose concentration determined by a 2-hour oral glucose tolerance test.
3. Diastolic blood pressure (mmHg). 4. Tricep skin fold thickness (mm). 5. 2-hour serum insulin (mu U/ml). 6. Body mass index.
7. Diabetes pedigree function. 8. Age (years).
Data of the Brazilian database (Brazilian Unique Health System) (Brasil, 2014) comprised patients between 12 and 100 years. There were 500 (50%) cases classiied as diabetics and 500 (50%) as nondiabetics. There were 14 noninvasive clinical indicators:
1. Age (years).
2. Systolic blood pressure. 3. Diastolic blood pressure. 4. Hip (cm).
5. Weight (Kg). 6. Height (cm).
7. Family antecedent of diabetes. 8. Tobacco use.
9. Sedentary lifestyle. 10. Overweight. 11. Heart attack. 12. Other coronapathies. 13. Stroke.
14. Amputation.
Clinical indicators 1 to 6 are continuous variables, and indicators 7 to 14 are discrete variables.
The African–American database was obtained from the University of Virginia’s School of Medicine. Data consists of 19 variables on 403 subjects obtained from
a study conducted to understand the prevalence of obesity, diabetes, and other cardiovascular risk factors in central Virginia for African–Americans (Wang, 2014). There were 60 (14.88%) cases classiied as diabetics and 343 (85.11%) as nondiabetics. Seven noninvasive clinical indicators were used in this database:
1. Age.
2. Weight (pounds). 3. Height (inches).
4. First systolic blood pressure (mmHg). 5. First diastolic blood pressure (mmHg). 6. Waist (inches).
7. Hip (inches).
Results
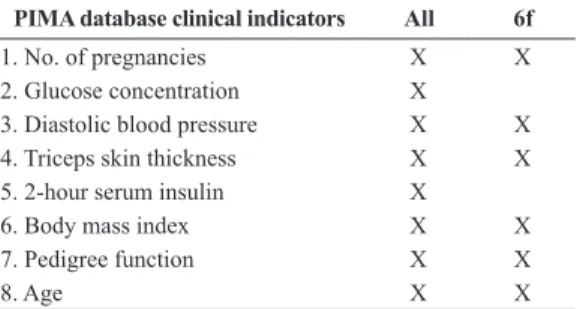
We performed different experiments to test the proposed methodology. For the PIMA database, we used all eight indicators shown in Table 2. Twenty percent of the 268 diabetic cases were used for training data, and the remaining 80% were used for test data, using the 20-fold cross-validation method (in a randomized fashion). For the nondiabetic case, we have used all 500 cases for testing data because it is not necessary to train the one-class SVM for both classes. Clinical indicators can be divided into two groups, invasive or noninvasive. In this case, indicators 1, 3, 4, 6, 7, and 8 are noninvasive indicators, and indicators 2 and 5 are invasive. We applied ICA decomposition on the full set using the FastICA algorithm and obtained matrix
A
with eight basis functions. Then, we projected the samples on the basis functions. These projections were input to the one-class SVM. A library for SVM development (i.e., LIBSVM (Chang and Lin, 2003)) was used for training and testing. The Gaussian gamma value was set at 0.00781 which was determined by cross-validation (cost value of 0.03125).
To illustrate the clustering, although we have eight features, we show the results after PCA processing in Figure 2a, for three features. In Figure 2b we plot three diferent features taken from the ICA output.
Table 2. The PIMA database indicators used in experiments (All = all
features, 6f = noninvasive features).
PIMA database clinical indicators All 6f
1. No. of pregnancies X X
2. Glucose concentration X
3. Diastolic blood pressure X X
4. Triceps skin thickness X X
5. 2-hour serum insulin X
6. Body mass index X X
7. Pedigree function X X
Last, we show in Figure 2c three features found by SVM. In this later case, it is important to remember that the data was preprocessed by PCA and ICA.
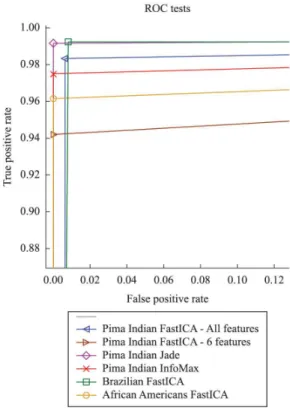
In the next experiment, the same process was applied to estimate the feature space by using ICA algorithms; however, we withdrew the invasive indicators (blood tests). The PIMA database indicators used in experiments are shown in Table 2. Moreover, six basis functions were selected to make the projection and create the input for the one-class SVM classiier, as shown in Tables 2 and 3. In addition, the Receiver
operating characteristic (ROC) curves and results for
the three ICA algorithms tests (FastICA, JADE and INFOMAX) without invasive indicators are shown in Figure 3 and Table 3, respectively.
To explore the generalization of the proposed methodology the Brazilian and African–American databases were tested. In this case, for each data base, considering only the noninvasive indicators during feature extraction phase, the FastICA algorithm was used. The results are shown in Table 4.
Discussion
In this paper, we presented the use of an eficient coding technique to select features to classify patients as diabetic or nondiabetic. We used a framework based on three steps consisting of applying a PCA algorithm to whiten the data, followed by an ICA algorithm, which are both based on linear operations. We then applied a one class SVM classiier as can be observed clearly in Figure 2. Figure 2a shows that PCA could not cluster data appropriately. Figure 2b shows that ICA
could group data more eficiently. However, we could only completely cluster data shown in Figure 2c after the SVM classiier. This can be understood in the following way. Let us irstly remember that we have two steps: the ICA training and the SVM classiier. We estimate the ICA basis functions either using the original diabetic or the non-diabetic database. It is important to emphasize that, while estimating the ICA basis functions, the original data is centered at zero (zero mean). Afterwards, we project the ICA decomposed data on the basis functions again to avoid the known scale and ordering indeterminancies. This leads to results shown in Figure 2c, where we can clearly see two well separated clusters. This occurs because each class in this data set happens to have its own mean that was found by the ICA preprocessing.
Note that other methods reported in the literature also used the same PIMA database. These methods included all data, i.e., both noninvasive and invasive clinical indings, as can be seen in irst row of Table 3 and in Table 1. Our proposed method achieved an accuracy of 98.47%, but the others methods achieved lower accuracy. In addition, we conducted experiments without invasive data, such as insulin and glucose concentration. In this framework, we obtained an accuracy rate of 98.28% with the FastICA algorithm, as show in second row of Table 3. This indicates that even without invasive characteristics that are decisive in diabetes diagnosis, we can maintain very high classiication accuracy, although slightly lower. The same trend is observed with other ICA algorithms; we obtained an accuracy of 99.57% with the JADE algorithm and 99.37% with the InfoMAX, see the third and fourth row of Table 3, respectively. To determine the consistency of this inding, we applied the proposed technique to two other databases, i.e., Brazilian and African–American databases, as is shown in Table 4. Equivalent results to those of the PIMA database were found, as is shown in Table 3 and Table 4. Although we obtained similar accuracy when
Figure 3. ROC curves for different algorithms (FastICA, InfoMax, and Jade) and different databases.
Table 3. Results of ICA algorithms followed by one-class SVM using the features described in Table 2 (PIMA database). For noninvasive use (6f) an extraction was made with the three ICA algorithms most commonly used in the literature, the results are described herein.
Sensitivity Speciicity Accuracy 95% Conidence Level
All (FastICA) 99.81% 98.34% 98.47% 0.22
6 f (FastICA) 99.05% 98.19% 98.28% 0.39
6 f (JADE) 99.92% 99.51% 99.57% 0.32
6 f (InfoMAX) 99.46% 99.35% 99.37% 0.27
Table 4. Test results of FastICA algorithm and one-class SVM for Brazilian data (12 features) and African-American data (ive features).
Database Sensitivity Speciicity Accuracy 95%Conidence Level
Brazilian 99.99% 99.63% 99.81% 0.13
we removed features, Figure 3 shows that we obtained smaller values for the true positive rate when we used only six features.
One question that might arise is why does the use of eficient coding yield higher accuracy than PCA or other methods (Table 1). The eficient coding strategy inds a projection space that, in contrast to the space found by PCA, projects the data cloud in a way that it achieves as close as possible mutual statistically independent across dimensions. The characteristics of diabetics and non-diabetics happened to have different class means in the new space, which improved the cluster separation that was exploited by the classiier.
The contributions of this paper can be described as follows: 1) A method was proposed to increase performance in classifying diabetic and non-diabetics in relation to other studies in literature, as can be seen in Table 1. 2) New tests using exclusively non-invasive features were conducted, and similar results were achieved when using all the features (invasive and non-invasive) (see Table 3). This is signiicant because it increases the possibility of tracking the disease in remote areas, at low cost and in a reliable manner, because without the invasive features (which are obtained through procedures with considerable costs for screening, for example), data can be collected with simple devices. 3) The generalization of the method in relation to diabetes was also tested on two new databases, of African–Americans and Brazilians, the latter of which had not been used in any other study of this kind in literature. The indings from these new tests are similar to those from other tests using the PIMA database (see Table 4).
Eficient coding was the key to simplify the processing complexity of the original features in a new simple and robust representation. This new space can be seen as a representation of what independently describes diabetics and non-diabetics, because the new representation is concise and non-redundant.
References
Amari S, Cichocki A, Yang HH. A new learning algorithm for blind signal separation. In: Mozer MC, Jordan MI, Petsche T, editors. Advances in Neural Information Processing Systems 9 (NIPS 1996). Cambridge: MITPress; 1996. p. 757-63. Baddeley R, Abbott LF, Booth MC, Sengpiel F, Freeman T, Wakeman EA, Rolls ET. Responses of neurons in primary and inferior temporal visual cortices to natural scenes. Proceedings of the Royal Society of London. Series B, Biological Sciences 1997; 264(1389):1775-83. http://dx.doi. org/10.1098/rspb.1997.0246. PMid:9447735
Barros AK, Chichocki A. Neural coding by redundancy reduction and correlation. In: Proceedings of the VII Brazilian
Symposium on Neural Networks; 2002 Oct 26-30, Salvador, Bahia: SBRN-IEEE. 2002. p. 223-6.
Bennet KP, Campbell C. Support vector machines: hype or hallelujah? ACM SIGKDD Explorations Newsletter. 2000; 2(2):1-13. http://dx.doi.org/10.1145/380995.380999. Blake CL, Merz CJ. UCI repository of machine learning databases [Internet]. 1996 [cited 2010 Aug]. Available from: http: //www.ics.uci.e.,du/~mlearn/MLRepository.html. Brasil. Ministério da Saúde. Departamento de Informática do SUS – DATASUS. SISHiperdia [Internet]. 2014. [cited 2014 Dec]. Available from: http://hiperdia.datasus.gov.br/. Burges CJC. A tutorial on support vector machines for pattern recognition. Data Mining and Knowledge Discovery 1998; 2(2):121-67. http://dx.doi.org/10.1023/A:1009715923555. Byeon B, Rasheed K, Doshi P. Enhancing the quality of noisy training data using a genetic algorithm and prototype selection. In: Proceedings of the 2008 International Conference on Artificial Intelligence; 2008 July 14-17, Las Vegas, Nevada. 2008. p. 821-7.
Çalişir D, Doğantekin E. An automatic diabetes diagnosis system based on LDA wavelet support vector machine classifier. Expert Systems with Applications 2011; 38(7):8311-5. http://dx.doi.org/10.1016/j.eswa.2011.01.017.
Cardoso JF, Souloumiac A. Blind beamforming for nongaussian signals. IEE Proceedings. Part F. Radar and Signal Processing 1993; 140(6):362-70. http://dx.doi. org/10.1049/ip-f-2.1993.0054.
Carvalho BPRD, Braga AP. IP-LSSVM: A two-step sparse classifier. Pattern Recognition Letters 2009; 30(16):1507-15. http://dx.doi.org/10.1016/j.patrec.2009.07.022.
Chang CC, Lin CJ. LIBSVM — A Library for Support Vector Machines [Internet]. 2003. [cited 2008 Jan]. Available from: http://www.csie.ntu.edu.tw/cjlin/libsvm/.
Chikh MA, Saidi M, Settouti N. Diagnosis of diabetes diseases using an Artificial Immune Recognition System2 (AIRS2) with fuzzy K-nearest neighbor. Journal of Medical Systems 2012; 36(5):2721-9. http://dx.doi.org/10.1007/ s10916-011-9748-4. PMid:21695498
Comon P. Independent component analysis, a new concept? Signal Processing 1994; 36(3):287-314. http://dx.doi. org/10.1016/0165-1684(94)90029-9.
Costa DD, Campos LF, Barros AK. Classification of breast tissue in mammograms using efficient coding. Biomedical Engineering Online 2011; 10(55):2-14. http://dx.doi. org/10.1186/1475-925X-10-55. PMid:21702953 DeWeese MR, Wehr M, Zador AM. Binary spiking in auditory cortex. The Journal of Neuroscience 2003; 23(21):7940-9. PMid:12944525.
Dogantekin E, Dogantekin A, Avci D, Avci L. An intelligent diagnosis system for diabetes on linear discriminant analysis and adaptive network based fuzzy inference system: LDA-ANFIS. Digital Signal Processing 2010; 20(4):1248-55. http://dx.doi.org/10.1016/j.dsp.2009.10.021.
information-theoretic analyses of cone mosaic responses to natural scenes. Neural Computation 2003; 15(2):397-417. http://dx.doi.org/10.1162/089976603762552960. PMid:12590812
Ghazavi SN, Liao TW. Medical data mining by fuzzy modeling with selected features. Artificial Intelligence in Medicine 2008; 43(3):195-206. http://dx.doi.org/10.1016/j. artmed.2008.04.004. PMid:18534831
Hild KE 2nd, Erdogmus D, Torkkola K, Principe JC. Feature extraction using information-theoretic learning. IEEE Transactions on Pattern Analysis and Machine Intelligence 2006; 28(9):1385-92. http://dx.doi.org/10.1109/ TPAMI.2006.186. PMid:16929726
Hubel DH, Wiesel TN. Receptive fields, binocular interaction and functional architecture in the cat’s visual cortex. The Journal of Physiology 1962; 160(1):106-54. http://dx.doi. org/10.1113/jphysiol.1962.sp006837. PMid:14449617 Hyvärinen A, Karhunen J, Oja E. Independent component analysis. John Wiley and Sons: 2001.. http://dx.doi. org/10.1002/0471221317.
Hyvärinen A, Oja E. Independent component analysis: algorithms and applications. Neural Networks 2000; 13(4-5):411-30. http://dx.doi.org/10.1016/S0893-6080(00)00026-5. PMid:10946390
Jeatrakul P, Wong KW, Fung CC. Data cleaning for classification using misclassification analysis. Journal of Advanced Computational Intelligence and Intelligent Informatics. 2010; 14(3):297-302.
Kahramanli H, Allahverdi N. Design of a hybrid system for the diabetes and heart diseases. Expert Systems with Applications 2008; 35(1-2):82-9. http://dx.doi.org/10.1016/j. eswa.2007.06.004.
Kayaer K, Yildirim T. Medical diagnosis on Pima Indian diabetes using general regression neural networks. In: Proceedings of Joint International Conference ICANN/ ICONIP; 2003 June 26-29; Istanbul, Turkey. Springer; 2003. p.181-4.
Kung SY. Digital neural networks. 1th ed. Englewood Cliffs: Prentice Hall; 1993.
Lee C-S, Wang M-H. A fuzzy expert system for diabetes decision support application. IEEE Transactions on Man and Cybernetics, Part B. 2011; 41(1):139-53. http://dx.doi. org/10.1109/TSMCB.2010.2048899.
Lekkas S, Mikhailov L. Evolving fuzzy medical diagnosis of Pima Indians diabetes and of dermatological diseases. Artificial Intelligence in Medicine 2010; 50(2):117-26. http:// dx.doi.org/10.1016/j.artmed.2010.05.007. PMid:20566274 Li D, Liu C. A class possibility based kernel to increase classification accuracy for small data sets using support vector machines. Expert Systems with Applications 2010; 37(4):3104-10. http://dx.doi.org/10.1016/j.eswa.2009.09.019. Lucena F, Barros AK, Príncipe JC, Ohnishi N. Statistical coding and decoding of heartbeat intervals. PLoS ONE 2011; 6(6):e20227. http://dx.doi.org/10.1371/journal. pone.0020227. PMid:21694763
Luukka P. Feature selection using fuzzy entropy measures with similarity classifier. Expert Systems with Applications 2011a; 38(4):4600-7. http://dx.doi.org/10.1016/j.eswa.2010.09.133. Luukka P. Fuzzy beans in classification. Expert Systems with Applications 2011b; 38(5):4798-801. http://dx.doi. org/10.1016/j.eswa.2010.09.167.
Manevitz L, Yousef M. One-class SVMs for document classification. Journal of Machine Learning Research 2001; 2(2):139-54.
Mat Isa NA, Mamat WMFW. Clustered-hybrid multilayer perceptron network for pattern recognition application. Applied Soft Computing 2011; 11(1):1457-66. http://dx.doi. org/10.1016/j.asoc.2010.04.017.
Miche Y, Sorjamaa A, Bas P, Simula O, Jutten C, Lendasse A. OP-ELM: optimally pruned extreme learning machine. IEEE Transactions on Neural Networks 2010; 21(1):158-62. http:// dx.doi.org/10.1109/TNN.2009.2036259. PMid:20007026 Patil BM, Joshi RC, Toshniwal D. Hybrid prediction model for type-2 diabetic patients. Expert Systems with Applications 2010; 37(12):8102-8. http://dx.doi.org/10.1016/j. eswa.2010.05.078.
Polat K, Gunes S, Arslan A. A cascade learning system for classification of diabetes disease: generalized discriminant analysis and least square support vector machine. Expert Systems with Applications 2008; 34(1):482-7. http://dx.doi. org/10.1016/j.eswa.2006.09.012.
Polat K, Güneş S. An expert system approach based on principal component analysis and adaptive neuro-fuzzy inference system to diagnosis of diabetes disease. Digital Signal Processing 2007; 17(4):702-10. http://dx.doi. org/10.1016/j.dsp.2006.09.005.
Reddy MB, Reddy LSS. Dimensionality reduction: an empirical study on the usability of IFECF (independent feature elimination- by c-correlation and f- correlation) measures. International Journal of Computer Science. 2010; 7(1):74-81.
Sample PA, Boden C, Zhang Z, Pascual J, Lee TW, Zangwill LM, Weinreb RN, Crowston JG, Hoffmann EM, Medeiros FA, Sejnowski T, Goldbaum M. Unsupervised machine learning with independent component analysis to identify areas of progression in glaucomatous visual fields. Investigative Ophthalmology & Visual Science 2005; 46(10):3684-92. http://dx.doi.org/10.1167/iovs.04-1168. PMid:16186350 Schölkopf B, Platt JC, Shawe-Taylor J, Smola AJ, Williamson RC. Estimating the support of a high-dimensional distribution. Neural Computation 2001; 13(7):1443-71. http://dx.doi. org/10.1162/089976601750264965. PMid:11440593 Scholkopf B, Smola AJ. Learning with kernels: support vector machines, regularization, optimization, and beyond. Cambridge: MITPress; 2002.
Silva RN, Ferreira ACBH, Ferreira DD, Barbosa BHG. Non-invasive method to analyse the risk of developing diabetic foot. Healthcare Technology Letters. 2014; 1(4):109-13. http://dx.doi.org/10.1049/htl.2014.0076.
2001; 24(1):1193-216. http://dx.doi.org/10.1146/annurev. neuro.24.1.1193. PMid:11520932
Smith EC, Lewicki MS. Efficient auditory coding. Nature 2006; 439(7079):978-82. http://dx.doi.org/10.1038/ nature04485. PMid:16495999
Tran Q, Zhang Q, Li X. Evolving training model method for one-class SVM systems. In: SMC ‘03 Conference Proceedings – Proceedings of the 2003 IEEE Internation
Conference on Systems, Man and Cybernetics; 2003 Oct 5-8, 2003; Washington. 2003 p. 2388-93.
Wang L. Datasets [Internet]. Vanderbilt University; 2014 [cited July 2014]. Available from: http://biostat.mc.vanderbilt. edu/wiki/Main/DataSets?CGISESSID=10713f6d891653d dcbb7ddbdd9cffb79.
Zhuang L, Dai H. Parameter optimization of kernel-based one-class one-classifier on imbalance learning. Journal of Computers 2006; 1(7):32-40. http://dx.doi.org/10.4304/jcp.1.7.32-40.
Authors
Áurea Celeste Ribeiro1,2*, Allan Kardec Barros2, Ewaldo Santana1,2, José Carlos Príncipe3
1Programa de Pós-Graduação em Engenharia de Computação e Sistemas, Universidade Estadual do Maranhão – UEMA,
Cidade Universitária Paulo VI, Caixa Postal 09, CEP 65055-310, São Luís, MA, Brazil
2Laboratório de Processamento da Informação Biológica, Universidade Federal do Maranhão – UFMA,
Campus Bacanga, Av. dos Portugueses, s/n, CEP 65080-805, São Luís, MA, Brazil
3Computational NeuroEngineering Laboratory, University of Florida, EB451 Engineering Building,