ISSN 0104-6632 Printed in Brazil
www.abeq.org.br/bjche
Vol. 22, No. 02, pp. 263 - 270, April - June, 2005
Brazilian Journal
of Chemical
Engineering
A STUDY OF THE FLUID DYNAMICS OF THE
SPOUTED BED USING CFD
C. R. Duarte, V. V. Murata and M. A. S. Barrozo
*School of Chemical Engineering, Federal University of Uberlândia, PhoneFax: +(55) (34) 3239-4292, Building K, Campus Santa Mônica,
PO Box 593, 38400-902, Uberlândia - MG, Brazil. E-mail: [email protected]
(Received: October 20, 2004 ; Accepted: February 16, 2005)
Abstract - The spouted bed has been used in drying, granulation, catalytic polymerization, residue treatment and coating of several materials. Its success is attributed to its solids circulation characteristics and excellent gas-particle contact. In this work the pattern of solids and gas flows in a spouted bed was numerically simulated using a Eulerian multiphase model. The computational work was significantly reduced for axisymmetric gas-solids flows. The simulated velocity and voidage profiles were compared with results obtained in our laboratory (with a two-dimensional spouted bed using soybean seed) and by He et al. (1994) (with a cylindrical spouted bed and glass sphere). The simulated results showed good agreement with the experimental data for both geometries studied.
Keywords: Spouted bed, Computational fluid dynamics; Fluent.
INTRODUCTION
Spouted beds are gas-solids granular contactors appropriate for a large variety of chemical engineering and mining operations that deal with the handling of heavy, coarse, sticky and/or irregularly shaped solids through cyclic flow patterns. Besides the conventional areas of physical transformations, such as coating, drying and granulation (Mathur and Epstein, 1974), they have also been used in chemical transformations such as coal gasification and catalytic polymerization. Spouted beds are divided into three different regions each with its own specific flow behavior: the annulus, the spout and the top (Mathur and Epstein, 1974). The mechanisms of solids movement in spouted beds are still not completely understood.
Knowledge of the solids flow pattern in spouted beds is of great interest in their design because the particle trajectories must meet the requirements of the process being carried out. Because of the large number of particles, it is difficult to observe particle
motion in the gas-solid phase, which flows continuously in spouted beds.
Measurement of particle and gas flow through insertion of probes throughout the phases is also subject to error due to the perturbations caused by the probes.
He et al. (1994) used a fiber optic probe system to obtain the profiles for vertical particle velocities in the spout, annular and fountain regions of a full-column spouted bed. Roy et al. (1994) measured the particle velocities in a spouted bed using a γ -ray-emitting particle tracking technique. Benkrid and Caram (1989) used a fiber optic technique to measure particle velocities in the annulus of a full column and concluded that there is a plug flow zone in the upper part of the annulus. Except in the bottom region, there was no entrainment across the interface of the spout. Each of these techniques has inherent limitations.
Voidage in the annulus of spouted beds is usually assumed to be constant and the same as the loosely packed voidage of particulate material (Mathur and Gishler, 1955 and Mathur et al. 1974). On the other hand, recent studies have shown slight differences in voidage in different parts of the annulus.
The numerical simulation technique and computational fluid dynamics (CFD) studies have become popular in the field of gas-solid two-phase flow. Numerical simulation is a useful tool to obtain detailed information about flow phenomena without disturbing them. As examples of these studies can be mentioned fluidized beds and spouted beds. However, almost all calculations have been based on the two-dimensional approach, mainly due to excessive computational time. But it is important to validate the applicability of the numerical three-dimensional flow models by comparing the numerical results to the corresponding experiments.
In this work, the Eulerian multiphase model, which treats gas and particle flows as continua that interact, has been used. This approach minimizes the computational cost, mainly for flows with a high concentration of particle, and also considers the effects of interaction between the two phases. Since the volume of one phase cannot be occupied by the other, the concept of phase volume fraction is introduced. These volume fractions are assumed to be continuous functions of space and time and their sum is equal to one.
This multiphase model is solved in the Fluent 6.1.18 CFD code and comprises a set of n (total number of equations) momentum and continuity equations for each phase. The coupling between phases is achieved through the pressure and interphase exchange coefficients.
Axisymmetric flows are often assumed in several applications. When these flows are treated we can reduce the computational load by assuming axisymmetry in the basic equations in this work the spouted bed was modeled on the assumption of axisymmetric flows.
This model, which assumes axisymmetric flows and was applied to two different spouted bed geometries: a cylindrical vessel with a tapered bottom and a two-dimensional spouted bed. The simulated results on particle velocity and profile for voidage in the spout and the annular regions obtained for the cylindrical spouted bed were compared with the experimental results obtained by He et al. (1994). The simulated results on particle velocity and fountain height in the two-dimensional spouted bed were compared with experimental results obtained in the laboratory.
DESCRIPTON OF THE MODEL
The Eulerian approach is used for each phase, taking into account all possible intra and interphase combinations. The phases considered are gas and solid. The Eulerian multiphase model allows modelling of the multiple separate, yet interacting phases. The conservation equations can be derived by ensemble averaging the local instantaneous balance for each phase.
The volume fraction of fluid phase αf is calculated from the continuity equation:
( )
f .( fv )f 0t
∂ α + ∇ α = ∂
r
(1)
where
v
fr
is the velocity of fluid phase f. The volume of phase f, Vf, is defined by
f f
V
V = α
∫
d V (2)The solution of equation (1) for the fluid phase, along with the condition that the volume fractions add up to one, allows calculation of the solids-phase volume fraction. This treatment is common for fluid-fluid and granular flows.
The conservation of the fluid-solids momentum equation is given by
(
s s s)
s s s ss
s s
f s
s s fs
v .( v v )
t
p p .
g K ( v v )
∂ α ρ + ∇ α ρ = ∂
−α ∇ − ∇ + ∇ τ +
+α ρ + −
r r r
r r r
(3) where g ur acceleration gravitational; s
τ
solid-phase stress-strain tensor;s
v
r
velocity of solid phase s;
s
ρ
solids density;Kfs = Ksf momentum exchange coefficient between fluid phase f and solid phase s;
p pressure shared by all phases (fluid and solid); ps solids pressure.
s s d sf
s
f K =α ρ
τ (4)
where
f
d is the drag andT
s, the “particulate relaxation time” given by2 s s s f
d
T
18
ρ
=
µ
(5)where
d
s is the diameter of particles in the solid phase (s) and µf is the fluid viscosity.The definition of
f
d includes a drag function (CD) that is based on the relative Reynolds number (Res), which is given by equation (6).(
s f)
s sf
f
d
v
v
K
=
ρ
−
µ
r
r
(6)
In this work, the Gidaspow et al. model, (1992) which is a combination of the Wen and Yu (1966) and the Ergun (1952) equations, was used.
The fluid-solids exchange coefficient Ksf is of the following form:
for α >f 0.8:
(7)
s f
s f f 2.65
sf D f
s v v 3 K C 4 d −
α α ρ −
= α
r r
where
(
)
0.687D f s
f s
24
C 1 0.15 Re
Re
= + α
α (8)
for α ≤f 0.8:
s f f s
s f f
sf 2
s f s
v v
(1 )
K 150 1.75
d d
ρ α − α − α µ
= +
α
r r
(9)
The solids pressure in equation (3) is obtained with equation (10).
(
)
2ss s s s s ss 0,ss s
p = α ρ Θ + ρ2 1 e+ α g Θ (10) where
0,ss
g :the radial distribution function (Ogawa et al., 1980);
s
Θ
: the granular temperature (Ding and Gidaspow, 1990);ss
e
the coefficient of restitution in this work the terme
ss=
0.9
was used.The radial distribution function,
g , is a
0correction factor that modifies the probability of
collisions between grains when the granular
phase becomes dense. This function may also be
interpreted as the nondimensional distance
between spheres:
s s 0 s D d g D += (11)
where Ds is the distance between grains.
EXPERIMENTAL SETUP AND PROCEDURE
In this work, two different column geometries under different operational conditions were used. The first set of simulations represents the experiments carried out by He et al. (1994) and the second, those obtained in our laboratory.
Conditions of He et al. (1994)
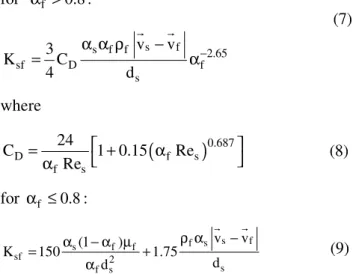
The operational conditions used by He et al.
(1994) are shown in Table 1 and the spouted-bed vessel geometry in Figure 1.
Conditions for the Two-Dimensional Spouted Bed
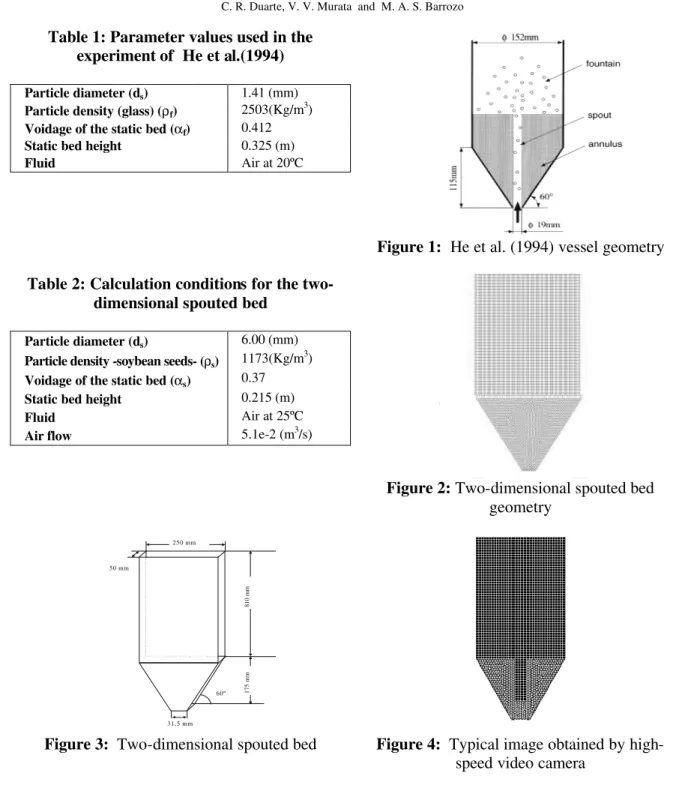
The column geometry used during experiments
carried out in our laboratory can be seen in Figure
2 this equipment is a two-dimensional spouted bed
made of acrylic. The experimental conditions used
in this two-dimensional spouted bed are
summarized in Table 2.
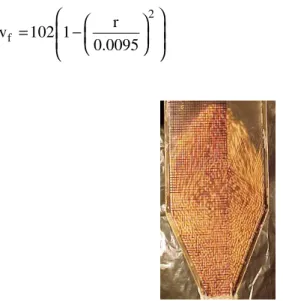
The experimental particle velocity in the annular region as well the fountain was obtained with a high-speed video camera operated at 500 frames per second.
Experimental Method for the Two-Dimensional Spouted Bed
Initially, images of particle movement were recorded using a high-speed video camera (maximum speed of 2000 frames per second). After recording, particle paths were observed and their velocity measured by the distance traveled and the respective number of frames. This procedure was used for several spouted bed positions.
Table 1: Parameter values used in the experiment of He et al.(1994)
Particle diameter (ds) 1.41 (mm)
Particle density (glass) (ρf) 2503(Kg/m 3)
Voidage of the static bed (αf) 0.412
Static bed height 0.325 (m)
Fluid Air at 20ºC
Figure 1: He et al. (1994) vessel geometry
Table 2: Calculation conditions for the two-dimensional spouted bed
Particle diameter (ds) 6.00 (mm)
Particle density -soybean seeds- (ρs) 1173(Kg/m 3
)
Voidage of the static bed (αs) 0.37
Static bed height 0.215 (m)
Fluid Air at 25ºC
Air flow 5.1e-2 (m3/s)
Figure 2: Two-dimensional spouted bed
geometry
175 mm
810 mm
50 mm
31,5 mm 250 mm
60º
Figure 3: Two-dimensional spouted bed Figure 4: Typical image obtained by
high-speed video camera
NUMERICAL SOLUTION OF EQUATIONS
The second-order upwind discretization scheme of momentum and volume fraction and the first-order implicit time discretization were chosen to solve the model equations for both phases. Each discretized governing equation was linearized implicitly and solved using the Gauss-Seidel implicit point linear equation solver in conjunction with an algebraic multigrid method (AMG) to accelerate the convergence. Pressure-velocity coupling was achieved using the SIMPLE algorithm. Typical
values of the underrelaxation factors were from 0.1 to 0.5. The solution was considered convergent when the scaled residuals were less than 1.10-3. The maximum number of iterations per time step was set at 100. The time steps in unsteady simulations varied between 1x10⁻³ and 1x10⁻⁶ seconds, depending on the solution convergence.
Conditions of He et al. (1994)
He et al. (1994) experiments, i.e., 15 cm. The grid used, shown in Figure 5, is comprised of 6862 cells and has a triangular cone base and a hexahedral cylindrical part. The parabolic profile equation used in the inlet fluid flows is
2 f
r v 102 1
0.0095
= −
(12)
where r is the radius of the inlet spouted bed nozzle.
Conditions of the Two-Dimensional Spouted Bed
The grid used in the two-dimensional spouted bed simulation, shown in Figure 6, is comprised of 7352 cells and has a triangular cone base and a hexahedral cylindrical part.
Figure 5: Grid adopted for the spouted bed Figure 6: Grid adopted for the
two-dimensional spouted bed
RESULTS AND DISCUSSION
Cylindrical Spouted Bed with Glass Spheres
The solids volume fraction profile simulated in this work can be seen in Figure 7. This figure allows distinguishing the three different parts of the spout bed: the annulus, the spout and the fountain. In the annulus, the solids volume fraction is practically constant.
The experimental and simulated radial profiles for vertical particle velocity at different heights in the spout are shown in Figures 8 and 9, respectively where z is the height from the bottom of the vessel. The local vertical particle velocity decreases with an increase in radial distance from the spout axis. The same qualitative and quantitative behavior can be observed in Figures 8 and 9 therefore, there is good agreement between the simulated and experimental results.
Radial profiles for voidage in the spout are presented in Figures 10 and 11. Figure 10 represents the experimental results reported by He et al. (1994). Figure 11 represents the corresponding simulated voidage values obtained in this work. It can be seen in these figures that local voidage decreases with an increase in bed height or the radial distance from the spout axis. The same qualitative and quantitative behavior is observed in both figures, proving good
agreement between the simulated and experimental results.
Radial profiles for voidage (αf) in the annulus are presented in Figures 12 and 13. Figure 12 represents the experimental results of He et al. (1994) and Figure 13, the simulated values obtained in this work.
Figure 12 reveals that there is a denser zone in the annulus near the interface between the annulus and spout regions. In this zone, voidage is lower than that in the loosly packed bed. This probably results from the forces acting on the region, such as drag due to the gas cross flow, the weight of particles in the annulus, the shear stress caused by gas and upward-moving particles in the spout and shear stress due to downward-moving particles in the annulus. The results shown in Figures 12 and 13 corroborate the good agreement between the experimental data and the simulated results.
Two-Dimensional Spouted Bed with Soybean Seeds
The solids velocity profile for the two-dimensional spouted bed of soybeans is shown in Figure 14. Figure 15 shows the air volume fraction distribution along the symmetry axis.
downward trajectory in the annulus. The experimental annular mean particle velocity obtained in the laboratory, using the image analysis technique with a high-speed video camera, is -0.2083 (m/s). Therefore, the relative deviation obtained between simulated and experimental values is 11.5%.
Figure 15 indicates that the simulated fountain height is 0.345 m because at this position the air volume fraction reaches a value of one. The experimental value obtained for the fountain height is 0.36 m, so the relative deviation between simulated and experimental values is 4.2%.
Solids Fraction
Figure 7: Solids volume fraction profile
Figure 8: Radial velocity distributions,
experimental results by He et al. (1994)
Figure 9: Radial velocity distributions,
simulated results
Figure 10: Radial voidage distributions.
Experimental results from He et al. (1994)
Figure 11: Simulated radial voidage
Figure 12: Radial voidage distributions, experimental results from He et al. (1994)
Figure 13: Simulated radial voidage
distributions, in the annulus region
Solids Velocity (
m/s
)
symmetr
y axis
Figure 14: Solids velocity profile Figure 15: Air volume fraction profile on the
symmetric axis
CONCLUSIONS
The typical flow pattern of the spouted bed was obtained in the present work through simulation. The calculation was made for the same geometry as that used in the experimental work of He et al. (1994) including a glass sphere and for a two-dimensional spouted bed using soybean seeds operated in our laboratory. The simulated velocity and voidage profiles were obtained using the granular Eulerian multiphase model. The results obtained show good agreement between the simulated and the experimental results.
NOMENCLATURE
D
C
Drag coefficient, defined different ways,dimensionles s
s
d
Particle diameter, mDs Distance between grains, m
d
f
Drag force, Ng
r
Gravitational acceleration,
m/s2
0,ss
g Radial distribution function,
dimensionles s
fs
K
Coefficient of momentum exchange between fluid phase f and solid phases
P Pressure, Pa
s
p
Solids pressure, Par Radius of the inlet spouted bed nozzle,
m
s
Re
Relative Reynolds number,dimensionles s
v Volume, m3
v
r
Velocity vector, m/s
Greek Symbols
dimensionless
µ Dynamic viscosity, cP
s
Θ
Granular temperature, dimensionlessρ Density, kg/m3
τ Stress tensor, Pa
τ
Shear stress, PaSubscript
F Fluid phase (-)
S Solid phase (-)
REFERENCES
Benkrid, A. and Caram, H.S., Solid Flow in the Annular Region of a Spouted Bed, AIChE Journal, Vol. 35, pp. 1328-1336 (1989).
Ding, J. and Gidaspow, D., A Bubbling Fluidization Model Using Kinetic Theory of Granular Flow, AIChE Journal, Vol. 36, pp. 523-538 (1990). Ergun, S., Fluid Flow Through Packed Columns,
Chem. Eng. Prog., Vol. 48(2), pp. 89-94 (1952).
Gidaspow, D., Bezburuah, R. and Ding, J., Hydrodynamics of Circulating Fluidized Beds: Kinetic Theory Approach, Proc. of the 7th Engineering Foundation Conference on Fluidization, pp. 75-82 (1992).
He, Y.L., Qin, S.Z., Lim, C.J. and Grace, J.R., Particle Velocity Profiles and Solid Flow Patterns in Spouted Beds, Can. J. Chem. Eng., Vol. 72, pp. 561-568 (1994).
Mathur, K.B. and Epstein, P.E., Spouted Beds, Academic Press, New York (1974).
Mathur, K.B. and Gishler, P.E., A Technique for Contacting Gases with Coarse Solid Particles, AIChE Journal, Vol. 1, pp. 157-164 (1955). Ogawa, S., Umemura, A. and Oshima, N., On the
Equations of Fully Fluidized Granular Materials, J. Appl. Math. Phys., Vol. 31, p. 483 (1980). Roy, D., Larachi, F., Legros, R. and Chaouki, J., A
Study of Solid Behavior in Spouted Beds using 3D Particle Tracking, Can. J. Chem. Eng., Vol. 72, pp. 945-952 (1994).