Electrical Conductivity in the KDP, ADP, and K
1-x(NH
4)
xH
2PO
4Crystals
Fabrício Mendes Souzaa*
Received: August 17, 2016; Revised: January 03, 2017; Accepted: February 02, 2017
Impedance Spectroscopy was performed to examine the electrical conductivity on KH2PO4 KDP, (NH4)H2PO4 ADP and K1-x(NH4)xH2PO4 (x = 0.076, 0.118, 0.357, 0.857, 0.942) crystals with increasing temperature. They were grown by solvent evaporation method. Zview simulation software was used to
theoretically it electrical conductivity results as a function of frequency (1-106 Hz) and temperature (20-160 ºC) with equivalent circuits. These dielectric-type materials become ionic conductors upon
heating. Proton jumps in hydrogen bonds, heavier ions migration (K+ and NH 4
+), and rotation and
reorientation of ammonium groups contributed to electrical conduction. This conduction behavior
follows the Arrhenius equation with which the activation energies were determined at diferent
temperature ranges. For ADP-rich (x > 0.8) and pure ADP crystals the conductivities are higher than those for KDP-rich (x < 0.2) and pure KDP. Lattice defects may reduce electrical conductivities in the crystals with intermediate x composition. Complex permittivity ac and complex conductivity ac were also obtained for these crystals.
Keywords: mixed crystals, KDP, ADP, electrical conductivity, non-linear optical materials, Impedance Spectroscopy, crystalline defects
* e-mail: [email protected]
1. Introduction
Crystals of ammonium dihydrogen and potassium dihydrogen phosphates, NH4H2PO4 (ADP) and KH2PO4 (KDP), as well as K1-x(NH4)xH2PO4 (KADPx) have been extensively studied, owing to their potential applications in electro-optical units. The areas of laser radiation non-linear transformers and ferroelectricity motivate the examination of these crystals1-4.
KDP and ADP crystallize in the tetragonal system with the same space group. The crystal growth can be performed by
spontaneous nucleation in aqueous solution, in which the
competition between NH4+ and K+ with the H 2PO4
- groups
occurs during the ionic bonding5,6. This competition leads to
the unit cell expansion in the KADPx crystals, owing to the ammonium entrance in a relatively K+ small room. Thus, the
local areas of the crystal frame expand to accept the larger cations (NH4+)6. As a result, structural stress, distortions of
crystal lattice, cracks and defects within the mixed crystal
frame can occur, causing damage in the crystal quality3,7.
These microstructural aspects are related to the HN-O and
K-O bond strengths, as well as, to the diferences of the size
of the cationic radius - NH4+ ion (ionic radius 1.42Å) or K+ ion
(ionic radius 1.33Å) in the mixed crystals. Moreover, there
are diferent amounts of these cations in each mixed crystal
and it is known that distances between (100), (101), (001), (110), and (112) crystalline planes in the ADP crystal are greater than those in the KDP crystal7. When KDP is heated
at higher temperatures, there is a loss of H2O molecules and
the formation of phosphoric acid. On the other hand, ADP lose mass with ammonia formation8,9. The diferences in
the bond strength lead to the intrinsic detachment behaviors of the molecules in each crystal frame, conducting to their decomposition6.
Impedance spectroscopy is largely used in the characterization
of the electrical properties of diferent materials (ordered or disordered solids), dielectrics for instance. This technique
permits the determination of the electric and dielectric
properties of a speciic material, as well as, correlates them with the micro-structural defects, in general, in a frequency
range, f, between 10-4 and 107 Hz. The study of the dependence between electrical conductivity and signal frequency applied
to the material can be done through the dielectric behavior
results by using dielectric permittivity ε*as a function of the
frequency (ω = 2πf), or using the ionic conductor behavior, that expresses the electrical conductivity results, σ*(ω), which
can be expounded as complex impedance results, Z*(ω)10,11.
In this work, ac impedance and dc impedance were used to characterize the electrical conductivity of the crystals
as a function of the frequency and as a function of the
temperature for the 20 ºC - 160 ºC temperature range. The study of the conductivity dependency with composition x, as well as, with temperature, was done through the analysis of the complex impedance data, which has been written in the superposition of the two Cole-Cole expressions that represent the proposed microscopic conduction of the crystals. This relation correlates physical phenomenon to the theoretical
data with equivalent circuits as two R−C parallel in series11.
2. Materials and methods
The KDP (x= 0), ADP (x= 1.0), and KADPx hybrid crystals (x = 0.076, 0.118, 0.357, 0.857 and 0.942) were
grown by evaporation at 40°C from the aqueous solution. Pure deionized water of 18.2 MΩcm was used as the solvent.
Crystals were prepared as little plate shapes in the [100] direction with application of silver ink (electrodes) on the greater surfaces (superior and inferior)6. The electrical
measurements were carried out in the temperature range of 20 ºC - 160 ºC under vacuum. The complex impedance
(Z*) was determined in the frequency range from 1 Hz to
106 Hz with an applied potential of 2 V using an impedance
analyzer Solartron (SI 1260). The molar percentages of x for the mixed crystals were determined by obtaining the potassium amount with Inductively Coupled Plasma - Atomic
Emission Spectrometry ICP-AES technique by using a
Spectro (Ciros CCD) spectrometer. The potassium element amount was obtained in duplicate by using the wave length from the potassium detection. The ammonium amount was obtained by the diminution 1 - x, for the diferent crystals. Hence, KADPx mixed crystals were grown with the molar
quantities6x = 0.076, 0.118, 0.357, 0.857, and 0.942. The
experiments were performed at Universidade Federal de
Ouro Preto (UFOP), MG, Brazil.
3. Results and Discussion
External electric ield action can induce a polarization in the material, and consequently, an electrical current
emerges through the charge conduction. An electrical current
appears in the material under an alternate electric ield with frequency variation, which induces to a phase angle between
the applied voltage and the electric current. Besides, another
out of phase component related to frequency and time delay
of electric dipoles relaxation also appears10,11. Pure KDP and
ADP crystals are dielectrics (non electric conductors) at low temperatures and gradually become ionic conductors as the temperature is increased. Accordingly, physical polarization processes and ionic conduction occur when crystals are heated. Conduction mechanisms have been observed in these
crystals and they happen due to the hopping efect during
the protons migration across hydrogen ions vacancies in the crystalline lattice6,8,9. Some authors reported about three
types of defects, which, in this case, lead to the electric conduction that involves the movement or jump of hydrogen ions between the constituent’s bonds in the crystal bulk. Furthermore, the movement of hydrogen, potassium, and ammonium ions contribute to the increase in the electrical conductivity at higher temperature8,9,12,13.
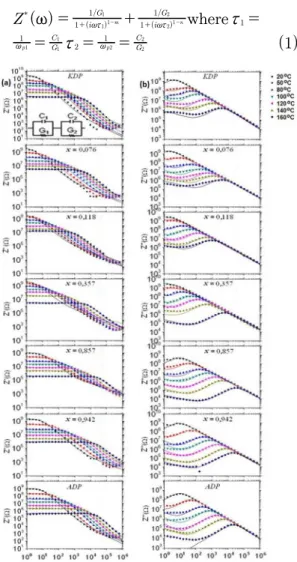
The electrical conductivity results are shown by complex impedance Z* (ω) of the KDP, ADP, and mixed crystals in
Figure 1. This igure shows the graphics of the real impedance
(Z’) and imaginary impedance (Z’’) as a function of frequency
(with a double log scale) for the 20 ºC - 160 ºC temperature
range. The frequency of the relaxation peaks can be interpreted
as two parts one involving the bulk of the samples, which
is the rapid relaxation mechanisms (at higher frequencies), and another one involving the surface efect of electrode,
which represents the slow relaxation mechanisms (at lower
frequencies). Thus, the complex impedance can be written
by two superposition expressions10,11:
( )
( )
where
Z
1
*
( ) /
( ) /
i G
i G
G C
G C
1 1
1 1
1 1
2 1
m n
p p
11 1
21 2
1 1 1
2 2 2
~
x
x
=
+
=
=
=
=
~x ~x
~ ~
+ - +
-Figure 1: Electrical conductivity, as a function of frequency (with a double log scale) on the 20 ºC - 160 ºC temperature range, represented by complex impedance Z* (ω), real impedance (Z’) and imaginary impedance (Z’’), for the KDP, ADP, and mixed crystals.
where the ωp1 and ωp2 are the intrinsic angular frequencies of the maximum points on the Z’’ curves and τ1 and τ2 the respective relaxation times. The itting of the real impedance
(Z’) and imaginary impedance (Z’’) was done by using a simulation software (Zview). The parameters m and n are
entrance data which complements the Z’ and Z’’ itting at higher and lower frequencies. Figure 1 presents the equivalent circuit used to represent electrical conduction
conduction behavior of the crystals. This equivalent circuit of two R−C parallel circuits in series (Figure 1), one G1−C1
parallel represents the bulk and another one G2−C2 parallel
represents the surface efect of the electrode on the crystals. The electrode surface efect itting at low frequencies
on the ADP in the Z’’ in 160 ºC was not reached, owing to
the Zview simulation limiting value. The conductivity of all
crystals increases with increasing temperature. Hence, the
real impedance curves decreases at higher frequencies and
at higher temperatures. Thus, the impedance results of the mixed crystals are close to the impedance results of pure crystals (Figure 1). The solid lines represent the theoretical
its (Eq. 1) obtained by the use of the RC circuit simulation,
which represents the physical behavior of the experimental results, Figure 1.
Figure 1 shows Z’ curves which have a tiny dependency
with the frequency in the ac conductivities on the crystals
at low frequency regions, but at high frequencies, the conductivities increase to higher frequencies with a gradual
changing as the temperature is increased (diminutions on the Z’ curves - ‘knees’) on both curves (Z’ and Z’’). The shifts
of the ‘knees’ on the Z’ curves change to higher frequencies
as the temperature is increased. Moreover, the relaxation
peaks on frequency of the imaginary (Z’’) part moves to a
high-frequency region with increasing temperature for all
crystal samples.
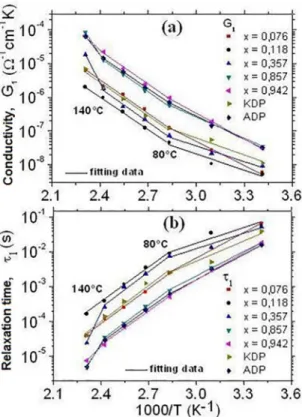
The loss peak frequency ωp1 can be obtained by itting the
imaginary impedance data and by the variation of relaxation
times, Figure 2(b), τ1 = 1/ωp1 as a function of reciprocal temperature. The Arrhenius equation τ1 = τ0 exp(ϕ/kBT) (where τ0 is the natural relaxation time and ϕ is the activation
energy) permits the determination of the activation energies
ϕ (Table 1) of the electrical dipoles in the bulk conductivity at diferent temperature ranges for the crystals. Continuum
current conductivity G1 (dc) can be obtained by using the
it method of the Z’ curves at low temperatures. Hence, the
linearity between ln(G1) and 1/T obtained from Arrhenius relationship G1 = exp(EG1/kBT) (where EG1 is the activation energy in the bulk to the dc conductivity and kB is the Boltzmann constant), Figure 2(a), gives the distinct activation energies, EG1, (Table 1) in diferent regions.
Table 1 presents the activation energies of the crystals.
Diferent values of τ1 and G1 are due to the temperature
variation rate ranges (Figure 2) for each crystal. As a result, distinct values of the activation energies in regards to the
relaxation time ϕ and conductivity G1 (dc) were obtained. Diferent electrical conduction mechanisms are involved in
the conductivity of the crystals, for instance, proton jumps in hydrogen bonds and heavier ions migration (K+ and NH
4 +) at
higher temperatures, as well as, the rotation and reorientation of ammonium groups in the crystal lattice. In the mixed crystals, the migration of heavier ions and the presence of the lattice defects, as micro cracks, led to the increase in the activation energy values mainly in higher temperature
Figure 2: (a) dc conductivity G1 as a function of temperature
and (b) variation of relaxation times, τ1 = 1/ωp1, as a function of temperature for the crystals.
ranges (Table 1). Hence, the crystals with amount x = 0.118 and 0.357 presented lower conductivities at a temperature range of 50 ºC - 140 ºC than those for other crystals, due to the barriers (as micro cracks and inclusion, for instance), which hinder the charge carrier mobility in the crystal lattice.
KADPx crystals with x = 0.942 and 0.857, as well as, ADP present greater conductivity than that on other crystals. This can be attributed to the relative facility of the charge carrier mobility in the ADP and ADP-rich crystals, owing to weaker HN-O bonds when compared to those K-O in the KDP-rich crystals and KDP, which presented lower conductivity. The mixed crystals with x > 0.8 and x < 0.2
have good quality and, consequently, better conductivity.
On the other hand, the mixed crystal with x = 0.357 have a relatively low conductivity (Figure 2) due to the micro cracks and inclusions occurrence, contributing to its low
quality. The higher values of activation energies between
140 and 160 ºC (Table 1) can be related to heavier ions migration and rotation of atomic groups, hindering the charge carrier mobility.
Other dielectric parameters, as the complex permittivity
(ε*) and complex conductivity (σ*), have been obtained through the following equations:
( )
’ ( )
i
" ( )
1
/ [
i
C
Z
( )] ( )
2
* *
0
~
~
~
~
~
f
=
f
-
f
=
( )
’ ( )
i
" ( )
i
( ) ( )
3
* *
0
Table 1: Activation energies for the K1-x(NH4)xH2PO4 crystals.
X Temperature range (ºC) Activation energy (eV)
0 160 - 80
80 - 20
ϕI = 0,66, EG1,I = 0,66
ϕII = 0,41, EG1,II = 0,36
0.076 160 - 80
80 - 20
ϕI = 0,67, EG1,I = 0,64
ϕII = 0,49, EG1,II = 0,29
0.118 160 - 80
80 - 20
ϕI = 0,67, EG1,I = 0,66
ϕII = 0,27, EG1,II = 0,48
0.357
160 - 140 140 - 80
80 - 20
ϕI = 1,80, EG1,I = 1,77
ϕII = 0,69, EG1,II = 0,66
ϕIII = 0,23, EG1,III = 0,30
0.857
160 - 140 140 - 80
80 - 20
ϕI = 1,53, EG1,I = 1,44
ϕII = 0,65, EG1,II = 0,66
ϕIII = 0,45, EG1,III = 0,44
0.942
160 - 140 140 - 80
80 - 20
ϕI = 0,82, EG1,I = 0,84
ϕII = 0,66, EG1,II = 0,66
ϕIII = 0,53, EG1,III = 0,51
1.0
160 - 140 140 - 80
80 - 20
ϕI = 1,35, EG1,I = 1,15
ϕII = 0,64, EG1,II = 0,63
ϕIII = 0,48, EG1,III = 0,43
where ω is the frequency, C0 and ε0 are the capacitance and permittivity in the crystal bulk, respectively. These
diferent terminologies on the dielectric analysis are useful,
as the crystal dielectric properties are easily extracted by
using these speciic representations.
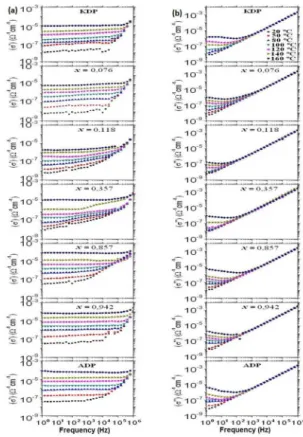
Figure 3 shows the real part (σ’) and imaginary part (σ’’)
variations of the conductivity ac as a function of the frequency by using a double logarithmic scale for the temperature region of 20 - 160 ºC for the crystals KDP, ADP, and K
1-x(NH4)xH2PO4 where x = 0.076, 0.118, 0.357, 0.857 e 0.942. Low dependency on the frequency in part of the σ’ can be observed at low frequencies and an increased conductivity part as the frequency increased at high frequencies for all crystals. At low frequency regime, the ac conductivity in the crystals depends on the temperature.
The conductivity and frequency dependence decreases as the temperature is increased. The σ’’ variation as a function of frequency is linear for all crystals, as can be seen in Figure 3.
Nevertheless, it changes the inclination, passing through a
minimum value at diferent temperatures for each crystal.
The linearity deviation indicated that the ionic contribution increased as the temperature increased in the volume of the crystals, despite their possibility on ionic conduction at low
and high frequencies.
The σ’ values on the x = 0.076 KADPx crystal increase from 5.5×10⁻⁹ Ω-1 cm-1 at 20 ºC to 8.0×10⁻⁶ Ω-1 cm-1 at 160 ºC at low frequencies. For x = 0.118, the σ’ values increase from 5.5×10⁻⁹ Ω-1 cm-1 at 20 ºC to 2.0×10⁻⁶ Ω-1 cm-1 at 160 ºC. In other words, the larger linearity deviation in σ’’, Figure 3,
indicates that the x = 0.076 sample conductivity is higher than that in x = 0.118. Accordingly, the dc conductivity in the x = 0.076 specimen showed the same behavior, Figure 2(a).
Conductive behavior in the σ’ and σ’’ with some anomalies at diferent temperatures and frequencies for the x = 0.357
Figure 3: Real part (σ’) and imaginary part (σ’’) variations of the
conductivity ac as a function of frequency and temperature for
the crystals.
sample can be seen in the Figure 3, suggesting the occurrence of lattice distortions, cracks, and other defects, hindering charge mobility. Figure 3 also shows that the electrical resistance decreases as the temperature is increased, contributing to the mobility of heavier ions (NH4+, K+), and suggesting the H
2O molecules difusion from inclusions to the crystal lattice.
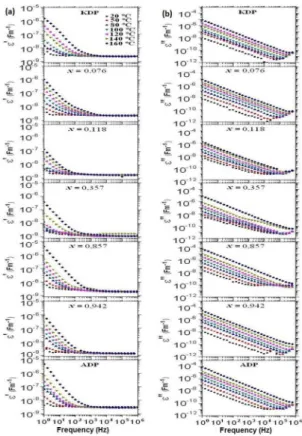
Figure 4 shows the real part (ε’) and imaginary part (ε’’)
variations of the permittivity ac as a function of the frequency by using a double logarithmic scale for the temperature region of 20 - 160 ºC for the crystals KDP, ADP, and K1-x(NH4)
xH2PO4 where x = 0.076, 0.118, 0.357, 0.857 e 0.942. Figure 4 shows that ε’ values quickly increase at low frequencies and at high temperatures, owing to the ion mobility efect in the crystal frame and increased polarization of the electrodes. Furthermore, ε’’ can be formulated as a two sum
of electrical behaviors, which are related to the conduction of the long-range mobile ions and the reorientation of dipoles (as group of atoms in lattice) in the mixed crystals
under an external electrical ield. These two behaviors are, respectively, regarding to the 1/ω variation at low-frequency and broad incomplete bands at high-frequency (Figure 4).
As indicated in Figure 4, crystals become conductors when the temperature is increased as already observed. Graphic
comparison in Figure 4 shows that the ε’ values in the
Figure 4: Real part (ε’) and imaginary part (ε’’) variations of the
permittivity ac as a function of frequency and temperature for the
crystals.
sample at low frequencies and at high temperatures, owing
to the x = 0.076 crystal good quality, contributing to the ionic mobility increase. Furthermore, the incomplete bands
in ε’’ for the x = 0.118 crystal, Figure 4, are broader than
those showed in ε’’ for the x = 0.076, that is, the dipolar relaxation contribution is more expressive in the x = 0.118 sample than that in the x = 0.076 sample mainly in low
temperatures. Figure 4 also shows that both ε’ and ε’’ curves
for the x = 0.357 crystal have anomalies which indicate the anomalous structural behavior in regards to the lattice defects. Therefore, KADPx crystals with higher quality, x = 0.942 and 0.076, have better conductivity compared to other mixed crystals. On the other hand, occurrence of distortions and other defects in the crystal lattice are detrimental to the increase of ammonium or/and potassium content x in the mixed crystals. This result indicates that the conductivity is degraded in the crystal with intermediate x content. In the mixed crystals the microscopic environment around ammonium, close to the intrinsic structural form of the ion ammonium in the ADP-pure, has higher conductivity than that in the microscopic environment around potassium in the mixed crystal with more similarity to the KDP intrinsic structural form.
In summary, ADP-pure and ADP-rich crystals with bigger microscopic environment around ammonium than
that around potassium have microstructural behavior with easier charge carrier mobility than that for KDP and KDP-rich crystals. This contributes to the higher electrical conductivity in environment around ammonium than that in environment around potassium with strongest bonds, K-O. Moreover, the occurrence of the lattice defects as micro cracks and inclusions (mainly in intermediate amounts x), leading to
the crystal quality degradation, hinder even more the charge
carrier mobility. Accordingly, electrical conductivity by
the charge carriers is strong inluenced by crystal frame
aspects. Moreover, the chemical bond strengths in the K+,
NH4+, and H 2PO4
- ions and the organization form between
ions to compose the crystal during the crystal growth and
the diferences of the ionic radius (K+ and NH 4
+) have
important role in the conductivity and defect occurrence in mixed crystals.
4. Conclusion
Electrical conductivities of the pure crystals KDP and ADP, as well as, KADPx (x = 0.076, 0.118, 0.357, 0.857, 0.942) mixed crystals were investigated by means of Impedance
Spectroscopy under the inluence of increase in frequency
and temperature. They were grown by solvent evaporation method. Zview simulation software was used to theoretically
it conductivity results. These crystals are dielectric-type
crystals at room temperature and become ionic conductors when the temperature is increased. This conduction behavior
follows the Arrhenius equation with which the diferent
activation energies were determined. Proton jumps in
hydrogen bonds, heavier ions migration (K+ and NH
4 +),
and rotation and reorientation of ammonium groups act as charge carriers, contributing to electrical conduction. For ADP-rich (x > 0.8) and pure ADP crystals the conductivities are higher than those for KDP-rich (x < 0.2) and pure KDP, owing to the easier charge carrier mobility in the microscopic environment around ammonium than that in the microscopic environment around potassium. Results suggested that the KADPx (x = 0.94) crystal at 80 - 140 ºC temperature range is the best conductor. Lattice defects may reduce electrical conductivities in the crystals with intermediate x composition. Complex permittivity and complex conductivity ac were also obtained for these crystals.
5. Acknowledgment
The author is grateful to CAPES (Brazil) for the inancial
support of this work, and also thank Bianchi R. F. and Franco C. J. for their very much appreciated inputs.
6. References
2. Glass AM, Lines ME. Principles and Applications of Ferroelectric and Related Materials. Oxford: Oxford University Press; 1977. p. 293-321.
3. Boukhris A, Souhassou M, Lecomte C, Wyncke B, Thalal
A. Evolution of the structural and mean square displacement
parameters in (NH4)xK1−xH2PO4 solid solutions versus concentration and temperature. Journal of Physics: Condensed Matter. 1998;10(7):1621-1641.
4. Zaitzeva N, Carman L. Rapid Growth of KDP-type Crystals.
Progress in Crystal Growth and Characterization of Materials. 2001;43(1):1-118.
5. Ren X, Xu D, Xue D. Crystal growth of KDP, ADP, and KADP.
Journal of Crystal Growth. 2008;310(7-9):2005-2009.
6. Souza FM. Preparação e caracterização estrutural e elétrica de cristais mistos de K1-x(NH4)XH2PO4. [Dissertation]. Ouro Preto: Rede Temática em Engenharia de Materiais - Universidade Federal de Ouro Preto; 2009. 76 p.
7. Xu D, Xue D. Chemical bond simulation of KADP single-crystal growth. Journal of Crystal Growth. 2008;310(7-9):1385-1390.
8. Chen RH, Yen CC, Shern CS. Studies of high-temperature phase transition, electrical conductivity, and dielectric relaxation in (NH4)H2PO4 single crystal. Journal of Applied Physics. 2005;98(4):044104.
9. Chen RH, Yen CC, Shern CS, Fukami T. Impedance spectroscopy and dielectric analysis in KH2PO4 single crystal. Solid State Ionics. 2006;177(33-34):2857-2864.
10. Jonscher AK. Dielectric relaxation in solids. Journal of Physics
D: Applied Physics. 1999;32(14):R57-R70.
11. Cole KS, Cole RH. Dispersion and Absorption in Dielectrics. 1. Alternating Current Characteristics.Journal of Chemical Physics. 1941;9(4):341-351.
12. Subhadra VK, Syamaprasad U, Vallabhan CPG. High-temperature phase transitions in pure and deuterated ammonium dihydrogen phosphate: Conductivity and dielectric measurements. Journal of Applied Physics. 1983;54(5):2593-2596.