Agradeço
Ao Professor Luís Cunha por ter exigido sempre mais dos seus alunos durante esta etapa como diretor de mestrado.
A todos os coautores do artigo aqui apresentado, pelo contributo para a sua realização. Foram peças fundamentais.
Ao Professora Pedro Moreira por ter auxiliado na elaboração e correção do artigo. À Professora Patrícia pela pedagogia e generosidade com que me transmitiu e partilhou os seus conhecimentos e por me orientar como se da sua tese se tratasse. Por escutar todas as dúvidas sem nunca as pôr em causa. Agradeço ainda a paciência e o empenho. Não podia ter escolhido melhor.
À Sofia Sousa por ser a amiga com quem partilhei toda esta experiência e que muitas vezes me socorreu.
Aos meus amigos, por sem saberem, permitirem ultrapassar os momentos de fraqueza com momentos de descontração.
À Rita por estar sempre disponível.
Ao Igor por toda a paciência e motivação, pelo apoio incondicional. Aos meus pais e irmão, por tudo!
Abstract
The changes in eating habits have been linked to the occurrence of noncommunicable diseases (NCDs) in developing countries such as Mozambique. These changes are strongly related to globalization, industrialization and urbanization and they are already felt in this country. Among NCDs, cardiovascular diseases (CVDs) are the leading cause of death worldwide and has had a great impact in Mozambique. Major risk factors to CVDs such as high sodium intake must be prevented and controlled. This thesis aimed to evaluate the urinary excretion of sodium, to estimate its main food sources and to quantify the contribution of processed/ultra-processed for total sodium intake in a sample of the Maputo inhabitants. With this purpose, a structured questionnaire was applied to assess demographic characteristics including sex, age, and education; anthropometric measurements were taken, a 24-h recall was applied, and 24-hour urine was collected. It was found that almost all of the participants (93%) exceeded the sodium intake recommendations; the major dietary sources for non-discretionary salt were cereal and meat products, contributing with 66% and 8% respectively. Discretionary salt contributed most to total dietary intake (57%), followed by foods’ intrinsic sodium (25%) and sodium from processed foods (18%). Through Monteiro et al categorization, ultra-processed foods contributed with the huge slice of total dietary sodium intake (79%). Another important result was the failure to comply the recommended potassium intake (63%). This thesis provided the first assessment of dietary sources of sodium and urinary sodium, highlighting the need to develop more studies including other settings and also to develop programs of prevention and intervention to improve dietary habits and, in order to avoid the expected increase of NCDs.
Keywords:
noncommunicable diseases, epidemiological transition, cardiovascular diseases, hypertension, dietary sodium, urinary sodium, Mozambique.Resumo
Nos países em desenvolvimento, as alterações dos padrões alimentares contribuem para o aparecimento das doenças não transmissíveis (DNT), como verificado em Moçambique. Estas alterações estão fortemente relacionadas com o processo de globalização, industrialização e urbanização já presente neste país. Dentro das DNT, as doenças cardiovasculares (DCV) são a principal causa de morte em todo o mundo e têm tido um impacto significativo em Moçambique. A prevenção e controlo dos principais fatores de risco envolvidos neste tipo de doenças, como o elevado consumo de sal, são de extrema importância. Esta dissertação pretende avaliar a excreção urinária de sódio, estimar as principais fontes e quantificar o contributo dos alimentos processados e ultra-processados para o sódio total numa amostra de indivíduos Moçambicanos. Assim, um questionário devidamente estruturado foi aplicado para recolher informação sobre as características demográficas como sexo, idade e educação; as avaliações antropométricas foram realizadas bem como o recordatório alimentar e urinário às 24 horas anteriores. Os resultados mostraram que quase toda a amostra excedeu as recomendações relativas à ingestão de sódio (93%); as principais fontes alimentes de sódio foram os produtos cerealíferos e os de carne, contribuindo com 66% e 8% respetivamente. O sal de adição foi o principal contribuidor para a ingestão total de sódio (57%), seguido do sódio intrínseco aos alimentos (25%) e sódio proveniente dos alimentos processados (18%). Segundo a categorização de Monteiro, os alimentos ultraprocessados foram os que mais contribuíram para a ingestão total de sódio (79%). Outro resultado não menos importante foi o não cumprimento das recomendações para a ingestão de potássio em que mais de metade da amostra apresentou valores abaixo do recomendado (63%). Esta tese apresenta os primeiros resultados sobre as fontes alimentares de sódio e do sódio urinário, reforçando a necessidade do desenvolvimento de mais estudos em amostras representativas, e ainda a criação de programas de prevenção e intervenção para que haja uma melhoria nos hábitos alimentares, de forma a evitar o aumento expectável das DNT.
Palavras-chave:
doenças não transmissíveis, transição epidemiológica, doenças cardiovasculares, hipertensão, sódio intrínseco, sódio excretado, Moçambique.Table of contents
AGRADEÇO ... VIII
ABSTRACT ... II
RESUMO ... III
LIST OF FIGURES ... V
ABBREVIATIONS………. VI
1.
BACKGROUND ... 1
1.1 Burdenof noncommicable diseases in Africa ...
4
1.2 Nutritional, epidemiological and demographic transitions ...
4
1.3 The Mozambique case...
7
1.3.1 Mozambique country profile ...
7
1.3.2 Noncommunicable diseases in Mozambique……...………..………..……
9
1.3.1 Hypertension and sodium in Mozambique ...
14
2. AIMS ... 17
3. METHODS ……….17
3. PAPER………. 21
4.
CONCLUSIONS ... 442
List of figures
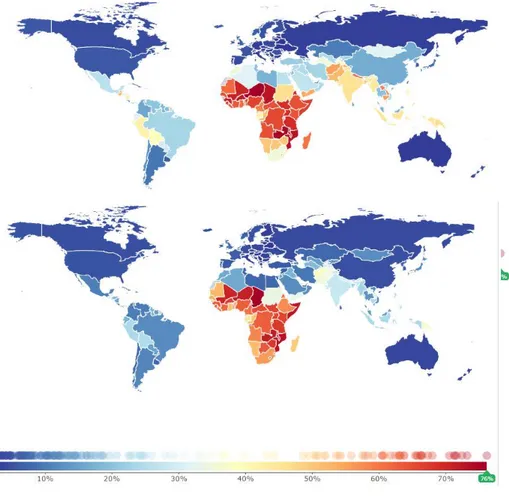
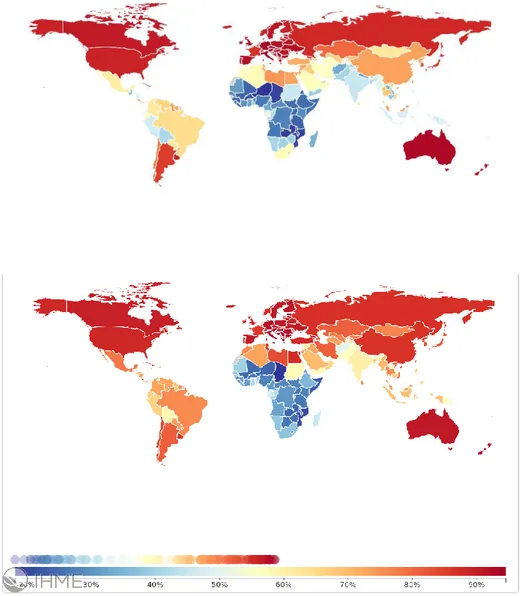
Figure 1 | Percentage of total deaths due to communicable, maternal, neonatal and
nutritional diseases in 1990 and 2014, by world region………..1
Figure 2 | Percentage of total deaths due to noncommunicable diseases, in 1990 and 2014, by world region………..2
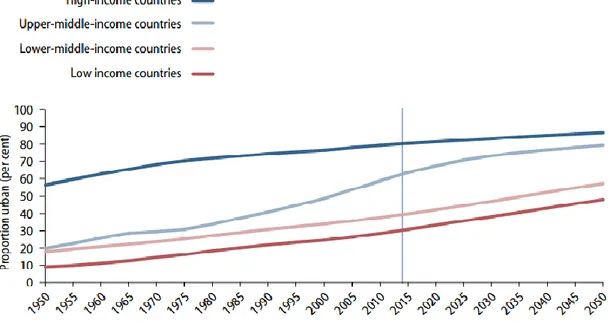
Figure 3 | Proportion urban population by income groups, 1950-2050………..5
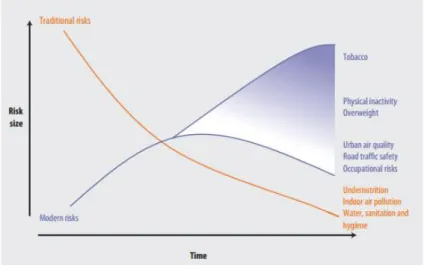
Figure 4 | The risk factors that most affect the health in the entire world………...6
Figure 5 | Population pyramid from Mozambique, 2014………8
Figure 6 | Percentage of total deaths due to communicable diseases, noncommunicable diseases and injuries in 1980 and 2013, in Mozambique……….9
Figure 7 | Percentage of total deaths due to noncommunicable diseases in 2013, by age group………...10
Figure 8 | Proportion mortality (%of total deaths), all ages, both sexes………..11
Figure 9 | Percentage of overweight and obesity in 1980 and 2013, with focus on Mozambique………..12
Figure 10 | Overweight and obesity in Mozambique in 1980 and 2012, by age groups……….13
Abbreviations
BMI – Body Mass Index BP – Blood Pressure
CDs – Communicable Diseases CVDs – Cardiovascular Diseases
MFCT - Mozambican Food Composition Table NCDs – Noncommunicable Diseases
SD - Standard Deviation
1. Background
1.1 Burden of noncommunicable diseases in Africa
Also known as infectious diseases, communicable diseases (CDs) can be passed, directly or indirectly, from one person to another and they are caused by pathogenic microorganisms such as bacteria, virus, parasites or fungi (WHO 2010). For centuries, CDs were the main cause of death in the entire world (Boutayeb and Boutayeb 2005). Nowadays, the number of deaths due to this type of diseases is low, with Africa being an exception (Figure 1).
Figure 1 | Percentage of total deaths due to communicable, maternal, neonatal and nutritional diseases in 1990 and 2014, by world region. Source: Institute for Health Metrics and Evaluation, University of Washington, 2016 (IHME 2016).
After Second Global War, life expectancy had increased due to medical progresses in terms of vaccination, antibiotics and better life conditions (Boutayeb and Boutayeb 2005). Besides this, globalization phenomenon was accompanied by a replacement of infectious diseases as the main cause of death by a gradual and continued rise of chronic and degenerative diseases (Belahsen 2014). As the name implies, noncommunicable diseases (NCDs), of long duration and slowly progression, cannot be passed from person to person (WHO 2015) and they cause major problems in industrialized countries. Despite of being known as “rich diseases” owing to doubtless association with better economic conditions, NCDs appeared spreading the entire world (Boutayeb and Boutayeb 2005) (Boutayeb 2005) (Figure 2).
Figure 2 | Percentage of total deaths due to non communicable diseases, in 1990 and 2014, by world region. Source: Institute for Health Metrics and Evaluation, University of Washington, 2016 (IHME 2016).
Translating to numbers, the number of deaths worldwide rose by near 8 million in 1990’s to 34.5 million in 2010, almost two-thirds of total deaths (Lozano, Naghavi et al. 2012). Surprisingly, approximately 80% of all deaths due to NCD occurred in the lowest income nations in 2008, discrepant from the 40% observed in 1990 (Murray and Lopez 1997).
Strengthening it, Boutayeb’s article help us getting elucidate about the evolution and projection of CDs and NCDs in developing countries, with NCDs achieving 80% of the global burden of disease (Boutayeb 2005).
Not hiding that there are still more deaths from infectious diseases in Africa, the burden of NCDs is increasingly rapidly and they are expected to become the most common causes of death in 2030. Besides Africa, the highest increase is expected in South-East Asia and the Eastern Mediterranean (WHO 2014).
The increasing burden of NCDs requires huge concern due to highly economic costs, and health service’s needs, especially in countries where premature death is devastating and effective and equitable health care services are difficult (Gomes, Damasceno et al. 2010, WHO 2015). In a joint report by the World Economic Forum and the Harvard School of Public Health, the economic burden of five NCDs (cardiovascular diseases (CVDs), cancer, chronic respiratory disease, diabetes and mental illness), will be responsible for a loss of US$ 47 trillion over the two decades (Bloom, Cafiero et al. 2011). So far, all member states of the United Nations have assumed a political declaration in which is expressed the need of an effort by the whole government and society to reduce risk factors as well as public health campaigns (United Nations 2011).
1.2 Nutritional, epidemiological and demographic transitions
Before demographic transition, life was short, births were many, growth was slow and the population was young. At 1980’s, at the beginning of transition, mortality decline and then fertility also decline, making population growth rates first to accelerate and then to slow again, moving toward low fertility, long life and old population. It had started at Europe and now it’s spread to all parts of the world, projected to be completed by 2100 due to truly association with socioeconomic development in terms of education, employment, rising incomes, improvements in health status, increased life expectancy and better life conditions, restructuring population dynamic (Lee 2003).
Globalisation is well linked to goods and cultures changes as well as food changes. Substantial increases in food consumption, changes in consumption patterns and modifications in the entire food system have occurred globally. The improvement in food production has led to a decrease of malnourished people in many developing regions in the world, even though a significant number still suffers from hunger and malnutrition (Schmidhuber and Shetty 2005). Besides the problem of insufficient protein and dietary intake, micronutrients deficiencies still exist in poor and middle countries, including Africa. The nutrition transition that is undergoing in these regions over the last two decades is a result of a more demographic, nutritional and epidemiological transition that attends development and urbanisation (Belahsen 2014). The rate of urbanization, which is defined as “positive when the urban population grows at a faster rate than the total population” (UNICEF 2012), is one of the most marked environmental and societal already felt and is increasing globally; from 33.6% of the world population living in urban areas in 1960 to 53.9% in 2015 (The World Bank 2016), and expected to achieve 61.1% in 2025 (Chockalingam and Camargo Maranhao 2003). Besides urbanization in developing countries has been faster than in developed ones, particularly in Africa and Asia regions that are projected to reach 56% and 64% urban at the middle of this century, the rate of urbanization with economic growth has been frailer than in developed countries and will still be less urbanized than other regions of the world (Figure 3). Rapid urbanization in low and middle countries reinforces the epidemiological transition in urban societies, which is altering the physical and social habitat of cities, leading to one of the most important global health issues of XXI century (Kroll, Bharucha et al. 2014).
The shift from traditional (e.g. undernutrition, unsafe water and sanitation) to modern (e.g. harmful use of alcohol, unhealthy diet, tobacco use, sedentary lifestyle) risk factors and frequent physiological changes (such as high blood pressure, high blood lipids, high fasting blood glucose and overweight/obesity) could explain why the entire world, including Africa’s, is facing the so-called epidemiological transition (WHO 2009), as shown in figure 4.
Moreover, the above mentioned risk factors contribute not only to the onset of cancer, but also of CVDs (Belahsen 2014). Cardiovascular diseases, a group of disorders of the heart and blood vessels, are the number one cause of death globally once there are more people dying from these than from any other cause. In the last two decades, the number of deaths from CVDs increased 31% and its estimated to increase from15.6 million in 2010 to 28 million by 2030 (Lozano, Naghavi et al. 2012). According to World Health of Organization (WHO) global status report on NCDs 2014, 17.5 million people died from CVDs in 2012, which represents 31% of all global deaths. Moreover, about three quarters of CVDs deaths occurred in low and middle income countries (WHO 2014). Ischemic heart disease (13.3%) and stroke (11.1%) contributed for the major proportion of deaths. Hypertension, the largest single attributable risk factor to CV death, leads to 51% and 45% of deaths due to stroke and ischemic heart disease in 2004, respectively. The risk of dying from high blood pressure (BP) is doubly higher for low and middle income countries than for high income countries. (WHO 2009).
Figure 4 | The risk factors transition that most affect the health in the entire world. Source: World Health Organization (WHO 2009).
1.3 The Mozambique case
1.3.1 Mozambique country profileMozambique is a low income sub-Saharan country located in the south eastern Africa, distributed by eleven provinces (North: Niassa, Cabo Delgado and Nampula; Center: Zambézia, Tete, Sofala and Manica; and South: Maputo, Gaza, Inhambane). It already accounts with about 25 million inhabitants and according to Mozambican National Institute of Statistics population projections, is expected an increase of more than the double inhabitants in 2040 (46 181 058 inhabitants) when compared to 2007 (20 632 434 inhabitants) (Instituto Nacional de Estatística de Moçambique. 2007).
Before 1994, Mozambique was considered one of the poorest countries in the world due to civil war installed for almost two decades (after Portugal’s independence in 1975). After country’s first democratic election, some political stability had been established culminating in an impressive economic growth. However, this had not been followed by poverty’s and food security’s eradication as well as better life conditions such as the creation of jobs and livelihoods. Mozambique only ranked 178th out of 187
countries in the most recent Human Development Index and it’s expected for gross domestic product to continue decelerating until 2017 for about 6% (The World Bank 2016).
Despite the proportion of population living under poverty had decreased 15% between 1996/1997 (69%) and 2002/2003 (54%), the percentage of Mozambicans considered poor remained practically stable until 2008. This is explained by the stagnation growth in agriculture productivity and by the large increase of international food and fuel prices. This gets serious attention once almost 70% of Mozambicans lives in rural areas (poverty rate is higher than urban areas) and practically all of them are employed in this area (Arndt, Hussain et al. 2012). Despite this sector still remains unproductive, it is an important source of family’s income and the most important contributor for the national agricultural production. Data from the latest Household Budget Survey showed that families spend less money of their overall budget in food when compared to 2008/2009 (51% to 35,6%) (Insituto Nacional de Estatística 2016).
Talking about social progress index, Mozambique ranked 128th and 119th out of
135 countries in the access to safe water and sanitation, respectively. In 2008, 16% of all deaths in Mozambique were due to inadequate water, sanitation and hygiene practices (WHO 2008).
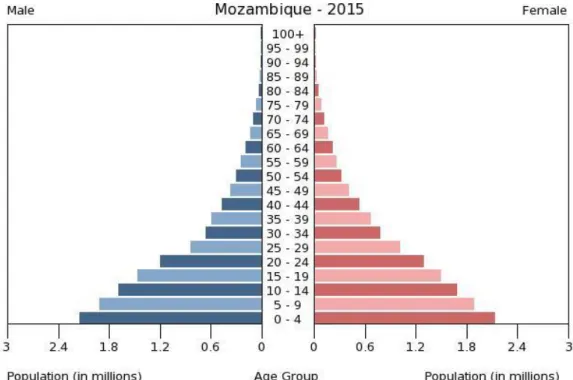
The high fertility rate (mean five children per woman) and high mortality rate (due to high under-five mortality (70 deaths per 1000 live births in 2015) and HIV/AIDS deaths) are depicted in the age-structured figure 5, also reflecting the poverty rate in this country.
As expected, almost a half of population are aged below 15 years (45.13%) and only 6.35% over 55 years (CIA 2015). Far from the expectable, the coverage of antiretroviral therapy and the implementation of preventive measures to reduce childhood diseases and malaria (Joint United Nations Programme on HIV/AIDS 2010), made life expectancy increased from 42 years in 1997 to 53 years in 2015 (Instituto Nacional de Estatística e Ministério da Saúde 2012) (CIA 2015).
Figure 5 | Population pyramid from Mozambique, 2014. Source: Central Intelligence Agency, 2015 (CIA 2015).
1.3.2 Non-communicable diseases in Mozambique
As in the other Sub-Saharan countries, the burden of NCDs, together with CDs prevails in this country (figure 6).
Figure 6 | Percentage of total deaths due to CDs, NCDs and injuries in 1980 and 2013, in Mozambique. Source: Institute for Health Metrics and Evaluation, University of Washington, 2016 (IHME 2016).
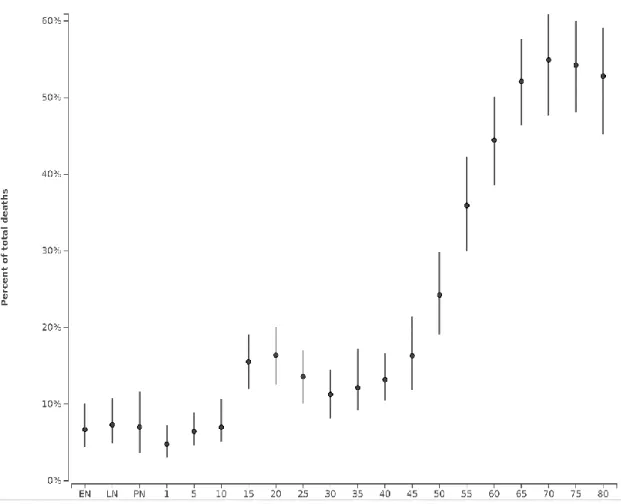
Although CDs are still in charge for the highest number of deaths and the largest burden of disease, NCDs accounted for 19.9% of total deaths in 2010, and they are increasing with age in Mozambican population, the same verified in developed countries (Figure 7) (IHME 2016).
Data from the WHO latest report, Mozambique NCDs country profiles in 2014, showed us that NCDs already accounted for 23% of total deaths, and the huge slice is for CVDs (7%). (Figure 8).
Figure 7| Percentage of total deaths due to NCDs in 2013, by age group. Source: Institute for Health Metrics and Evaluation, University of Washington, 2016 (IHME 2016).
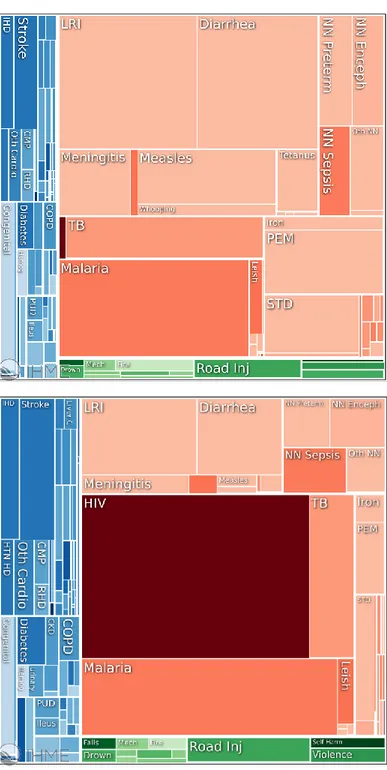
CVDs were responsible for 5.6% of the deaths, cancer for 4.7%, chronic respiratory diseases for 1.4%, and diabetes for 0.9% (IHME 2016). As already verified in 1994 between Maputo inhabitants aged over 60 years (Dgedge, Novoa et al. 2001), cerebrovascular diseases were the main leading cause of death in 2010, causing one tenth of deaths in Mozambicans older than 69 years. Stroke hospitalization had one of the highest incidence in the developing settings, estimated to be 148.7 per 100.000, among 2005 and 2006 (Damasceno, Gomes et al. 2010).
Hypertension is a very important risk factor since it’s the large contributor for CDVs. In Mozambique, hypertension affects one-third of the population and CVDs already have an important public health impact (Damasceno, Azevedo et al. 2009) (Damasceno, Gomes et al. 2010). According to the literacy pattern, there were also urban and rural differences, with urban areas presenting a higher prevalence of hypertension. In contrast with body mass index and cholesterol, blood pressure is not correlated with economic factor (Damasceno, Azevedo et al. 2009). Despite the paradigm to major cause of death has been shifted from a predominance of nutritional deficiencies and infectious diseases to those classified as degenerative ones, this does not mean that different countries or even different regions within a country are at equal stages of the epidemiological transition (Amuna and Zotor 2008) (Yusuf, Reddy et al. 2001). There are noticeable differences when passing from a rural to an urban lifestyle, including dietary habits and physical activity patterns. Mozambicans presented a higher prevalence of overweight/obesity and had higher waist circumference, which is also observed in other African nations such as Democratic Republic of Congo, Madagascar
Figure 8 | Proportion mortality (%of total deaths), all ages, both sexes. Source: World Health Organization (WHO 2014).
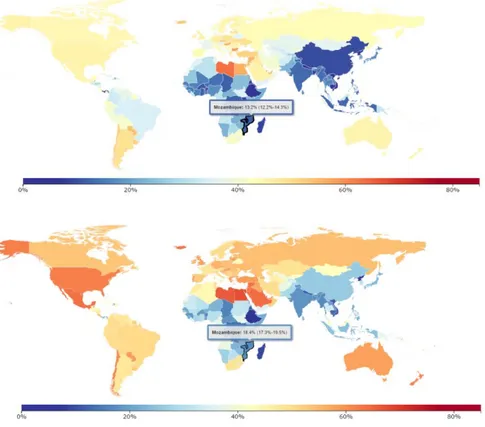
or Algeria (Gomes, Damasceno et al. 2010). The prevalence of overweight and obesity has abruptly increased, from 13.2% in 1980 to 18.4% in 2010 (figure 9), and it’s equally reflected in all age groups (figure 10). Conversely the pattern observed in developed countries where higher education most likely means healthier lifestyles, this was not observed in Gomes et al study. Mozambicans with more literacy have higher prevalence of overweight and obesity when compared to individuals with less formal education, reflecting the early stages of transition (Gomes, Damasceno et al. 2010).
Figure 9 | Prevalence of overweight and obesity in 1980 and 2013, with focus on Mozambique. Source: Institute for Health Metrics and Evaluation, University of Washington, 2016 (IHME 2016).
Figure 10| Overweight and obesity in Mozambique in 1980 and in 2012, by age groups. Source: Institute for Health Metrics and Evaluation, University of Washington, 2016 (IHME 2016).
1.3.3 Hypertension and sodium in Mozambique
Sodium, the predominant ion of the extracellular fluid, regulates extracellular and plasma volume and is also important in neuromuscular function and maintenance of acid-base balance. It is readily absorbed from the intestine, carried to the kidneys to be filtered, and returned to the blood to maintain adequate levels. Usually, the amount of sodium absorbed is proportional to the intake in healthy adults once about 90% to 95% of normal body sodium loss is through the urine (the rest part is lost in feces and sweat) (Escott-Stump and Kathleen Mahan 2007).
Sodium excretion is maintained by a complex mechanism that involves glomerular filtration rate, the cells of the kidneys, the renin-angiotensin-aldosterone system, the sympathetic nervous system, catecholamines, and blood pressure. The sodium balance is regulated by aldosterone secreted by the adrenal cortex and when blood sodium levels rise, the thirst receptors stimulate the thirst sensation so that the ingestion of fluids returns sodium levels to normal (excrete more water and sodium in the urine) (Escott-Stump and Kathleen Mahan 2007).
Commonly, heathy kidneys are able to excrete excess sodium intake but there is a huge concern about persistent excessive sodium intake due to inevitable association to the development of hypertension (Escott-Stump and Kathleen Mahan 2007). The role of dietary sodium in BP is not fully understand but it is believed that this long-term regulation implicates sodium handling by the kidneys and is influenced by several factors (genetic, environmental, neurohormonal, nutritional and metabolic factors) (Jones 2004). Further attention should be given to this issue since less than 10% of Mozambican adults diagnosed with hypertension were under pharmacological treatment (Damasceno, Azevedo et al. 2009). Moreover, almost 64% never had their blood pressure measured (Damasceno, Padrao et al. 2013). Reasons for the increasing prevalence and poor hypertension controlled should be defined and approaches to prevent and improve control should be identified.
The strength of evidence for salt intake as a factor in BP is much stronger than other lifestyle factors (Tibazarwa and Damasceno 2014). High sodium intake was in charge for an estimated 3.1 million deaths worldwide in 2010, higher when compared to 2.2 million in 1990 (Lim, Vos et al.). Sodium reduction is one of the top 10 best measures for preventing NCDs and is likely to be cost-effective (Zarocostas 2011, Eyles, Shields et al. 2016). The WHO recommendations set no more than 2g of sodium (5 g of salt) in a day, so NCDs can be lowered (WHO 2012). Nonetheless, in all countries with recent data available, dietary sodium intake is well above the recommendations (WHO 2007).
Decreasing dietary salt intake from the current levels of 9 -12 g/day to the recommended level of 5 g/day would have an important impact on reducing BP and so CVDs (Lim, Vos et al.).
A decline in the consumption of foods rich in vitamins, minerals and fibre, such as fruits, vegetables, legumes and whole grains, and an increment of processed foods, naturally energy dense and rich in sodium is expected with the globalization process. It is important to mention that the proportion of the population located in urban areas will continue to rise worldwide and it will be more noticeable and quickly in Asia and African continents than in the other regions (Popkin 2011).
So, regardless of being at the earliest stage of epidemiological transition (Gomes, Damasceno et al. 2010, Gomes, Damasceno et al. 2013), it’s expectable an increase of ultra-processed foods consumption, naturally high in sodium, reason why its ground to know not only the amount but also the main sources of dietary sodium. The most frequently ones tend to be ultra-processed foods and discretionary salt, and it is extremely variable due to the extent of urbanization/culture (Damasceno, Azevedo et al. 2009, Sookram, Munodawafa et al. 2015, Eyles, Shields et al. 2016).
The WHO set a target for countries to reduce population sodium intake by 30% toward 2000mg/d by 2025, with seventy-five countries responded to this (WHO 2013). Mozambique still not answered and there is no data about sodium intake in adult Mozambican using the gold standard method of 24hour urine collection (McLean 2014) that allows the assessment of distribution and average intake of sodium (Elliott; and Brown 2007).
2. Aims
This thesis aimed to deeper the knowledge aboutsodium contribution in the diet of the Mozambican adults.
In order to fulfil de main objective, the specific ones are to (1) identify the main dietary sources of sodium and to (2) estimate the urinary excretion of sodium ingested, in a 24-hour period within a sample of Maputo’s population.
3. Methods
Study design
For the present-community based cross sectional study, a convenience sample of one hundred Mozambican adults, aged 25 to 64 years and belonging to different households, was assembled between October 2012 and May 2013. A face-to-face interview using a structured questionnaire to collect information on demographic, socioeconomic and lifestyle characteristics (including sex, age, religion (5 missing values), education, partner status, job occupation (1 missing value), income (1 missing value), smoking habits, physical activity for leisure (1 missing value) or at work (2 missing values)), as well as anthropometric measurements and the assessment of 24-h recall and 24-hour urine collection. Exclusion criteria were pregnancy and physical or mental condition that impair the interview.
Demographic, socioeconomic and lifestyle characteristics
Social and demographic characteristics were assessed such as sex, age, religion (Christian, Mulism, other), predominant ancestry (African, Arabic, Indian, Chinese, white or mixed), marital status (married/currently living with someone or single/separated/widow and without life partner). School attained education were also asked and classified in five levels such as (1) less than 7 years (primary school not completed), (2) 7 years (primary school completed), (3) 8 to 11 years (secondary school not completed), (4) 12 years (secondary school completed) and (5) more than 12 years (Pos secondary school, professional course or higher education). Besides this classification, current job or the last job was also categorized into skilled/semiskilled non manual (teacher, nurse, director, clerk, supervisor shop, driver, policy, army staff and others), skilled or semiskilled manual (mechanic, carpenter, mason, other), unskilled manual (labourer, security, cleaner, other) or housekeeper (if never worked outside home).
Overall personal income per month (Metical) was asked, including allowances and other benefits, and stratified in (1) no income, (2) less than 3000, (3) 3000-5000, (4) 5000-8000, (5) 8000-15000 and (6) more than 8000.
To assess the smoking status, the participants were asked whether they currently smoked (one or more cigarettes per day), occasionally smoked or non-smokers. Finally, daily physical activity during labor time (sitting down most of the time, often standing/moving without having to lift/carry weights, or often standing/moving and often
carrying/lifting weights) or for leisure for at least 30 minutes (never or <1/week, 1/week on average, or 2-3 times/week on average) were also assessed. Smoking habits and physical activity were self-reported by participants.
24-hour urine collection
Participants were asked to provide a 24-hour urine collection. A container was supplied and they were carefully instructed (oral and written guidelines) to collect and complete 24hour urine samples. They were taught to discard the first morning void and to collect all urine over the following 24-hour including the first void on the next morning, recording the start and finish collection in the questionnaire. Considering the participant’s comfort and for feasibility purposes, urine collections were held on Sundays and during the collection period, subjects were asked to store the collected urine in a cool place. Urine samples were sent to a certified laboratory in order to evaluate urinary creatinine (mg/day) (Jaffé reaction, Siemens Advia 1650) and urinary sodium (mEq/day) (indirect ion-selective electrodes methodology, Siemens Advia 1800) through analytical methods. Although sodium excretion has been reported in mEq/day, it was converted to mg/day through their molecular weight for comparative purposes (23mg Na=1mmol or 1 mEq Na). Sodium chloride excretion (commonly referred as salt) was conducted by multiplying the amount of sodium excreted by 2,55 factor (NaCl (g) = Na (g) x 2,55). For 24-hour urine collection validation, quality control has to be made through urinary creatinine excretion in relation to body weight according to age group (creatinine coefficient = creatinine [mg/day]/body weight [kg]). It was considered an acceptable indicator when the value was between 14.4 and 33.6 for males and between 10.8 and 25.2 for women (Liu, Ikeda et al. 2002). The failure of this criterion (n=19) resulted in the exclusion of individuals of the final data processing.
Dietary record
A 24-hour dietary recall referring to the day of the urine collection was made by a trained interviewer. Participants were asked to report all foods and beverages consumed during the previous 24 hours using a photographic book and household measures (spoons, plates, cups and glasses) to correctly quantify portion sizes. Not only the type and amount of added fat, sugar, salt and other seasonings, the brand of the processed food and the name of the dishes was reported, but also the details about the culinary method, amount consumed recipes and foods eaten outside home.
To convert food into nutrients, Food Processor Plus® (ESHA Research Inc., Salem, OR, USA) was used. Although this informatic program uses U.S. Department of
Agriculture food composition table, including raw and/or processed foods, it was added raw composition food from Mozambican Food Composition Table (MFCT) (Korkalo, Hauta-alus et al. 2011) and either Portuguese Food Composition Table (INSA 2007) and Brazilian Food Composition Table (Costa, Decca et al. 2011) for foods which composition was not available in MFCT. For commercialized and typically Mozambican foods, nutritional labels and scientific sources (Oliveira and Carvalho 1975, Kalenga Saka and Msonthi 1994, Lago, Gomes et al. 2006, Komane, Olivier et al. 2011, Alam, Mohanty et al. 2012) were taken into account, respectively.
The food codes used were categorized into 13 major groups (Marrero, He et al. 2014) namely (1) cereal and cereal products (wheat bread, whole grain bread, potato and sweet potato, rice, pasta, corn, manioc, cornflour and flour), (2) meat products (red meat, pig, poultry, goat and processed meat), (3) sugar, preservatives and confectionery (sugar, sugary products and condensed milk), (4) fish and seafood dishes (fish, dried shrimp and crab), (5) vegetables (vegetables and cassava leaves), (6) milk and dairy (milk, cheese, yogurt and powdered milk), (7) beverages (sugary drinks, tea and coffee), (8) fruits, (9) eggs, (10) Oils and fats (olive oil, oil, butter, margarine, cream), (11) fast-food, (12) soups, (13) other foods (oleaginous fruits and beans). The contribution of these 13 groups to sodium was calculated. An additional analysis was performed to evaluate the contribution of each food group to total sodium intake only in participants who ingested foods included in that food group.
Beyond this categorization, it was also used Monteiro et al criteria (Monteiro, Levy et al. 2010) so that foods can be classified by the extent and purpose of their processing such as (1) unprocessed/minimally processed foods, (2) processed ingredients and (3) ultra-processed food products.
Nutritional variables such as energy, carbohydrates, fat, protein, sodium and potassium were also analysed through WHO recommendations: 15-30% of total energy for fat (WHO 2003), 55-75% of total energy for carbohydrates (WHO 2003), 10-15% of total energy from protein (WHO 2003), <2000 mg/day of sodium (WHO 2012) and ≥3500 mg/day of potassium (WHO 2012).
Anthropometry assessment
For weight and height measurements was used a SECA® digital scale with an embedded stadiometer, with the subject lightly clothed, barefooted, positioned in the centre of the balance so that weight can be distributed over both feet and with the head positioned in the Frankfort plan, according to standard and validated procedures
(Stewart, Marfell-Jones et al. 2006). Weight and height were determined to the nearest 0,1 kilogram and 0,1 centimetres, respectively. BMI was calculated by Quetelet Index (Garrow and Webster 1985) as weight (kilograms) divided by square of height (metres) and WHO cutoffs for BMI were used to define underweight (<18.5 Kg/m2), normal weight
(18.5-24.9 Kg/m2), overweight (25-29.9 Kg/m2) and obesity (≥30 Kg/m2) individuals
(WHO 2000). Waist circumference was measured to the nearest 0.1 cm, using a constant tension tape, directly over the skin or over light clothing, at the level of the midpoint between the inferior margin of the last rib and the iliac crest in the mid-axillary-line. For analysis, participants were classified as having abdominal obesity as more than 88 cm and 102 cm for women and men respectively, according to the Third Report of the National Cholesterol Education Program Expert Panel on Detection, Evaluation, and Treatment of High Blood Cholesterol in Adults (Expert Panel on Detection, Evaluation and Treatment of High Blood Cholesterol in Adults 2001).
Statistical analysis
Data analysis was conducted using Statistical Package for Social Sciences (SPSS), version 23 with a 0.05 level of significance (p-value) and 95% confidence intervals considered. Descriptive and inferential statistical method were used. The Kolmogorov-Smirnnov test was used to assess the assumption of normality. Independent Sample T-test or Mann Whitney U were performed to compare continuous variables and Chi-Square test was performed to compare categorical variables. Dietary sources of sodium were reported through thirteen food and beverages categories. A proportion to total food sodium or potassium was used to report results as mean percentage contribution of each category. Nutrients and food intake were also energy-adjusted according to residual method, and adjusted values were used to evaluate the differences between sexes.
Ethics
The study protocol was approved by the National Bioethics Commission for Health and written informed consent was obtained from all of the participants through the World Medical Association’s Declaration of Helsinki.
3. Paper
This dissertation includes the following publication that is going to be submtitted to publication:
Ana Queiroz, Albertino Damasceno, Pedro Moreira, Célia Novela, Nuno Lunet Patrícia Padrão. Dietary sources of sodium urinary sodium excretion in Maputo, Mozambique.
I was responsible for the definition of objectives, organization of data collection, as well as interpretation and discussion of the results. I actively participated in the elaboration of the final version of the article.
Urinary sodium and potassium excretion and dietary sources of sodium and in
Maputo, Mozambique
Urinary sodium and potassium excretion and dietary sources of sodium in
1Maputo, Mozambique
2Ana Queiroz1, Albertino Damasceno2,3, Pedro Moreira1,4,5, Célia Novela2, Nuno Lunet3,4 Patricia
3
Padrão1,4
4 5
1 Faculty of Nutrition and Food Sciences, University of Porto (FCNAUP), Porto, Portugal
6
2 Faculty of Medicine, Eduardo Mondlane University, Maputo, Mozambique
7
3 Department of Clinical Epidemiology, Predictive Medicine and Public Health, Faculty of
8
Medicine, University of Porto (FMUP), Porto, Portugal 9
4EPIUnit – Epidemiology Research Unit, Institute of Public Health, University of Porto
10
(ISPUP), Porto, Portugal 11
5 Research Centre in Physical Activity, Health and Leisure, Faculty of Sport, University of
12
Porto (CIAFEL), Porto, Portugal 13 14 15
Correspondence:
16 Patrícia Padrão 17Faculdade de Ciências da Nutrição e Alimentação da Universidade do Porto 18
Rua Roberto Frias, s/n 19 4200-465 Porto 20 Portugal 21 Telephone: +351 225074320 22 Fax: +351 225074329 23 E-mail: [email protected] 24 25
ABSTRACT:
2627
Objective: To evaluate the urinary excretion of sodium and potassium, and to estimate
28the main food sources of sodium intake in a sample of the Maputo inhabitants.
29Design:
A cross-sectional study using a convenience sample of one hundred
30Mozambican adults, belonging to different households, was assembled between October
312012 and May 2013. Sodium and potassium urinary excretion was assessed by a 24-h
32urine collection, and the coefficient of creatinine was used to validate completeness of
33urine collections. Food intake was assessed using a 24-h dietary recall and for the
34conversion to nutrients namely the sodium intrinsic in natural foods and sodium added to
35processed foods (non-discretionary sodium), the Food Processor software was used Salt
36added during culinary preparations (discretionary sodium) was estimated by the
37difference between urinary sodium excretion and non-discretionary sodium.
38Setting: Maputo, Mozambique.
39Subjects: one-hundred Maputo inhabitants aged 25 to 64 years (46 women and 54 men).
40Results: Eighty-one participants with complete urine collection were included in the
41analysis. The mean urinary sodium excretion was 4575 (Standard deviation, 2055)
42mg/day in women and 3965 (Standard deviation, 1549) mg/day in men, and 95% of
43women and 91% of men did not meet the WHO recommendations for sodium.
44Discretionary sodium contributed 71.8% and 56.3% of total dietary sodium intake, in
45women and men respectively, followed by sodium from processed foods (19.9% in
46women and 30.9% in men) and sodium intrinsic in natural foods (8.3% in women and
4712.8% in men).
48The mean urinary potassium excretion was 1844 (Standard deviation, 761) mg/day in
49women and 1995 (Standard deviation, 775) mg/day in men, and 97% of women and 95%
50of men did not meet the WHO recommendations for potassium.
51Conclusions: The great majority of the participants exceeded the recommended sodium
52intake and did not meet the recommendations for potassium intake. Discretionary sodium
53contributed with approximately two thirds to total sodium intake in this convenience
54sample of Maputo inhabitants.
5556
KEY WORDS: sodium; salt; urinary sodium; urinary potassium; Mozambique; Africa
5758 59
INTRODUCTION
6061
High sodium intake increases blood pressure and negatively affects endothelial
62and cardiovascular function, being positively associated with kidney disease, and
63cardiovascular morbidity and mortality
(1, 2).
64The upper limit for sodium intake recommended by the World Health
65Organization (WHO) is two grams per day [equivalent to five grams of salt (sodium
66chloride)/day]
(3), although data on population sodium intake around the world show that
67the intake far exceeds the recommendations
(4). Despite the lack of data on sodium intake
68in Mozambique the knowledge on the topic is of major relevance, given the high
69prevalence of hypertension (25-64 years: 33.1% in 2005)
(5)and the increasing public
70health impact of cardiovascular diseases (CVD) in this setting. In addition, potassium is
71another key nutrient, inversely associated with blood pressure, and whose relation with
72sodium intake should be taken into account (6) The WHO recommends a minimum
73potassium intake of 3510 mg/day and a sodium to potassium intake daily ratio of
74approximately one
(7).
75In the last decades, a steep increase in urbanization has been observed in
76Mozambique
(8). Along with urbanization, the globalization process rises and promotes
77
dietary changes. Most of the changes involves decreases in the consumption of foods rich
78in potassium such as legumes, fruits, vegetables, and a more frequent intake of processed
79foods frequently energy dense and rich in salt
(9). A previous study on culinary practices
80conducted with a sub-sample of the Maputo inhabitants of the present study, reported a
81large use of salt and chicken powdered stocks high in sodium
(10), the later reflecting the
82nutrition transition undergoing in Mozambique
(11, 12).
83It is expectable an increase of ultra-processed foods consumption, and
84consequently a rise in sodium intake. In addition to industrial foods, added salt in culinary
85preparations appears to be one of the most important contributors to the overall sodium
86intake in some populations, although the sources of sodium differ across countries and
87cultural settings
(5, 13, 14).
88The WHO set a target for countries to reduce population sodium intake by 30%
89toward 2000mg/d by 2025
(15), being essential the monitoring of sodium intake, and not
90less important the sodium to potassium ratio, across settings.
91We aimed to (i) evaluate the urinary excretion of sodium, potassium and sodium
92to potassium ratio; and (ii) to estimate the contribution of discretionary (sodium from salt
93added during culinary preparations) and non-discretionary sodium (sodium intrinsic in
94natural foods and sodium added to processed foods) to total sodium intake in a sample of
95the Maputo inhabitants. We aimed to (i) evaluate the urinary excretion of sodium; (ii) to
96estimate the main food sources of sodium and (iii) to quantify the contribution of
97processed/ultra-processed for total sodium intake in a sample of the Maputo inhabitants.
98METHODS
99100
Study Design
101For the present-community based cross sectional study, a convenience sample of one
102hundred Mozambican adults, aged 25 to 62 years and belonging to different households,
103was assembled between October 2012 and May 2013. A face-to-face interview using a
104structure questionnaires was conducted to collect information on demographic
105characteristics including sex, age, and education. Anthropometric measurements, a 24-h
106recall, and 24-hour urine were also collected.
107108
24 hour urine collection
109Participants were asked to complete a 24-hour urine collection. A container was
110supplied and they were carefully instructed (oral and written guidelines) to collect and
111complete a 24hour urine sample. They were taught to discard the first morning void and
112to collect all urine over the following 24-hour including the first void on the following
113morning, and the time of the start and finish collection was recorded in a questionnaire.
114Urine samples were analyzed for urinary creatinine (mg/day) (Jaffé reaction, Siemens
115Advia 1650), urinary sodium (mEq/day) (indirect ion-selective electrodes methodology,
116Siemens Advia 1800) through analytical methods. Although sodium excretion has been
117reported in mEq/day, it was converted to mg/day through their molecular weight for
118comparative purposes.
119For 24-hour urine collection validation, quality control was performed through urinary
120creatinine excretion in relation to body weight according to age group
(16). Values between
12114.4 and 33.6 for men and between 10.8 and 25.2 for women, were considered acceptable.
122The failure of this criterion (n=19) resulted in the exclusion of individuals of the final
123data analyses. Thus, the final sample consisted of 81 Mozambican adults (43 men) with
124valid urine collection.
125126
127
Dietary intake
129A 24-hour dietary recall referring to the day of urine collection was conducted by
130a trained interviewer. Participants were asked to report all foods and beverages consumed
131during the previous 24 hours using a photographic book and household measures (spoons,
132plates, cups and glasses) to quantify portion sizes. Not only type and amount of added fat,
133sugar, salt and other seasonings, the brand of processed food and the name of the dishes
134was reported, but also the details about the culinary method, recipes, amount consumed
135as well as foods eaten outside home. To convert food into nutrients, Food Processor Plus®
136was used. Although this software uses U.S. Department of Agriculture food composition 137
table, including raw and/or processed foods, it was added the raw composition food from
138Mozambican Food Composition Table (MFCT) and from the Brazilian Food
139Composition Table for foods which composition was not available in MFCT. For
140industrial food products, nutritional labels were used. The sodium intrinsic in natural
141foods and sodium added to processed foods (non-discretionary sodium), was then
142calculated and the salt added during culinary preparations (discretionary sodium) was
143estimated by the difference between urinary sodium excretion and non-discretionary
144sodium.
145 146Anthropometric measures
147For weight and height measurements a SECA® digital scale with and embedded
148stadiometer was used, with the subject lightly clothed, barefooted, positioned in the centre
149of the scale and with the head positioned in the Frankfort plan, according to standard
150procedures. Weight and height were determined to the nearest 0.1 kilogram and 0.1
151centimetres, respectively. Body mass index (BMI) was calculated by Quetelet Index as
152the weight (kilograms) divided by square of height (metres) and WHO cutoffs were used
153to define underweight (<18.5 Kg/m
2), normal weight (18.5-24.9 Kg/m
2), overweight
154
(25.0-29.9 Kg/m
2) and obesity (≥30 Kg/m
2) individuals
(17). Waist circumference was
155
measured to the nearest 0.1 cm, using a constant tension tape, directly over the skin at the
156level of the midpoint between the inferior margin of the last rib and the iliac crest in the
157mid-axillary-line. For analysis, participants were classified as having abdominal obesity
158as higher than 88 cm and 102 cm for women and men respectively
(18).
159160 161
Statistical analysis
162Data analysis was conducted using Statistical Package for Social Sciences (SPSS),
163version 23 with a 0.05 level of significance (p-value) and 95% confidence intervals
164considered. Independent Sample T-test and Mann–Whitney U test were performed to
165compare continuous variables and Chi-Square test was used to compare categorical
166variables. The final sample consisted of 81 Mozambicans with valid urine.
167168
Ethics
169The study protocol was approved by the National Bioethics Commission for
170Health and written informed consent was obtained from all of the participants through the
171World Medical Association’s Declaration of Helsinki.
172RESULTS
173Participants were on average 40 years old and approximately half of the sample
174reported up to seven schooling years (completed primary school). More than a half of the
175participants were classified as overweight and obese (Table I).
176The most frequently consumed food groups in the previous 24 hours were cereal
177and cereal products (100%), oils and fats (96%) and vegetables (89%), with a median
178intake of 396g (Standard deviation, 215g), 12g (Standard deviation 14g), 92g (Standard
179deviation 72g), respectively. 25% of the sample met the recommended intake of 400 g of
180fruit and vegetables.
181From dietary records, mean non-discretionary sodium intake was 1291 mg/d in
182women and 1731 mg/d in men (p=0.048).
183184
Insert Table I
185186
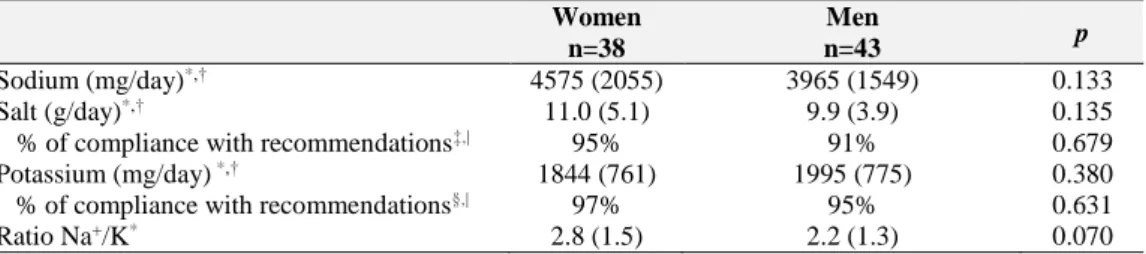
Results from urine collection are shown in Table II. The mean urinary sodium
187excretion was 4575 (Standard deviation, 2055) mg/day in women and 3965 (Standard
188deviation, 1549) mg/day in men, and 95% of women and 91% of men did not meet the
189WHO recommendations for sodium. The mean urinary potassium excretion was 1844
190(Standard deviation, 761) mg/day in women and 1995 (Standard deviation, 775) mg/day
191in men, and 97% of women and 95% of men did not meet the WHO recommendations
192for potassium.
193Mean urinary sodium/potassium ratio was 2.8 (Standard deviation, 1.5) for
194women and 2.2 (Standard deviation, 1.3) for men.
195196
Insert Table II
197198
Overall, sodium from salt added during culinary preparations was the largest
199contributor to total sodium intake (71.8% in women and 56.3%), followed by salt from
200processed foods (19.9% in women and 30.9% in men) and sodium intrinsic in food (8.3%
201in women and 12.8% in men) (Figure 1).
202203
Insert Figure 1
204DISCUSSION
205To the best of our knowledge, this is the first study on sodium intake in a
206Mozambican population, using 24-hour urinary sodium excretion. Our results have shown
207that 93% of participants exceeded the recommended sodium intake, being the mean intake
208more than the double endorsed by the WHO
(3). Sodium from salt added in culinary
209preparations contributed with almost two thirds to total sodium intake in this setting.
210Although data on sodium excretion in sub-Saharan countries are scarce, a recently
211published systematic review and meta-regression analyses reported that in some adult
212populations such as South Africa, Tanzania and Ghana, sodium intake was above 2 g, in
213accordance with the present study. It has been reported that populations from sub-Saharan
214African countries are more vulnerable to the effects of a high sodium diet than other
215populations due to genetic factors and the greater prevalence of inter-uterine growth
216restriction
(19). However, it has been documented that a reduction in sodium intake of 100
217mmol/d contributes to a 2.3 mmHg reduction in BP
(20)which is expected to decrease
218stroke mortality, ischemic heart disease and other vascular diseases
(13).
219No significant differences between sexes were observed regarding sodium
220excretion, in this study in accordance to what has been described in other sub-Sharan
221African countries
(19). However, in a worldwide systematic review mean sodium intake
222
was always lower in women, the difference between sexes ranging from 8.9% in South
223Asia to 10.7% in Western Europe
(21). In the latter study, estimated sodium intakes ranged
224
from 2.18 g/day in Eastern Sub-Saharan Africa to 4.80g/day in Asian regions
(21).
225Discretionary salt was the leading main source of sodium intake in accordance
226with other studies conducted in different countries
(14, 22)including South Africa
(23), Japan
227and China
(24, 25). On the contrary, in European and North American countries sodium
228intake is dominated by sodium added by industry in processed/ultra-processed foods
(26).
229Even though discretionary salt was the main source of sodium in this study, it is
230expectable an increase in the consumption of ultra-processed foods
(27)along with
231globalization.
232In addition to high sodium intake, a low intake of potassium, which is inversely
233related to blood pressure and to the risk of stroke
(28)was also observed. Our data on
234urinary potassium excretion was well below the minimum value recommended by the
235WHO. Diets high in processed foods, which reduces the natural amount of potassium in
236many food products, and low in fresh fruits and vegetables contribute to lower values of
237potassium intake
(29).
238239
The ratio between sodium and potassium daily intake can easily assess dietary
240changes over time and identify populations at high risk for nutrition-related chronic
241disease, once an elevated sodium/potassium ratio is associated with higher blood
242pressure
(30)and increased risk of CVD
(31). In our study, mean sodium/potassium ratio was
243
above the WHO recommendations that suggest a ratio of approximately one to one, which
244is considered beneficial for health
(28). Our results are consistent with the ones recently
245published about sodium and potassium intake in South Africa: 77% consumes more than
2465g salt/day, 93% of the population did not meet the potassium recommendations and
247median sodium to potassium ratio was 3.5 (even higher than our median ratio)
(32). This
248result reinforces the need to decrease the intake of sodium and increase potassium in
249Mozambique.
250The 24-hour urine collection, the major strength of our study, is considered to be
251the clinical gold standard to assess sodium intake
(22, 33-36)since 90% of ingested sodium
252is excreted in the urine
(36). Besides rigorous validation through urinary creatinine
253excretion, which shrunk bias stemming from under or over collection, more than a single
25424-hour urine collection should have been obtained from each participant to decreased
255daily variability.
256Sodium reduction is considered to be cost effective and one of the top 10 “best
257buys” interventions for preventing non-communicable diseases (NCDs)
(13, 20). It is also
258
important to note that the effects of sodium reduction on blood pressure tend to be greater
259in blacks, and in hypertensive subjects, which would be of great importance in
260Mozambique given the high proportion of hypertensive subjects not controlled
(37).
261
In the WHO Global Action Plan for the Prevention and Control of
Non-262Communicable Diseases 2013-2020, one of the key target is to make a 30% relative
263
reduction of sodium intake
(15). In Sub-Saharan countries under epidemiological and
264nutritional transitions it gets further relevance since it is expected an increase of
265globalization which is frequently associated with dietary changes including the increase
266of sodium rich and potassium poor foods.
267Preventative strategies focused on salt reduction become the best approaches
(19).
268
In a very recent systematic review about salt reduction initiatives around the world is
269shown that Eastern Mediterranean, South-East Asia and Africa are the three regions with
270the least salt reduction activity and where the NCDs are projected to increased most
(38).
271Implementing a salt reduction programme such as the successful one in the United
272Kingdom (15% reduction in the average salt intake) and already followed by other
273countries namely United States, Canada and Australia, would be a great step
(39). The
274emerge interventions on salt intake reduction in the sub-Saharan Africa region were
275applied in South Africa (through legislation to make the food industry reduce the salt
276content of selected products) and in Mauritius (through salt reduction in bread)
(14).
277Setting targets for population salt intake and developing a salt reduction strategy
278involving different stakeholders namely the government and the food industries, may
279contribute to decrease sodium intake in Mozambique. Measures to regulate the sodium
280content in processed foods, along with campaigns to rise the population awareness on
281healthy eating, anticipating an expected shift towards a more “industrialized” food pattern
282may be beneficial. Strategies to improve fruit and vegetable consumption would thus
283increase potassium intake as well as other beneficial health effects.
284CONCLUSION
286The majority of the participants far exceeded the recommended sodium intake and
287did not meet the recommendations for potassium intake. Sodium from salt added to
288culinary preparations contributed with almost two thirds to total sodium intake in this
289convenience sample of Maputo inhabitants. Implementing strategies to decrease sodium
290and increase potassium intake should be implemented in order to prevent NCDs in
291Mozambique.
292REFERENCES
293294
1. He FJ, MacGregor GA. A comprehensive review on salt and health and current 295
experience of worldwide salt reduction programmes. Journal of human hypertension. 296
2009;23(6):363-84. 297
2. Poggio R, Gutierrez L, Matta MG, Elorriaga N, Irazola V, Rubinstein A. Daily sodium 298
consumption and CVD mortality in the general population: systematic review and meta-analysis 299
of prospective studies. Public health nutrition. 2015;18(4):695-704. 300
3. WHO. Sodium intake for adults and children. Geneva, Switzerland: Worl Health Of 301
Organization, 2012. 302
4. Elliott; P, Brown I. SODIUM INTAKES AROUND THE WORLD. World Health Organization, 303
2007. 304
5. Damasceno A, Azevedo A, Silva-Matos C, Prista A, Diogo D, Lunet N. Hypertension 305
prevalence, awareness, treatment, and control in mozambique: urban/rural gap during 306
epidemiological transition. Hypertension. 2009;54(1):77-83. 307
6. World Health Organization. Guideline: Potassium intake for adults and children. Geneva: 308
WHO, 2012. 309
7. Guideline: potassium intake for adults and children. Geneva: World Health Organization 310
(WHO); 2012. 311
8. Urban population (% of total). United Nations, World Urbanization Prospects. The World 312
Bank 2016 [cited 201 September]. Available from:
313
http://data.worldbank.org/indicator/SP.URB.TOTL.IN.ZS. 314
9. Popkin BM. Contemporary nutritional transition: determinants of diet and its impact on 315
body composition. The Proceedings of the Nutrition Society. 2011;70(1):82-91. 316
10. Silva V, Santos S, Novela C, Padrão P, Moreira P, Lunet N, et al., editors. Some 317
Observations on Food Consumption and Culinary Practices in Maputo, Mozambique. 8th 318
International Conference on Culinary Arts and Sciences Global, National and Local Perspectives; 319
2013. 320
11. Gomes A, Damasceno A, Azevedo A, Prista A, Silva-Matos C, Saranga S, et al. Body mass 321
index and waist circumference in Mozambique: urban/rural gap during epidemiological 322
transition. Obesity reviews : an official journal of the International Association for the Study of 323
Obesity. 2010;11(9):627-34. 324
12. Gomes J, Damasceno A, Carrilho C, Lobo V, Lopes H, Madede T, et al. Determinants of 325
early case-fatality among stroke patients in Maputo, Mozambique and impact of in-hospital 326
complications. International journal of stroke : official journal of the International Stroke Society. 327
2013;8 Suppl A100:69-75. 328
13. Eyles H, Shields E, Webster J. Achieving the WHO sodium target: estimation of 329
reductions required in the sodium content of packaged foods and other sources of dietary 330
sodium. 2016;104(2):470-9. 331
14. Sookram C, Munodawafa D, Phori PM, Varenne B, Alisalad A. WHO's supported 332
interventions on salt intake reduction in the sub-Saharan Africa region. Cardiovascular diagnosis 333
and therapy. 2015;5(3):186-90. 334
15. WHO. Global action plan for the prevention and control of NCDs 2013-2020. Geneva, 335
Switzerland: 2013. 336
16. Remer T, Neubert A, Maser-Gluth C. Anthropometry-based reference values for 24-h 337
urinary creatinine excretion during growth and their use in endocrine and nutritional research. 338
The American journal of clinical nutrition. 2002;75(3):561-9. 339
17. WHO. Global Database on Body Mass Index. BMI Classification: World Health 340
Organization; 2000 [cited 2016 7th january].
341
18. Executive summary of the third report of the national cholesterol education program 342
(NCEP) expert panel on detection, evaluation, and treatment of high blood cholesterol in adults 343
(adult treatment panel iii). JAMA. Expert Panel on Detection, Evaluation and Treatment of High 344
Blood Cholesterol in Adults 2001;285(19):2486-97. 345
19. Oyebode O, Oti S, Chen Y-F, Lilford RJ. Salt intakes in sub-Saharan Africa: a systematic 346
review and meta-regression. Population Health Metrics. 2016;14:1. 347
20. Zarocostas J. WHO lists “best buys” for cutting deaths from non-communicable disease. 348
BMJ. 2011;342. 349
21. Powles J, Fahimi S, Micha R, Khatibzadeh S, Shi P, Ezzati M, et al. Global, regional and 350
national sodium intakes in 1990 and 2010: a systematic analysis of 24 h urinary sodium excretion 351
and dietary surveys worldwide. BMJ Open. 2013;3(12). 352
22. Xu J, Wang M, Chen Y, Zhen B, Li J, Luan W, et al. Estimation of salt intake by 24-hour 353
urinary sodium excretion: a cross-sectional study in Yantai, China. BMC Public Health. 354
2014;14:136-. 355
23. Charlton KE, Steyn K, Levitt NS, Zulu JV, Jonathan D, Veldman FJ, et al. Diet and blood 356
pressure in South Africa: Intake of foods containing sodium, potassium, calcium, and magnesium 357
in three ethnic groups. Nutrition (Burbank, Los Angeles County, Calif). 2005;21(1):39-50. 358
24. Stamler J, Rose G, Stamler R, Elliott P, Dyer A, Marmot M. INTERSALT study findings. 359
Public health and medical care implications. Hypertension. 1989;14(5):570-7. 360