A Work Project, presented as part of the requirements for the Award of a Master Degree in
Management from the NOVA – School of Business and Economics, in accordance with the Double
Degree Program (LUISS Guido Carli)
Relationship between top executive compensation and
corporate governance: evidence from large Italian listed
companies
Andrea Nannicini 3644
A Project carried out on the Master in Management Program under the supervision of:
Prof. Duarte Pitta Ferraz and Prof. Ilídio Tomás Lopes
Abstract
The research investigates the impact of corporate governance variables –ownership, board of directors and remuneration committee– on executive compensation. A balanced sample of 52 Italian listed companies has been adopted to test the hypotheses, covering 55.98% and 47.13% of market capitalization in 2011 and 2015 respectively and including 669 board members. Theoretical models evidence a certain stability of compensation schemes for Italian managers over time. Findings suggest that there is a statistically significant positive effect of familiar ownership on the amount of compensation. Along with nature of ownership, the number of directors in the remuneration committee appointed by minorities assume a determinant role. With statistical significance, it affects negatively the compensation level, but, contrarily to best practices, it affects negatively the adoption of forms of incentive compensation.
Keywords: executive compensation; corporate governance; remuneration committee; family firms
1 Introduction
The huge number of studies about the level and the structure of top management remuneration testifies the interest of this topic among academics, corporate governance experts, politicians, media and public opinion. The relationship between board and executive compensation has been over time one of the most discussed topics in the literature about corporate governance. In recent years, and in particular after the financial crisis of 2008, this topic has been object of particular attention: increase in the amount of executive pay, mixed by a debatable relation between these payments and firm performance of short and medium-long term, drove the analysis of the phenomenon not only by American scholars, but also by researchers of many other countries. Main inquisitiveness is related to the will to understand the determinants of remuneration systems developed and employed by large firms to remunerate their top executives. Inside this broad research, a growing attention has been committed to the influence exercised by variables of corporate governance on remuneration policies. The vast majority of studies related to executive compensation and equity-based remuneration is centred primarily in US, and only to a smaller extent in UK. In these countries, disclosure of
top executive compensation has been mandated by law before than in other countries1. Little evidence is provided for companies in Continental Europe, although these represent a peculiar case, with high ownership concentration and a large adoption of control-enhancing devices (Barontini and Bozzi, 2011). These features assume particular interest in their expected effect on the structure and amount of executive compensation. This research can be inserted in the stand of literature that studies the corporate governance mechanisms in non-Anglo-Saxon countries. Focus of this work is indeed related to Italian listed companies. They represent a peculiar sample due to their similarities in terms of ownership characteristics, corporate governance issues and agency problems, with respect to much of listed firms in Continental Europe countries. The peculiar environment in terms of corporate governance system is characterized by “weak managers, strong block holders and unprotected minority shareholders” (Melis, 2000, page 354). Zattoni (1999) emphasizes the peculiar distribution of shareholding: the ownership structure is highly concentrated and, in much of cases, the main shareholder is represented by a family or by a public entity. Banks and other financial institutions assume rarely the role of large shareholders, without exerting a significant influence on companies (Bianchi et al. 2010). Additionally, Italian stock market is still small and undeveloped if compared to other countries, with a market for corporate control that is almost absent (Bianco, 2001). In past decade, Italian companies have been interested by the large wave of recommendations2 promoted by the European Commission. The modernization of corporate law was promoted with the aim to align the interests of managers with those of companies, with a new discipline of internal control and with an enforcement of shareholder rights of information. Main outcomes of the regulations have been the mandatory disclosure of remuneration policies through remuneration reports and the introduction of a remuneration committee inside the board of directors,
1 In US: Securities and Exchange Commission, “Executive compensation disclosure, Security holder lists and mailing
request” (1992). In UK: Cadbury Committee, “Report of the Committee on the Financial Aspects of Corporate Governance” (1992).
2 Recommendation 2004/913/CE suggested for listed companies a remuneration report describing the guidelines of next
year remuneration policies and providing a recap of that of previous year. Forms of variable compensation should be approved in Shareholder Meeting. Recommendation 2005/162/CE advises the composition inside the board of directors of a compensation committee, formed for the most part by non-executive and independent directors. Concerning stock options plans, the Commission suggested a vesting period of at least three years and the obligation for directors to maintain a certain amount of stocks until the end of their mandate. Clawback clauses were additionally indicated. Recommendation 2009/385/CE was moved by the aim to emphasize the relevance of compensation committee, considering the presence of at least one expert in terms of compensation inside the committee and the possibility to adopt external consultants.
appointed with the responsibility to monitor and support the board in the definition of executive compensation plans. This normative evolution paves the way for the analysis of new corporate governance mechanisms as determinants of executive compensation schemes, offering the author the possibility to provide new evidences to the current literature. In detail, the research is moved by the intention to discover the impact of remuneration committee features on the definition of executive compensation, attempting to provide insights about a possible evolution of the remuneration policies over time following the Self-Discipline Code criteria of equilibrium between fixed and variable compensation. Along with remuneration committee variables, composition of the board of directors, ownership structure and nature will be studied as determinant of executive compensation. The work will be structured as follow: the first part will provide an overview of the existing literature, inserting the compensation of executives in the wider panel of agency problems and indicating the possible governance mechanisms influencing remuneration schemes. Research questions will be drawn in this section. The second part will convey the empirical research, with a specification of sample and data collection method, preliminary tests performed and a description of variables adopted. Descriptive and empirical results will be finally provided. Last section will provide conclusions, with a list of study limitations and suggestions for further research.
2 Literature review and development of hypotheses
Executive remuneration can be explained by two divergent theories. According to optimal contracting theory (Jensen and Murphy, 1990), the board of directors operates independently by management, setting the level and the composition of executive compensation. In line with this view, remuneration packages are designed to minimize agency problems and maximize shareholders value. Relevance is attributable to variable compensation that anchors the level of compensation to performance results and share value. Although this positive aspect, Jensen et al. (2004, page 50), noted that “while remuneration can be a solution to agency problems, it can also be a source of agency problems”. Bebchuck et al. (2002) provide evidence of the fact that executives, due to their position of power within firms, are able to achieve excessive remuneration in the form of rents. The design of executive compensation structure seems consequently not related to an optimal
contracting, but rather to rent-extracting reasons. Both the optimal contracting and rent extraction theories directly recall the main theoretical perspective adopted to in the scholarly research about director remuneration. This is the economic one, that relies on agency theory. The analysis of agency problems theory assumes peculiar relevance in the context of block holder-dominated firms, with a specific reference to family firms, that represent a significant panel inside the broader set of Italian listed companies. Bech, Bolton and Röell (2003, page 3) define corporate governance as “the reconciliation of conflict of interest between various corporate claimholders”. The first and more studied agency problem is that described by Fama and Jensen (1983): the separation of ownership and control implies a direct conflict of interest between principal (owner) and agent (managers). In public listed firms, characterised by the absence of large block holders, shareholders delegate managers to act in their behalf. When decision making is delegated to managers, shareholders’ ability to monitor their behaviours is reduced (Shleifer and Visnhy, 1997), implying an increase of the risks that management abuses of its power. When ownership is highly concentrated, there is a greater possibility that owners (generally single person or small groups) are more incentivised to monitor executives so that they do not deviate by their objectives. In this context, ownership concentration works as a mechanism to mitigate Agency Problem I and family ownership is a peculiar case within it. Since their own wealth is at stake, family shareholders are more dedicated and effective monitors with respect to other kinds of shareholders. In contrast, different sorts of controlling shareholders, such as public entities, banks or other institutions, appear less prone to monitor managers, since they assume the form of agent for their respective super-principals. A wide set of corporate governance mechanisms is adopted in corporations to mitigate agency problems (OECD, 2015) and executive compensation is one of the most relevant: as emphasized by Jensen and Murphy (1990), well-designed contracts offer ex-ante an alignment of managers’ and owners’ interests. Between agency costs for the firm, a larger panel of mechanisms is supposed to affect the remuneration of board of directors and of executives: ownership concentration, board of directors and its subcommittee. As pointed out by Dyl (1998), in companies with a greater ownership concentration, majority shareholder is in the position to be both incentivised and endowed of decisional power to influence
managerial choices, among which executive remuneration. According to Barontini and Bozzi (2011), a more concentrated ownership, increasing the directors’ incentives to maximize firm value, is assumed to decrease rent extraction to the detriment of shareholders. Haid and Yurtoglu (2006) demonstrated that the level of executive compensation is negatively associated with the number of shares owned by large shareholders. Academic research has not only been focused on the amount of compensation, but also in the sensitivity of this last to corporate performance. Mehran (1995) noted a negative association between CEO pay-sensitivity and the existence of significant block holders. As previously described, with respect to the kind of controlling shareholder, Italian firms represent a peculiar example. Lack of clarity is associated with familiar ownership: a larger commitment of family members in the management of the company can be reflected in a lower compensation with respect to non-family firms. Carrasco-Hernandez and Sanchez-Marin (2007) pointed out that in family firms is more frequent for CEOs a lower total pay but a higher risk protection. This aspect is emphasized by the research of Combs et al. (2010), which propose, in line with stewardship theory3, the role
of CEO as steward that accepts to receive lower levels of compensation in exchange for job security. Croci et al. (2012) analysis, based on a sample from 14 European countries, empirically demonstrates that CEO total compensation is limited by the presence of controlling family shareholders. On the contrary, executive role can be considered as a tool to guarantee highly-remunerated positions to descendants of founder (Barontini and Bozzi, 2011), implying an opposite conclusion. Haid and Yurtoglu (2006) uncovered a positive association between management compensation and family ownership. Different hypotheses can be identified to stress the relationship between ownership concentration and executive compensation structure and sensitiveness:
- Hypothesis 1: The larger the percentage of shares owned by the largest block holder, the lower is the
total compensation of executives.
- Hypothesis 2a: The presence of family ownership implies greater compensation of executives.
3 It is worth to mention the stewardship theory, since it is one of the theories counterposed to the agency one by scholars. In
line with this thesis, managers are not seen as opportunistic agents with the aim to maximize their individual utility. Rather, interests of these agents are largely aligned with those of principals (Donaldson, 1990).
- Hypothesis 2b: The presence of family ownership is associated with greater proportion of fixed
compensation over the total one.
Previous literature (Sykes, 2002; Jensen et al. 2004; Conyon and He, 2004) pointed out that the role of the board of directors as influent determinant of executive remuneration. The board represents indeed the first internal corporate governance mechanism with the responsibility to set and monitoring management compensation (Gomez-Meija et al., 1997), representing the shareholders and acting as a defence tool against opportunistic managers. In line with OECD Principles (2015, par. VI), boards must be able to exercise objective and independent judgment, in order to fulfil their responsibilities. Bebchuck et al. (2002), noted that ineffective boards of directors, due to significant power of corporate insiders, are unable to exercise an independent judgment and encourage rent extraction. On the contrary, and in parallel, Tosi and Gomez-Mejia (1989), empirically demonstrated that a greater control exercised by the board of directors reduces the influence of CEO on the process of definition of its compensation. Enriques and Volpin (2007) pointed out that, in case of large block holder dominated firms, the existence of independent directors appointed by minority lists of shareholders increases the accountability of management and of the large shareholders it is appointed by. These directors do not enjoy any private benefit of control, are incentivised to operate independently (Bebchuck et al. 2010) and can consequently represent a significant monitoring tool over executive compensation (Sun and Cahan, 2009). To assess the effects of board monitoring on executive compensation, variables such as the size of the board or the share of independent directors, have commonly been used by academics. Relevance in this work is assumed by the number of independent directors, as well as the number of them appointed by minority lists of shareholders. These variables give rise to the following hypotheses:
- Hypothesis 3a: The larger the number of independent members in the board of directors, the greater is
- Hypothesis 3b: The larger the number of independent members appointed by minority lists of
shareholders in the board of directors, the greater is the portion of incentive compensation tools over the total compensation.
Beyond the independence of the board, the presence of a remuneration (or compensation) committee can contribute in the reduction of executives’ power in the definition of their compensation schemes. This committee can conduct more efficiently its task if composed only by independent directors (Altomare and Zattoni, 2013). This point has been emphasized by the Italian Corporate Governance Committee, that in the revised Self-discipline Code (Art. VI) indicates as best corporate governance practice the introduction of a remuneration committee, composed for the most part by non-executive and independent directors. Lack of independence in the composition of remuneration committee implies, according to Bebchuk and Fried (2006) an increase of managerial power and the impossibility to safeguard the interests of shareholders in the negotiations of pay arrangements with executive directors. It causes the possibility for executive directors to extract a rent (Bebchuck et al. 2002), intensifying the Agency Problem I. This issue has been mentioned by Melis et al. (2012) and Altomare and Zattoni (2013) as the “risk that executive directors write their own remuneration contract with one hand and then sign it with the other one”. With respect to studies that examine the relationship between executive compensation and the board of directors in its entirety, the role of subcommittees was addressed by a relative paucity of studies. Vafeas (2003) highlighted some evidence about a large presence of outside directors in compensation committee and a lower amount of fixed pay, compared to a more significant amount of contingent pay in CEO compensation schemes. Sun and Cahan (2009) demonstrated that CEO cash compensation is positively associated with accounting earnings in case of greater compensation committee quality. On the other hand, different studies were not able to point out a significant association between independence of compensation committee and compensation practices. Anderson and Bizjack (2003) were not able to find a statistically significant relationship between CEO compensation sensitivity to firm performance and independence of remuneration committee. This lack of
unambiguous evidence on the issue opens space to further research. With respect to compensation committee we expect that:
- Hypothesis 4a: The larger the number of independent members in the remuneration committee, the
greater is the portion of incentive compensation tools over the total compensation.
- Hypothesis 4b: The larger the number of independent members appointed by minority lists of
shareholders in the remuneration committee, the greater is the portion of incentive compensation tools over the total compensation.
To understand the effective reception of the European Commission recommendations in Italian listed companies since the modification of the Self-Discipline Code, a new hypothesis is developed:
- Hypothesis 5: The reception of recommendations by Italian listed companies produced changes in the
pay mix of executive directors over time between 2011 and 2015.
3 Methodology
3.1 Data and sample selection
One of the major reasons that explain the lack of empirical researches for top management compensation in Europe, and particularly in Italy, is the scarce availability of data about executive pay. A remuneration report for Italian listed companies is mandatory only starting from the year 2011. Before, data about executive compensation were disclosed in companies’ annual reports, without the current level of detail provided by individual documents and with “cryptic” information about stock options. The current research is based on 52 non-financial organizations listed on Italian Stock Exchange, considering data disclosed in 2011 and 2015, representing the 55.98 and 47.13 percent of Italian Market capitalization. The first year is the one in which the recommendations of European Commission has been adopted in Italy, while the latter is the last available period in which companies published remuneration reports. Analysing the quality of information disclosed by firms in their remuneration reports, what appeared clear to the author is that it is indirectly related to size of the company. Consequently, a balanced sample composed of large firms has been adopted in the analysis. This sample, although small at a first impression, gave the author the possibility to gather data for
669 executives and strategic directors over the two years considered in the research. Information about ownership structure and board composition was hand-collected using corporate governance reports of firms, while control variables data were collected on Bloomberg. As mentioned, this research is moved by the aim to analyse the effect of ownership, board of directors and remuneration committee on executive compensation. For executive chairman and vice-chairman, chief executive officer (CEO), executives and strategic directors, the dependent variable total compensation (COMP) was computed as the sum of fixed compensation, bonuses and other incentives, benefits, long terms incentive plans (corresponded and deferred in cash) and the fair value of stock grants and (phantom) stock options. Compensation granted by participated companies was not considered in the computation of total compensation4. Considering that larger firms may be characterised by more executive directors in their boards or more strategic directors, the risk to consider a biased larger total compensation was solved calculating a sum of average compensation for each category of executives mentioned. As in Sakawa et al. (2012), different incentive ratios are defined as the percentage of total compensation represented by forms of incentive compensation. The denominator of computed ratio is always the total compensation while the numerator is variable. For IR_CASH the numerator is represented by cash incentive compensation, computed as sum of short and long-term cash bonuses. The variable IR_FV considers the fair value of stock grants and (phantom) stock options. IR_SHORT was considered as the ratio of short term bonuses and total compensation, while IR_LONG evaluates the proportion of long term incentives (sum of long term incentive plans and fair value tools) over total compensation5. With respect to explanatory variables, MAJ_OWN represent the number of shares owned by the first larger shareholder, divided by the total amount of issued shares, while the binary variable MAJ_FAMILY classifies companies as family firms or not. BD_IND and BD_MIN represent the number of independent and minority directors in the board; RC_IND and RC_MIN were built with the same logic considering the remuneration committee
4 In the opinion of the author, a possible bias could arise: identical companies, whose only difference is represented by the
participation of one company executives in the management of a subsidiary, would present different compensation schemes for their executives and strategic directors.
5 The same logic adopted for total compensation has been implemented to compute incentive ratios: the sum of average
composition. The variables ROE (measured as ratio between net income and total shareholder equity),SIZE (measured as the logarithm of total assets), and MTB (measured as logarithm of market-to-book ratio and proxy for growth opportunities) were entered in the models as control variables. Following the method adopted by Melis et al. (2012), a dummy variable (INDUSTRY) was introduced to consider whether the companies analyzed can be classified as industrial or not. A detailed description of variables is provided in Table 1A in the appendix. Based on the variables identified, a generic theoretical equation has been structured as follow:
𝐷𝑒𝑝𝑒𝑛𝑑𝑒𝑛𝑡 𝑣𝑎𝑟 = 𝛽0+ ∑𝑛𝑖=1𝛽i 𝑖𝑛𝑑𝑒𝑝𝑒𝑛𝑑𝑒𝑛𝑡 𝑣𝑎𝑟i + ∑𝑚𝑗=1𝛽j 𝑐𝑜𝑛𝑡𝑟𝑜𝑙 𝑣𝑎𝑟j + 𝜀 [1]
Following the methodology adopted by Lopes and Ferraz (2016), a set of tests was performed to ensure the eligibility of the sample for its application in multiple regressions (Cohen et al. 2013). The statistical programs R© and SPSS© have been adopted for the development of the models. To understand whether the distribution of the errors presents a variance that remains similar when moving along the line of residuals, a test for homoscedasticity was performed through “Non-constant Variance Score Test” function in R©. What emerged by this test, is that none of the regressions present the problem of heteroscedasticity, but those related to the dependent variable IR_LONG. The variable has consequently been excluded by the development of the models6. To verify lack of multicollinearity among independent variables, the variance inflation factors were observed. Since moderate correlation (VIF close to 5) was detected in case variable RC_SIZE (computed as the total number of directors in the remuneration committee)was considered in the models, the decision was to exclude this regressor by the analysis, to focus the attention on independent and minority directors of the committee. Additionally, following the model of Melis et al. (2012), the correlation between the number of independent directors appointed by minority lists of shareholders and the presence of at least one in the remuneration committee led the author to study with different models the impact of board of directors and compensation committee on executive compensation. Lack of heteroscedasticity and absence of
6 This choice is justifiable by the fact that the elimination of outliers would have caused a reduction of the already small
multicollinearity allowed the author not to eliminate observations from the sample, considering all selected 52 companies in the empirical models.
3.2 Descriptive and correlation measures
According to the classification provided by Borsa Italiana report, companies adopted as sample for this study operates in 7 macro sectors. Industials macro-sector represents the 32.69% of the total sample, followed by
Consumer Goods and Utilities, which respectively accounts for the 21.15% and the 17.3% of the sample. A
medium weight is assumed by Consumer Services companies, that represent the 13.46% of the sample. A smaller relevance is assumed by companies operating in Oil and Gas, Health care and Telecommunications macro-sectors, representing in order the 7.69%, the 5.77% and the 1.92% of the total sample.
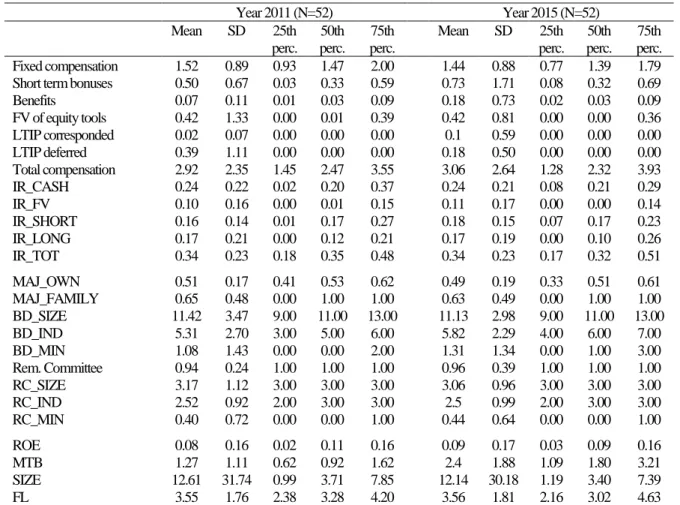
Table 1: Descriptive statistics
Year 2011 (N=52) Year 2015 (N=52) Mean SD 25th perc. 50th perc. 75th perc. Mean SD 25th perc. 50th perc. 75th perc. Fixed compensation 1.52 0.89 0.93 1.47 2.00 1.44 0.88 0.77 1.39 1.79 Short term bonuses 0.50 0.67 0.03 0.33 0.59 0.73 1.71 0.08 0.32 0.69 Benefits 0.07 0.11 0.01 0.03 0.09 0.18 0.73 0.02 0.03 0.09 FV of equity tools 0.42 1.33 0.00 0.01 0.39 0.42 0.81 0.00 0.00 0.36 LTIP corresponded 0.02 0.07 0.00 0.00 0.00 0.1 0.59 0.00 0.00 0.00 LTIP deferred 0.39 1.11 0.00 0.00 0.00 0.18 0.50 0.00 0.00 0.00 Total compensation 2.92 2.35 1.45 2.47 3.55 3.06 2.64 1.28 2.32 3.93 IR_CASH 0.24 0.22 0.02 0.20 0.37 0.24 0.21 0.08 0.21 0.29 IR_FV 0.10 0.16 0.00 0.01 0.15 0.11 0.17 0.00 0.00 0.14 IR_SHORT 0.16 0.14 0.01 0.17 0.27 0.18 0.15 0.07 0.17 0.23 IR_LONG 0.17 0.21 0.00 0.12 0.21 0.17 0.19 0.00 0.10 0.26 IR_TOT 0.34 0.23 0.18 0.35 0.48 0.34 0.23 0.17 0.32 0.51 MAJ_OWN 0.51 0.17 0.41 0.53 0.62 0.49 0.19 0.33 0.51 0.61 MAJ_FAMILY 0.65 0.48 0.00 1.00 1.00 0.63 0.49 0.00 1.00 1.00 BD_SIZE 11.42 3.47 9.00 11.00 13.00 11.13 2.98 9.00 11.00 13.00 BD_IND 5.31 2.70 3.00 5.00 6.00 5.82 2.29 4.00 6.00 7.00 BD_MIN 1.08 1.43 0.00 0.00 2.00 1.31 1.34 0.00 1.00 3.00 Rem. Committee 0.94 0.24 1.00 1.00 1.00 0.96 0.39 1.00 1.00 1.00 RC_SIZE 3.17 1.12 3.00 3.00 3.00 3.06 0.96 3.00 3.00 3.00 RC_IND 2.52 0.92 2.00 3.00 3.00 2.5 0.99 2.00 3.00 3.00 RC_MIN 0.40 0.72 0.00 0.00 1.00 0.44 0.64 0.00 0.00 1.00 ROE 0.08 0.16 0.02 0.11 0.16 0.09 0.17 0.03 0.09 0.16 MTB 1.27 1.11 0.62 0.92 1.62 2.4 1.88 1.09 1.80 3.21 SIZE 12.61 31.74 0.99 3.71 7.85 12.14 30.18 1.19 3.40 7.39 FL 3.55 1.76 2.38 3.28 4.20 3.56 1.81 2.16 3.02 4.63
Table 1 reports descriptive statistics of variables analysed. Data for firm size are reported in billion €, while compensation ones are
Regarding ownership structure, the situation appears quite stable between 2011 and 2015: the presence of large block holders is testified by an average 50% of shares directly or indirectly attributable to a single larger shareholder. Of the sample analyzed, more than 60% of companies are family firms. The same stability is present when board composition is considered: on average, board of directors for Italian companies selected in the sample is composed by 11 members (on average 11.42 and 11.13 respectively in 2011 and 2015). Independent directors represent on average half of the board, showing a little increase over time (46% in 2011 and 52% in 2015). Number of minority independent directors showed an increase (21.43%) during the period. Concerning the remuneration committee, it was instituted by 46 companies in 2011 (94% of the sample) and added to its corporate governance structure by only one company in 2015 (47 companies, 96% of the sample). This large adoption, in line with Self-Discipline Code, drove the author to exclude the presence of remuneration committee as independent variable in the models. In line with corporate governance best practices, remuneration committee results composed for the majority by independent directors (79% in 2011 and 82% in 2015), while only a little proportion is represented by minority directors (13% in 2011 and 14% in 2015). Considering executive compensation, the average salary was 2.9 € million in 2011 and increased up to 3.06 € million in 2015 (4.76% increase). The largest part of salary is represented by fixed compensation, which accounts on average for the 66% of total compensation. This preliminary observation seems far from normative prescriptions, with a disequilibrium between fixed and variable components of compensation: other incentive ratios have been computed and most relevant insights regard the kind of incentive compensation adopted are reported. For Italian companies, it seems more frequent an adoption of incentive plans in cash (24% of total compensation on average in both periods) with respect to equity tools (10% and 11% of total compensation on average in 2011 and 2015). Following the definition of short and long-term incentive ratios proposed in paragraph 3.1, it seems that Italian companies analyzed adopted a certain balance in the proportion of long and short-term forms of compensation, with a slight preference for long term tools in 2011 and the reverse condition in 2015. In order to have a preliminary
evidence about correlation between variables, Pearson correlation coefficients have been computed for the model that will be analysed hereafter.
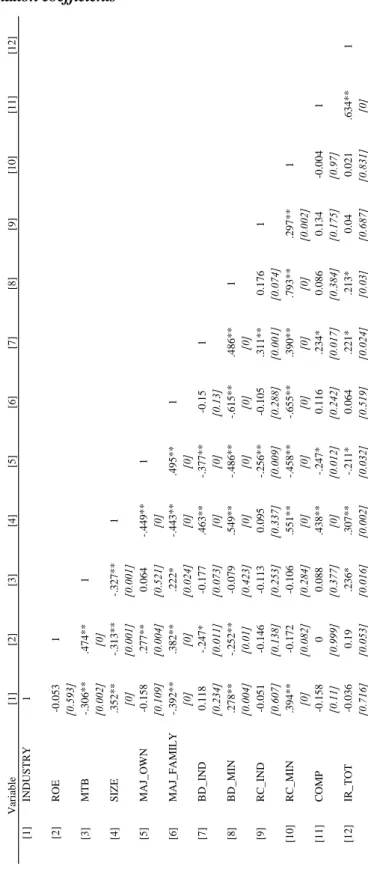
Table 2: Pearson correlation coefficients
Table 2 reports Pearson correlation coefficients for dependent and independent variables in the pooled sample. P-values are reported in parentheses and symbols indicate a 1%** and 5%* level of statistical significance (2-tailed). Variables are described in table A1 in the appendix.
[1] [2] [3] [4] [5] [6] [7] [8] [9] [10] [11] [12] [1] IN D U S T RY 1 [2] RO E -0. 053 1 [0. 593] [3] MTB -. 306** .474** 1 [0. 002] [0] [4] S IZ E .352** -. 313** -. 327** 1 [0] [0. 001] [0. 001] [5] M A J_O W N -0. 158 .277** 0. 064 -. 449** 1 [0. 109] [0. 004] [0. 521] [0] [6] M A J_F A M IL Y -. 392** .382** .222* -. 443** .495** 1 [0] [0] [0. 024] [0] [0] [7] BD _IN D 0. 118 -. 247* -0. 177 .463** -. 377** -0. 15 1 [0. 234] [0. 011] [0. 073] [0] [0] [0. 13] [8] BD _M IN .278** -. 252** -0. 079 .549** -. 486** -. 615** .486** 1 [0. 004] [0. 01] [0. 423] [0] [0] [0] [0] [9] RC _IN D -0. 051 -0. 146 -0. 113 0. 095 -. 256** -0. 105 .311** 0. 176 1 [0. 607] [0. 138] [0. 253] [0. 337] [0. 009] [0. 288] [0. 001] [0. 074] [10] RC _M IN .394** -0. 172 -0. 106 .551** -. 458** -. 655** .390** .793** .297** 1 [0] [0. 082] [0. 284] [0] [0] [0] [0] [0] [0. 002] [11] CO M P -0. 158 0 0. 088 .438** -. 247* 0. 116 .234* 0. 086 0. 134 -0. 004 1 [0. 11] [0. 999] [0. 377] [0] [0. 012] [0. 242] [0. 017] [0. 384] [0. 175] [0. 97] [12] IR_T O T -0. 036 0. 19 .236* .307** -. 211* 0. 064 .221* .213* 0. 04 0. 021 .634** 1 [0. 716] [0. 053] [0. 016] [0. 002] [0. 032] [0. 519] [0. 024] [0. 03] [0. 687] [0. 831] [0] V ari abl e
What emerges by these preliminary results is that the total compensation of executives is positively correlated with firm size and, with a lower statistical significance, negatively correlated with concentration of ownership, confirming expected signals. A positive correlation is present between the total compensation and number of independent directors. It seems to be at odds with expectations. Lack of correlation is observable between total compensation of executives and other independent variables. Concerning the total incentive ratio, coefficients show a positive correlation with both market-to-book ratio and firm size. It seems that firms with larger growth perspectives and larger amount of invested capital are more prone to adopt heavily incentive forms of compensation. The presence of large block-holders, in line Mehran (1995) research, seems negatively correlated, with a weaker statistical significance, with total incentive ratio. With respect to board composition, a larger number of independent and minority directors is positively correlated with the incentive ratio. This first result seems in line with formulated hypotheses. No evidence is present with respect to a possible correlation between compensation committee variables and incentive ratio. A deeper analysis will be conducted, to confirm or deny these preliminary results.
3.3 The regression models
To understand the different impact of variables over time, both on total compensation and pay mix, three different models have been structured. Dependent variables are related to ownership, board of directors and remuneration committee variables respectively. The composition of the dataset, made up of two cross sections that refer to the same companies over the two periods considered, did not provide the author the possibility to implement panel data with fixed effects. Since the observed companies are the same over time, a pooled OLS would result biased by idiosyncratic features of companies, duplicated in the sample. In order to test the different effects of corporate governance variables in the two years, single regressions for each year were modeled and a Z-test on the difference of coefficients performed. Following the methodology of Paternoster (1998) and Cohen et al. (2013), a Z-statistic has been computed, for the ith variable as:
𝑍
𝑖=
𝛽𝑖,2015− 𝛽𝑖,2011√𝑆𝐸𝑖,20152 + 𝑆𝐸𝑖,20112
Results of linear regressions are provided in the following tables.
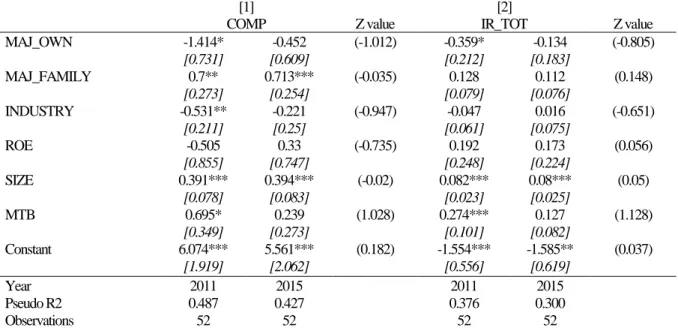
Table 3: Influence of ownership on executive compensation
[1] [2]
COMP Z value IR_TOT Z value
MAJ_OWN -1.414* -0.452 (-1.012) -0.359* -0.134 (-0.805) [0.731] [0.609] [0.212] [0.183] MAJ_FAMILY 0.7** 0.713*** (-0.035) 0.128 0.112 (0.148) [0.273] [0.254] [0.079] [0.076] INDUSTRY -0.531** -0.221 (-0.947) -0.047 0.016 (-0.651) [0.211] [0.25] [0.061] [0.075] ROE -0.505 0.33 (-0.735) 0.192 0.173 (0.056) [0.855] [0.747] [0.248] [0.224] SIZE 0.391*** 0.394*** (-0.02) 0.082*** 0.08*** (0.05) [0.078] [0.083] [0.023] [0.025] MTB 0.695* 0.239 (1.028) 0.274*** 0.127 (1.128) [0.349] [0.273] [0.101] [0.082] Constant 6.074*** 5.561*** (0.182) -1.554*** -1.585** (0.037) [1.919] [2.062] [0.556] [0.619] Year 2011 2015 2011 2015 Pseudo R2 0.487 0.427 0.376 0.300 Observations 52 52 52 52
Table 3 reports the results of linear regressions. For each model [n], column 1 and 2 report the results of linear regressions based on cross sections referring to 2011 and 2015 respectively. Standard errors are reported in parentheses. For each model
[n], column 3 reports the results of a two-tailed Z test (Ho: β𝑖,2015 = β𝑖,2011), adopted to test the differences of coefficients
over time. The symbols indicate a 1%***, 5%** and 10%* level of statistical significance. Variables are described in table A1 in the appendix.
What emerges by the models is that ownership variables present different impacts with respect to compensation variables. The first hypothesis seems to be confirmed in year 2011 with a moderate significance level. In line with the theories of Barontini and Bozzi (2011), the more the ownership is concentrated and the lower is the level of executive compensation. By model 2, again for year 2011 it is possible to infer, with weak statistical significance, that a larger percentage of shares owned by the largest block holder implies a negative variation of incentive ratio and hence a compensation of executives that is less sensitive to firm performance with respect to firms with less concentrated ownership. Although coefficients are in line with those of the regression model for 2011, the same evidences are not supported by statistical significance for the year 2015. This is a first indicator of variation between models over time. With respect to hypothesis 2a, what emerges by the regressions is that, in both periods, with a strong statistical significance, family firms tend to pay their executives more with respect to non-family companies, supporting the conclusions of Haid and Yurtoglu research (2006). Concerning hypothesis 2b, model 2 points
out for both years positive coefficients, implying in family firms a greater proportion of incentive compensation tools over the total compensation. This evidence is however not supported by statistical significance.
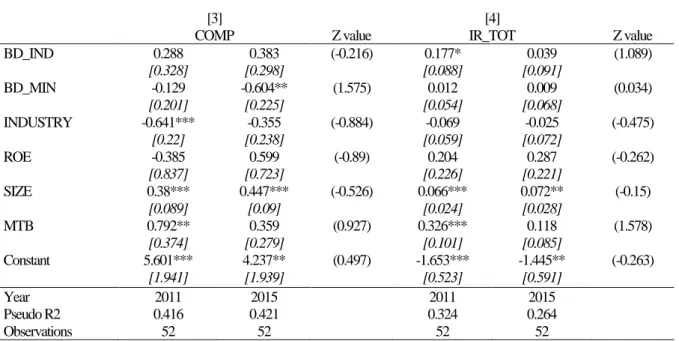
Table 4: Influence of board of directors on executive compensation
[3] [4]
COMP Z value IR_TOT Z value
BD_IND 0.288 0.383 (-0.216) 0.177* 0.039 (1.089) [0.328] [0.298] [0.088] [0.091] BD_MIN -0.129 -0.604** (1.575) 0.012 0.009 (0.034) [0.201] [0.225] [0.054] [0.068] INDUSTRY -0.641*** -0.355 (-0.884) -0.069 -0.025 (-0.475) [0.22] [0.238] [0.059] [0.072] ROE -0.385 0.599 (-0.89) 0.204 0.287 (-0.262) [0.837] [0.723] [0.226] [0.221] SIZE 0.38*** 0.447*** (-0.526) 0.066*** 0.072** (-0.15) [0.089] [0.09] [0.024] [0.028] MTB 0.792** 0.359 (0.927) 0.326*** 0.118 (1.578) [0.374] [0.279] [0.101] [0.085] Constant 5.601*** 4.237** (0.497) -1.653*** -1.445** (-0.263) [1.941] [1.939] [0.523] [0.591] Year 2011 2015 2011 2015 Pseudo R2 0.416 0.421 0.324 0.264 Observations 52 52 52 52
Table 4 reports the results of linear regressions. For each model [n], column 1 and 2 report the results of linear regressions based on cross sections referring to 2011 and 2015 respectively. Standard errors are reported in parentheses. For each model
[n], column 3 reports the results of a two-tailed Z test (Ho: β𝑖,2015= β𝑖,2011), adopted to test the differences of coefficients
over time. The symbols indicate a 1%***, 5%** and 10%* level of statistical significance. Variables are described in table A1 in the appendix.
With respect to board of directors, few evidences can be pointed out with respect to formulated hypotheses. The hypothesis 3b seems confirmed, with weak statistical significance, by the model 4 for year 2011: ceteris
paribus, the larger the number of independent members of the board, the greater was the proportion of
compensation represented by incentive tools, testifying the role of independent directors as shareholders delegated with a strong influence over executive remuneration (Sykes, 2002; Jensen et al. 2004; Conyon and He, 2004). Their effect seems however mitigated over time. What emerges by model 3 is that in 2015, the number of minority directors assumed relevance (with moderate statistical significance) in explaining lower managers’ compensation. Model 4 does not point out any evidence concerning the relation between the number of minority directors and the incentive ratio: the coefficients are in both years in line with the hypothesis 3c but there is no statistical evidence to support this relation.
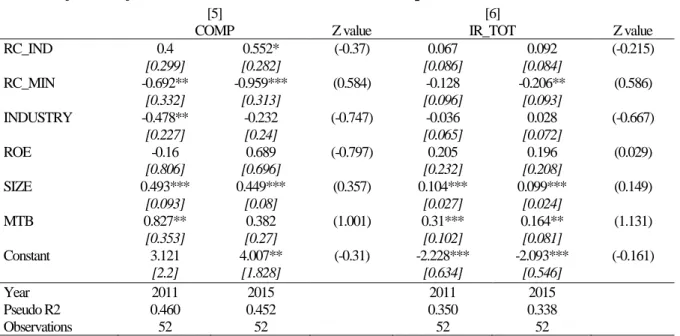
Table 5: Influence of remuneration committee on executive compensation
[5] [6]
COMP Z value IR_TOT Z value
RC_IND 0.4 0.552* (-0.37) 0.067 0.092 (-0.215) [0.299] [0.282] [0.086] [0.084] RC_MIN -0.692** -0.959*** (0.584) -0.128 -0.206** (0.586) [0.332] [0.313] [0.096] [0.093] INDUSTRY -0.478** -0.232 (-0.747) -0.036 0.028 (-0.667) [0.227] [0.24] [0.065] [0.072] ROE -0.16 0.689 (-0.797) 0.205 0.196 (0.029) [0.806] [0.696] [0.232] [0.208] SIZE 0.493*** 0.449*** (0.357) 0.104*** 0.099*** (0.149) [0.093] [0.08] [0.027] [0.024] MTB 0.827** 0.382 (1.001) 0.31*** 0.164** (1.131) [0.353] [0.27] [0.102] [0.081] Constant 3.121 4.007** (-0.31) -2.228*** -2.093*** (-0.161) [2.2] [1.828] [0.634] [0.546] Year 2011 2015 2011 2015 Pseudo R2 0.460 0.452 0.350 0.338 Observations 52 52 52 52
Table 5 reports the results of linear regressions. For each model [n], column 1 and 2 report the results of linear regressions based on cross sections referring to 2011 and 2015 respectively. Standard errors are reported in parentheses. For each model
[n], column 3 reports the results of a two-tailed Z test (Ho: β𝑖,2015 = β𝑖,2011), adopted to test the differences of coefficients
over time. The symbols indicate a 1%***, 5%** and 10%* level of statistical significance. Variables are described in table A1 in the appendix.
Recalling the analysis of previous paragraphs, remuneration committee variables adopted in the models 5 and 6 are those related to the number of independent and minority directors. Due to multicollinearity problems, the variable RC_SIZE was excluded, while it did not seem worthy to consider a binary variable indicating the presence or the absence or remuneration committee, since most of firms (94% in 2011 and 96% in 2015) adopted a remuneration committee, respecting European Committee recommendations. In line with the evolution of normative framework is also the relationship of compensation variables with the ones of compensation committee. Both in 2011 and 2015, evidences point out, with strong statistical significance, that a larger number of minority directors is, ceteris paribus, associated with lower levels of executive compensation. This is an important result, considering the role of minority directors as advocates of minority shareholders in mitigating agency problems. In terms of coefficients, an opposite evidence emerges for the number of independent directors, although only for 2015 a weak statistical significance is reported. With respect to hypotheses 4a, it seems that neither in 2011 nor in 2015 the number of independent directors had a significant impact on the incentive ratio. Model 6 provides an interesting evidence: for the year 2015, the number of independent directors appointed by minority lists of shareholders has a statistically
significant effect on the ratio between contingency pay and total compensation. However, hypothesis 4b is turned down due to the sign of the coefficient, providing results that are divergent with European recommendations of equilibrium between fixed and variable compensation.
For each model, results of the two-sided Z-test (𝐻𝑜: 𝛽𝑖,15 = 𝛽𝑖,11) point out that the null hypothesis can
never be rejected, implying that factors did not present different coefficients in terms of magnitude over time.
3.4 Comparison of compensation schemes over time
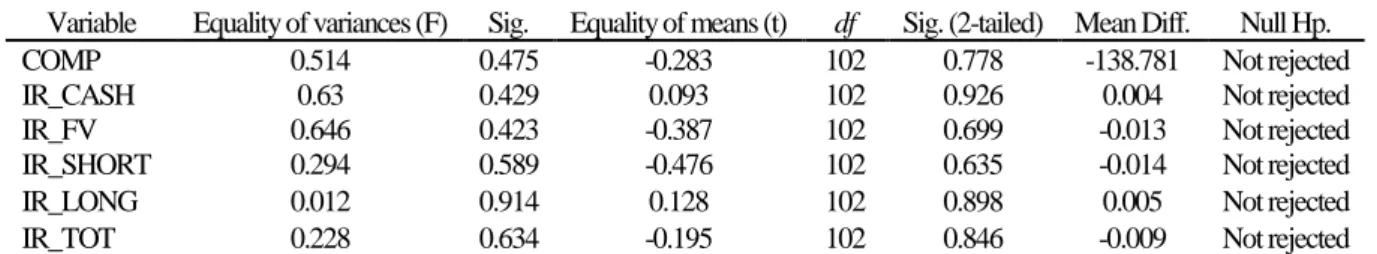
To verify hypothesis 5 and understand the possible changes in the pay mix of executive directors over time, resultant of the reception of the European Committee recommendations, a T-Test for equality of means was performed. For each variable considered, Shapiro-Wilk Test and Levene’s Test were adopted as preliminary tests to confirm respectively the normal distribution and homogeneity of variance of the populations from which the two samples were collected. Results are provided in table 6. What emerges by these tests is that the null hypothesis of equality of means can never be rejected, evidencing a certain stability in the compensation policies adopted by large Italian listed companies over time. This result, especially for incentive ratios, is significant for the analysis. This steadiness in compensation schemes can be associated with a scarce reception of the recommendations or with ownership and board variables that mitigated the impact of the latter.
Table 6: Changes in executive pay mix over time
Variable Equality of variances (F) Sig. Equality of means (t) df Sig. (2-tailed) Mean Diff. Null Hp. COMP 0.514 0.475 -0.283 102 0.778 -138.781 Not rejected IR_CASH 0.63 0.429 0.093 102 0.926 0.004 Not rejected IR_FV 0.646 0.423 -0.387 102 0.699 -0.013 Not rejected IR_SHORT 0.294 0.589 -0.476 102 0.635 -0.014 Not rejected IR_LONG 0.012 0.914 0.128 102 0.898 0.005 Not rejected IR_TOT 0.228 0.634 -0.195 102 0.846 -0.009 Not rejected
Table 6 reports the results of Levene’s Test for equality of variances and of T-Test for equality of means. The null hypothesis states that the variance and the mean of the variables are equally distributed across both periods (2011 and 2015). The symbols indicate a 1%***, 5%** and 10%* level of statistical significance. Variables are described in table A1 in the appendix.
3.5 Other attempts
A wider set of models was built to consider possible decompositions of the incentive ratio and valuate with a greater detail the variables that had an impact on the composition of executive pay mix. However, different
reasons drove the author not to consider the models in the work: for the dependent variable IR_LONG heteroscedasticity problems emerged, while for other incentive ratios two different issues incurred: some regressions were not significant, while, for those that were significant, independent variables did not affect with statistical significance the dependent variables, preventing the author to provide additional contributions to the literature.
4 Discussion and conclusion
This work provides a contribution to the still limited literature about executive remuneration in non-Anglo-Saxon countries, providing evidences for large Italian listed companies, that are characterized by peculiar features in terms of corporate governance. In addition, it contributes to the knowledge about the impact that European Union and national recommendations had for Italian firms since the beginning of the current decade.
Evidences show that ownership nature is a determinant feature in the Italian context to explain executive compensation: family firms tend to pay their executives more than non-family companies but scarce evidence is pointed out in terms of definition of executive pay mix. The role of board of directors as determinant of executive compensation, documented in previous studies, seems to lose its significance with the introduction of a remuneration committee. What emerges by the analysis is indeed that minority directors in the remuneration committee are significant determinant of executive compensation. Nevertheless, results are not in line with the Self-Discipline Code: although a larger presence of minority directors in the remuneration committee is related to lower compensation corresponded to executives, the equilibrium between the fixed and variable compensation, aimed by recommendations, seems not guaranteed by their presence. Rather, a larger proportion of minority directors seems to be associated with a lower weight of variable components of compensation with respect to the fixed one. This finding, along with the stability of compensation pay mix over time, may have important policy-making implications, given the interest of shareholders and regulator: codes of best practices should consequently foster the compliance to European recommendations.
However, these evidences are the result of a methodology characterised by a series of limitations. The first restriction is related to the sample selection: as emphasized in the work, only data about large companies were considered in the dataset. This is explainable by the fact that remuneration reports quality is indirectly related to the size of the firms. The second limitation is attributable to the time frame considered: if on one side it can be justifiable to study the effect of a policy at the moment of the introduction and in the last observable period, on the other, the selection of a 2-year cross section of data prevented the author to adopt different statistical tools, such as panel data. In line with these limitations, possible suggestions for further research could be arguable. A possibility would be considering the evolution of compensation schemes of executives in a larger time horizon, not only relying on a single country, but rather expanding the analysis to cover the whole panel of European companies interested by the recommendations, increasing in this way not only the sample size, but also considering the reception of the recommendations by smaller firms. Additionally, a comparison between countries that adopted binding laws and those that relied on codes of best practices to apply European recommendations can be performed, with the aim to test the effectiveness of the two different approaches. Concerning the independent variables adopted in the model, possible studies may be driven by the aim to extend the analysis to different ownership structures, considering not only the first majority shareholder, but also other significant owners and their nature. An interesting measure of ownership could also be represented by the percentage of shares owned by executive directors. This measure represents a proxy for executives’ power, that could have a direct influence on remuneration committee conduct and consequently an indirect effect on compensation tools adopted within companies. With respect to specific characteristics of variables, important implications for executive compensation could be identified considering qualitative features in the analysis: socio-demographic characteristics, gender, academic and professional background of remuneration committee members could have significance in explaining the compensation policies adopted by companies.
References
Altomare Elisabetta and Zattoni Alessandro. 2013. “Le determinanti della remunerazione degli
amministratori delegati: un’analisi empirica sulle imprese italiane quotate.” In La retribuzione del top
management: incentivi, carriera e governance, ed. Pittino, Viganò and Zattoni, Milano: EGEA spa. Anderson Ronald C. and Bizjak John M. 2003. “An empirical examination of the role of the CEO and
the compensation committee in structuring executive pay.”Journal of Banking & Finance,27(7): 1323-1348.
Barontini Roberto and Bozzi Stefano. 2011. “Board compensation and ownership structure: empirical
evidence for Italian listed companies.” Journal of Management & Governance, 15(1): 59-89.
Bebchuk Lucian A., Grinstein Yaniv and Peyer Urs. 2010. “Lucky CEOs and lucky directors.” The Journal of Finance, 65(6): 2363-2401.
Bebchuk Lucian Arye, Fried Jesse M. 2006. Pay without performance. Cambridge, MA: Harvard University Press.
Bebchuk Lucian Arye, Fried Jesse M. and Walker David I. 2002. “Managerial power and rent extraction
in the design of executive compensation”. National bureau of economic research Working Paper No. 9068 [online] http://www.nber.org/papers/w9068.pdf (accessed February 15, 2017)
Becht Marco, Bolton Patrick and Röell Ailsa. 2003. “Corporate governance and control.” Handbook of
the Economics of Finance, 1:1-109.
Bianchi Marcello, Bianco Magda and Enriques Luca. 2010. “Pyramidal groups and the separation
between ownership and control in Italy.” In The control of Corporate Europe, ed. Barca Fabrizio and Becht Marco, 154-186. Oxford: Oxford University Press.
Bianco Magda. 2001. “Country Reports: Corporate governance and economic performance - Italy.”
In Corporate governance and economic performance, ed. Gugler Klaus, 130-138. Oxford: Oxford University Press.
Carrasco‐Hernandez Antonio and Sánchez‐Marín Gregorio. 2007. “The determinants of employee
compensation in family firms: empirical evidence.” Family business review, 20(3):215-228.
Cohen Jacob, Cohen Patricia, West Stephen G. and Aiken Leona S. 2013. Applied multiple
regression/correlation analysis for the behavioral sciences. London: Routledge.
Combs James G., Penney Christopher R., Crook T. Russel and Short Jeremy C. 2010. “The impact
of family representation on CEO compensation.” Entrepreneurship Theory and Practice, 34(6):1125-1144.
Comitato per la Corporate Governance delle Società Quotate. 2015. “Codice di Autodisciplina” [online]
http://www.borsaitaliana.it/borsaitaliana/regolamenti/corporategovernance/codice2015.pdf (accessed February 1, 2017)
Conyon Martin J. and He Lerong. 2004. “Compensation committees and CEO compensation incentives
Croci Ettore, Gonenc Halit and Ozkan Neslihan. 2012. “CEO compensation, family control, and
institutional investors in Continental Europe.” Journal of Banking & Finance, 36(12):3318-3335.
Donaldson Lex and Davis James H. 1990. “CEO governance and shareholder returns: Agency theory or
stewardship theory.” Australian Journal of Management, 16(1): 49-65
Dyl Edward A. 1988. “Corporate control and management compensation: Evidence on the agency
problem.” Managerial and Decision Economics, 9(1):21-25.
Enriques Luca and Volpin Paolo. 2007. “Corporate governance reforms in continental Europe.” The
Journal of Economic Perspectives, 21(1): 117-140.
Fama Eugene F. and Jensen Michael C. 1983. “Separation of ownership and control.” The journal of law and Economics, 26(2): 301-325.
Gomez-Mejia Luis R. and Wiseman Robert M. 1997. “Reframing executive compensation: An
assessment and outlook.” Journal of Management, 23(3):291-374.
Haid Alfred and Yurtoglu B. Burcin. 2006. “Ownership Structure and Executive Compensation in
Germany.” [online] https://papers.ssrn.com/sol3/papers.cfm?abstract_id=948926 (accessed February 15, 2017)
Jensen Michael C. and Murphy Kevin J. 1990. “Performance pay and top-management
incentives.” Journal of political economy, 98(2): 225-264.
Jensen Michael C., Murphy Kevin J. and Wruck Eric G. 2004. “Remuneration: Where we've been, how
we got to here, what are the problems, and how to fix them.” Harvard Negotiation, Organizations & Markets
Working Paper No. 04-28; [online] https://papers.ssrn.com/sol3/papers.cfm?abstract_id=561305.##
(accessed February 15, 2017)
Lopes Ilídio Tomás and Ferraz Duarte Pitta. 2016. “The value of intangibles and diversity on boards
looking towards economic future returns: evidence from non-financial Iberian business organizations.” International Journal of Business Excellence, 10(3): 392-417.
Mehran Hamid. 1995. “Executive compensation structure, ownership, and firm performance.” Journal of
financial economics, 38(2):163-184.
Melis Andrea, Carta Silvia and Gaia Silvia. 2012. “Executive remuneration in blockholder-dominated
firms. How do Italian firms use stock options?” Journal of Management & Governance, 16(3):511-541.
Melis Andrea. 2000. “Corporate governance in Italy.” Corporate Governance: An International
Review, 8(4): 347-355.
OECD. 2015. “Principles of Corporate Governance” OECD Report to G20 Finance Ministers and Central Bank Governors [online] http://www.oecd.org/daf/ca (accessed February 1, 2017)
Paternoster Raymond, Brame Robert, Mazerolle Paul and Piquero Alex. 1998. “Using the correct
Sakawa Hideaki, Moriyama Keisuke and Watanabel Naoki. 2012. “Relation between top executive
compensation structure and corporate governance: Evidence from Japanese public disclosed data.” Corporate Governance: An International Review, 20(6):593-608.
Shleifer Andrei and Vishny Robert W. 1997. “A survey of corporate governance.” The journal of
finance, 52(2):737-783.
Sun Jerry and Cahan Steven. 2009. “The effect of compensation committee quality on the association
between CEO cash compensation and accounting performance.” Corporate Governance: An International
Review, 17(2):193-207.
Sykes Allen. 2002. “Overcoming Poor Value Executive Remuneration: resolving the manifest conflicts of
interest.” Corporate Governance: An International Review, 10(4):256-260.
The Commission of the European Communities. 2004. “Commission Recommendation of the
Commission of the European Communities, dated 14 December 2004 on fostering an appropriate regime for the remuneration of directors of listed companies.” Official Journal of the European Union, L 385/55 [online] http://eur-lex.europa.eu (accessed February 1, 2017)
The Commission of the European Communities. 2005. “Commission Recommendation of the
Commission of the European Communities, dated 15 February 2005 on the role of non-executive or supervisory directors of listed companies and on the committees of the (supervisory) board.” Official Journal
of the European Union, L 52/51 [online] http://eur-lex.europa.eu (accessed February 1, 2017)
The Commission of the European Communities. 2009. “Commission Recommendation of the
Commission of the European Communities, dated 30 April 2009 on complementing Recommendations 2004/913/EC and 2005/162/EC as regards the regime for the remuneration of directors of listed companies.”
Official Journal of the European Union, L 120/28 [online] http://eur-lex.europa.eu (accessed February 1,
2017)
Tosi Jr Henry L. and Gomez-Mejia Luis R. 1989. “The decoupling of CEO pay and performance: An
agency theory perspective.” Administrative Science Quarterly, 169-189.
Vafeas Nikos. 2003. “Length of board tenure and outside director independence.”Journal of Business Finance & Accounting,30(7‐8):1043-1064.
Zattoni Alessandro. 1999. “The structure of corporate groups: the Italian case.” Corporate Governance:
Appendix
Table A1: Variables description
Variable Description
Total compensation COMP*
Total compensation obtained by company executives during the fiscal year. This is computed as the sum of fixed compensation, MBO, Benefits, LTIPs, FV of stock grants and (phantom) stock
options
Total incentive ratio IR_TOT
Incentive ratio computed as the percentage of total compensation represented by incentive compensation. Incentive compensation is computed as the sum of short (MBO) and long term (LTIP) cash bonuses, plus the fair value of stock grants and (phantom)
stock options Short term incentive ratio IR_SHORT
Incentive ratio computed as the percentage of total compensation represented by short term incentive compensation. Short term incentive compensation is represented by MBO cash bonuses
Long term incentive ratio IR_LONG
Incentive ratio computed as the percentage of total compensation represented by long term incentive compensation. Long term incentive compensation is computed as the sum of long term (LTIP) cash bonuses, plus the fair value of stock grants and
(phantom) stock options Cash form incentive ratio IR_CASH
Incentive ratio computed as the percentage of total compensation represented by incentive compensation in cash. Cash incentive
compensation is represented by MBO and LTIP cash bonuses
Equity form incentive ratio IR_FV
Incentive ratio computed as the percentage of total compensation represented by incentive compensation in form of equity tools.
Fair Value incentive compensation is computed as the sum of fair value of stock grants and (phantom) stock options Ownership ratio majority shareholder MAJ_OWN Ratio between the number of shares owned by first larger
shareholders the total amount of issued shares Family firm MAJ_FAMILY Binary variable that equals one if the first majority shareholder is
represented by a family and zero otherwise Independent directors on board BD_IND* Number of independent directors on the board
Minority directors on board BD_MIN* Number of independent directors appointed to the board by minority lists of shareholders
Independent directors of rem. committee RC_IND* Number of independent directors on the remuneration committee Minority directors of rem. committee RC_MIN* Number of independent directors, appointed by minority lists of
shareholders to the remuneration committee Industry INDUSTRY Binary variable that equals one if company macro-sector is
Utilities, Industrial or Oil and Gas; zero otherwise ROE ROE Ratio between net income and shareholder equity
Size SIZE* Total assets reported on firm balance sheet Market to book ratio MTB* Ratio between market and book value of equity
Table A1 provides a description of variables adopted in the analysis. Variables marked with * are log transformed in regressions