UNIVERSIDADE DE LISBOA
FACULDADE DE CIÊNCIAS
DEPARTAMENTO DE BIOLOGIA ANIMAL
Spatial distribution and temporal trends of the otter in
south-central Portugal: conservation implications
Mestrado em Biologia da Conservação
Renato Marques Fialho
Dissertação orientada por:
Professora Doutora Margarida Santos-Reis
Agradecimentos
Em primeiro lugar tenho de agradecer à Professora Doutora Margarida Santos-Reis, pela oportunidade de trabalhar neste projeto, pela imposição obrigatória de efectuar o trabalho de grupo a pares, que facilitou muito o trabalho, e pela disponibilidade para que mesmo podendo não ser imediata, sempre esteve presente.
Tenho também de dirigir um enorme obrigado ao Doutor Nuno Pedroso pelos dias de planeamento dos locais amostrados, as ideias de tratamento dos resultados, pela orientação que me foi dando ao longo destes meses de trabalho, que sem ele não seria possível. Em suma pela paciência que teve comigo, estando sempre disponível para debater qualquer problema e trabalhar em conjunto para chegar a uma solução.
Quero também agradecer à minha família e amigos. Aos meus pais pelo apoio omnipresente e incondicional, pela disponibilidade para resolver situações imprevistas e flexibilidade para se ajustarem a uma nova rotina com o trabalho de campo intenso.
Aos meus irmãos e à minha cunhada, por estarem sempre presentes e, à sua maneira, me puxarem para cima quando o isolamento me toldava os pensamentos. Mesmo contra vontade, os momentos fora de casa, nem que fosse para jantar, ajudaram muito a desanuviar e a refrescar a cabeça.
Ao meu amigo e colega de trabalho de campo, Diogo Cabecinha, que para além de condutor e cozinheiro foi muitas vezes a única pessoa com quem falava durante dias consecutivos. Obrigado pela companhia, pelos momentos bons, maus e por aqueles que ficam para a posterioridade, e até pelos debates quase filosóficos como “será que nos molhamos mais se corrermos?”.
À Megan Lynch, uma companhia estrangeira, que nos auxiliou no trabalho de campo durante alguns dias, facilitando as buscas e trocando conhecimentos sobre lontras.
To Megan, a foreigner company, that help us in field work for a few days, facilitating the searches and exchanging knowledge about otters.
À Luísa Ramalho e à Margarida Antunes, pela hospitalidade e dotes culinário numa das temporadas de campo, assim como pelo apoio constante ao longo de todo o trabalho.
À minha afilhada e a todos os meus Amigos que directa ou indirectamente me deram forças e acreditaram em mim, fazendo-me ver que por mais horas de sono e pestanas
queimadas se eu tivesse confiança em mim e no meu trabalho, este acabaria por chegar a bom porto.
Não podia deixar de agradecer ao CARNIVORA – Núcleo de Estudos de Carnívoros e seus Ecossistemas, pelo apoio financeiro ao trabalho de campo, à Companhia das Lezírias, à Liga para a Proteção da Natureza (LPN) nomeadamente ao Centro de Educação Ambiental de Vale Gonçalinho (CEAVG) e à Câmara Municipal de Marvão na pessoa do Senhor Presidente pelo alojamento cedido que viabilizou a execução do trabalho de campo e ao Centre for Ecology,
Evolution and Environmental Changes (cE3c) sediado na Faculdade de Ciências da Universidade
de Lisboa pela disponibilização da sua casa na Herdade da Ribeira Abaixo em Grândola.
Por último tenho também a agradecer aos meus familiares e do Diogo por nos cederem guarida durante o tempo de trabalho de campo. Uma ajuda indispensável para o culminar do projeto.
Table of contents
Resumo ... 1 Summary ... 5 1. Introduction ... 6 2. Objectives ... 9 3. Methods ... 10 3.1. Study Area ... 10 3.2. Otter Survey ... 12 3.3. Statistical analysis ... 14 4. Results ... 16 4.1. Otter Survey ... 164.2. Data comparison of the 1995 and 2015 surveys ... 22
4.3. Priority sites for conservation ... 24
4.4. Efficiency of the survey method ... 27
5. Discussion ... 28
5.1. Otter Survey ... 28
5.2. Surveys comparison and priority sites for conservation ... 30
5.3. Survey’s method efficiency ... 31
6. Conclusion ... 32
References ... 33
Resumo
O reconhecimento do declínio acentuado da população global de lontra euroasiática (Lutra lutra Linnaeus, 1758) que se verificou na década de 70, intimamente ligado a factores que ainda hoje influenciam o seu habitat, como poluição dos ambientes aquáticos, pressão humana e degradação da vegetação ripícola, originou vários estudos a nível europeu que sustentaram a classificação da lontra como espécie internacionalmente protegida. Em Portugal Continental, a população de lontra é tida como uma das mais viáveis da Europa. Embora protegida legalmente, a lontra é hoje considerada uma espécie de estatuto Pouco Preocupante, sendo a maioria dos estudos sobre a espécie restritos geograficamente.
O único estudo acerca da distribuição da espécie à larga escala, em Portugal, foi realizado em 1995 sob a responsabilidade do Instituto de Conservação da Natureza e adoptando a metodologia recomendada pelo grupo de especialistas da lontra da União Internacional para a Conservação da Natureza (IUCN). Segundo esta metodologia, a área de estudo é dividida numa grelha de 10 km por 10 km e em cada quadrícula deverão ser feitos transectos de no máximo 600 m ao longo de corpos de água (rios, ribeiras, reservatórios, lagoas, etc) previamente selecionados por apresentar potencialmente melhores condições para a presença de lontra. Nesta metodologia, para além de identificação visual de indivíduos, contam também para um resultado positivo vestígios inegáveis da sua presença como excrementos, latrinas e pegadas. Tratando-se de uma espécie territorial, a lontra efectua as marcações do seu território recorrendo a dejectos/latrinas e marcações odoríferas (secreções gelatinosas), geralmente ao longo das linhas de água em locais secos/abrigados da água e elevados. Deste modo grandes blocos de pedra, troncos de árvores, pontes e bifurcações de linhas de água são locais ideais para a marcação e assim para se efectuarem as prospecções. Estudos ao nível de efectivos populacionais em Portugal não são comuns, pois exigem muitos recursos financeiros e humanos para além de exigirem muito tempo de amostragem especialmente se se focarem, em áreas de grande dimensão.
Actualmente a lontra euroasiática está classificada globalmente como Quase Ameaçada (NT) segundo o IUCN, estando listada no Anexo I da Convenção de Washington (CITES), Anexo II da Convenção de Berna e Anexos II e IV da Directiva Habitats. Já em Portugal continental, até então com Informação Insuficiente (DD) esta espécie passou, em 2005, para Pouco Preocupante (LC).
Foi objectivo do presente estudo reavaliar a distribuição da lontra na região centro-sul de Portugal onde, segundo o estudo de 1995 e com base em variáveis ambientais e humanas, se definiram duas vastas áreas críticas para a presença de lontra, assim como outras dezoito áreas importantes para a sua conservação. Pretendeu-se averiguar a evolução da distribuição da espécie após duas décadas, identificar que fatores influenciam a mesma, e propor medidas de conservação a adotar em eventuais locais de risco ou de ausência da espécie.
Recorrendo a uma metodologia similar à sugerida pelo IUCN e semelhante ao estudo de 1995, foi efetuado um transecto até 600 metros num corpo de água, que caso fosse negativo, seria seguido da execução até um máximo de três pontos de amostragem (spot checks) com comprimentos de 20-25m, em locais ideais para identificação de presença de lontra. Em cada prospecção foram identificadas variáveis como o tipo de substrato, percentagem de cobertura arbórea e arbustiva, poluição e nível e capacidade do recurso hídrico amostrado. As prospeções foram efetuadas entre Setembro de 2014 a Abril de 2015.
A análise comparativa dos estudos da distribuição de lontra (1995 e 2014/2015) foi predominantemente descritiva, considerando as limitações do uso de uma variável binária como a presença/ausência da lontra. No entanto, foi usado o teste de qui-quadrado de McNemar para a verificar se houve mudanças significativas na presença/ausência do lontra entre os anos e entre as sub-bacias amostradas. De igual forma a regressão logística multivariada foi usada para determinar o efeito das variáveis de macro habitat na presença/ausência de lontra em cada quadricula e, identificar a combinação de variáveis que explicam a distribuição da lontra. A associação entre as variáveis explicativas e a presença/ausência de lontra foi testada usando o método de máxima verossimilhança e aplicou-se um processo de selecção por etapas (stepwise forward), com base no teste do Wald. Finalmente uma Análise de Componente Principais foi aplicada para entender as relações entre variáveis de macro habitat e distribuição da lontra, em cada quadrícula, complementando as anteriores análises, codificando as amostras com base na presença/ausência de lontra e as sub-bacias amostradas.
Os resultados obtidos evidenciam uma expansão de 9% da área geográfica de ocupação pela lontra com colonização de novas áreas, com principal foco na região entre a margem direita do rio Tejo e a costa Atlântica. Esta expansão parece estar relacionada com uma melhoria generalizada das condições de habitat e uma maior disponibilidade de presas, principalmente do lagostim-vermelho do Louisiana (Procambarus clarkii Girard, 1852). Para além da falta de sistemas de água doce, também linhas de água caracterizadas por forte corrente e falta de vegetação aquática, intervenções humanas (alteração das margens, poluição) e salinização da
água são factores que resultaram estar relacionados com a ausência de lontra euroasiática. Esta ausência da espécie está assim restrita a zonas altamente intervencionadas pelo Homem ou com falta de disponibilidade de água. Estas áreas, já eram designadas no estudo anterior (de 1995) por Áreas Críticas para a conservação da lontra em Portugal. Os resultados do presente trabalho revelam que das duas zonas críticas para a conservação de lontra englobadas na área de estudo, a zona da Península de Setúbal não sofreu alterações, contrariamente à zona Norte de Lisboa onde é visível um aumento da distribuição da população de lontra, formando duas áreas de menores dimensões, uma em redor de Lisboa, outra em torno de Porto de Mós.
Devido à sua inclusão nos Anexos II e IV da Directiva Habitats, a lontra euroasiática é classificada como espécie de fauna de valor comunitário e é previsto que sejam designadas Zonas Especiais de Conservação. Com base em critérios de selecção como o estado de conservação e dimensão do local, a diversidade de ambientes aquáticos e abundância relativa da espécie, no estudo de 1995 foram definidos 86 sítios importantes para a conservação de lontra divididos em três classes (prioritários, importantes e a considerar). Dos 18 sítios importantes para a conservação de lontra situados na área de estudo, apenas os sítios de baixa prioridade apresentam resultados negativos para a presença de lontra, resultado que se mantem sensivelmente igual em comparação com os dados obtidos em 1995.
Numa avaliação à metodologia utilizada no trabalho de campo e com base nos resultados obtidos, sugere-se que a prospecção de vestígios de lontra seja feita em transectos com um máximo de 400 m por oposição aos 600 m uma vez que para além dos 250 m poucos vestígios de lontra foram encontrados. Por sua vez um aumento da distância percorrida nos spot
checks de 25 m para 50 m (dado que 81% dos transectos revelaram-se positivos até aos 50m)
deve incrementar a probabilidade de encontrar vestígios de lontra, agilizando a prospecção em cada quadrícula. Sugere-se também uma alteração da ordem de prospecção devendo efectuar-se primeiramente os spot checks e só depois, e em caso destes terem sido negativos, os transectos.
Embora o estado de conservação da lontra se mantenha como não preocupante na área de estudo, e potencialmente também em Portugal, a pressão exercida por factores que actuam a uma escala global, em particular as alterações climáticas e os seus efeitos na escassez de água, sugere a necessidade de uma monitorização periódica e preocupação com a qualidade dos recursos hídricos. Deste modo são sugeridas algumas medidas que visam a promover a conservação da espécie e do seu habitat, nomeadamente através da monitorização da população de lontra com alguma periocidade de modo a permitir descortinar eventuais
alterações populacionais da espécie, estabelecer medidas conservativas de modo a minimizar os atropelamentos nas estradas (um dos principais factores de ameaça em acção) e as modificações/canalizações dos sistemas aquáticos, conservar e melhorar os sítios importantes para a conservação de lontra e promover a educação ambiental junto da população humana fase aos risco de poluição e sobrepesca nos sistemas aquáticos.
Palavras-chaves: Lutra lutra, Distribuição geográfica, Bacias Hidrográficas, Disponibilidade de
Summary
The acknowledgment of the marked decline of Eurasian otter (Lutra lutra Linnaeus, 1758) global population in the 70’s led to many studies that resulted in the classification of the otter as internationally protected species. In mainland Portugal, otter population is considered as one of the most viable of Europe and despite being legally protected, the otter is now considered a species of least concern status with the majority of studies on the species geographically restricted. The only study on the wide range of species distribution was carried out in 1995 under the Nature Conservation Institute and adopting the methodology recommended by the Otter Specialist Group of the International Union for Conservation of Nature. This study aims to re-evaluate the distribution of the otter in the south-central region of Portugal where, according to the 1995 study, two large critical areas for the presence of otter were defined, as well as other important areas for their conservation. Using the same methodology, we sought to investigate the evolution of the species distribution after two decades, identify what factors influence it, and propose conservation measures to be adopted especially in risk areas or of species absence. The results show an increase of 9% of the geographical area of occupation by the otter with colonization of new areas, with a primary focus in the area between the right bank of the Tejo river and the Atlantic coast. This increase of otter’s distributions seems to be related to a general improvement of habitat condition and higher prey availability and is only limited by the absence of freshwater and high human density. The absence of the species is thus restricted to human modified areas or lack of continued water. Although the otter conservation status in Portugal is Least Concern, the pressure exerted by factors that act on a global scale, in particular climate change and its effects on water scarcity, suggests the need for periodic monitoring and concern for the quality of water resources.
Keywords: Lutra lutra, Geographical Distribution
,
Hydrographic Basins, Freshwater Availability, Conservation.1. Introduction
Riverine otters are mammals of the order Carnivora and like weasels, martens or badgers they belong to the Mustelidae family (Roos et al., 2015). Their singular semi-aquatic lifestyle, when compared to other mustelids, led them to develop a hydrodynamic body structure, interdigital webbing, an extra layer of highly dense fur, a strong and flat tail, ears, eyes and nostrils in the upside of the head, and the ability to change the shape of eyes lens for a more accurate underwater vision (Kruuk, 2006). Due to these significant changes, otters have been grouped in the subfamily Lutrinae that comprises 13 species (Foster-Turley et al., 1990).
The Eurasian otter (Lutra lutra Linneus, 1758) is the only member of the Lutrinae family in Europe. Besides Europe, Eurasian otter’s range reaches Japan and South Korea in Asia and some regions north of Sahara desert in Africa (Roos et al., 2015).
This species has nocturne/ twilight habits (Ruiz-Olmo et al., 2001; Jiménez et al., 2008) and lives in low density (Ruiz-Olmo et al., 2001) with philopatric females in opposition to dispersive males (Farinha, 1999; Quaglietta et al., 2013; Pedroso et al., 2014a). In the Iberian Peninsula, otter’s territories can extend over 33 to 40 km and 20 to 30 km of watercourses length for males and females respectively (Bernardo, 2008; Ruiz-Olmo and Jiménez, 2008). Otter territories are marked through the deposition of spraints and jellies (musky anal secretion) on high/visible places (e.g. stones, dead tree trunks) or predictable/weather proof sites (e.g. water junctions or under bridges) (Ruiz-Olmo et al., 2001). A single otter can mark many kilometres of watercourses (Ruiz-Olmo et al., 2001).
Due to otter active marking activities, that may vary accordingly to sex, age and season, among other factors (e.g. Kruuk and Conroy, 1987), researchers cannot rely on the number of signs to estimate the number of otters but it is acceptable that more signs are associated to areas more intensively used and therefore more important for otters (Ruiz-Olmo et al., 2001; Guter et al., 2007), particularly in what concerns prey availability (Guter et al., 2007). Inversely, absence of signs in an area does not necessarily means absence of otters (Guter et al., 2007; Calzada et al., 2010) and can lead to false negatives (Ruiz-Olmo et al., 2001). Marking intensity relies on the importance of territories, and as Ruiz-Olmo et al. (2001) evidenced, otters can use some passages without marking them. Only when no signs are regularly observed in consecutive sampling events in the same location, we can assume the species absence (Ruiz-Olmo et al., 2001).
Otters are generalist predators with a diverse diet and prey can be identified by the analysis of the undigested remains (e.g. scales, teeth, bones) found in spraints (Novais et al., 2010). Being a semi-aquatic animal, fishes are the main prey of the Eurasian otter (e.g. Blanco-Garrido et al., 2008; Clavero et al., 2008; Novais et al., 2010; Pedroso et al., 2014a), largely complemented with amphibians and the American crayfish (Procambarus clarkii Girard, 1852) (Beja, 1996; Clavero et al., 2008; Pedroso et al., 2014a). Reptiles, birds and small mammals make also part of their diet (e.g. Clavero et al., 2008; Novais et al., 2010). This wide diet makes otters more of an opportunistic species rather than specialist (Sales-Luís et al., 2007; Pedroso et al., 2014a).
The Mediterranean climate region, where the south and part of the central region of Portugal are included, has in water availability one of the most important limiting factors to otters (Beja, 1992; Prenda et al., 2001). In these regions permanent reservoirs are a viable complement for otter hunting territories (Prenda et al., 2001; Basto et al., 2011; Pedroso et al., 2014b) in dry seasons. In wet seasons, when water availability and food are not limiting factors, otters are mostly influenced by human activities and surrounding landscape features (Prenda et al., 2001; Basto et al., 2011; Reid et al., 2013).
Watercourses with a well-developed riparian cover are optimal habitats for otters (Beja, 1992), with vegetation cover favouring water retention during dry seasons and consequently prey availability (Basto et al., 2011). These characteristics make reservoirs, with fluctuating water levels and low vegetation cover in the margins, a low priority landscape element for otters (Basto et al., 2011; (Pedroso et al., 2014a), especially when outside otter’s original territories. Riparian cover, refuge availability and mostly water and prey availability are the principal drivers of otter’s distribution (Prenda et al., 2001; Pedroso et al., 2014a).
Disturbances imposed to the above referred environmental factors caused the decline of otter populations in Europe during the last century (Ruiz-Olmo et al., 2001; Roos et al., 2015). The frequent cut of riparian vegetation, reducing cover and increasing water evaporation and consequently lack of prey (Beja, 1992; Pedroso et al., 2014a), the increase of pollutants on aquatic systems, the bioaccumulation of toxic residues and overfishing (Ruiz-Olmo et al., 2001; Pedroso et al., 2014a) are main disturbances affecting otters.
The specificity of the otter ecological requirements, as well as its sensitivity to sudden environmental changes, leaded in the 1970’s to severe population declines and consequent population fragmentation and isolation, in some of its peripheral regions (Roos et al., 2015). By then the species gained the status of a threatened species in global terms (Foster-Turley et al.,
1990) and several studies were devoted to the species (MacDonald and Mason, 1994; Cortés et al., 1998; Jiménez et al., 2008).
After a few pilot studies in the 80’s and 90’s, the IUCN – OSG (Otter Specialist Group) established a standard monitoring method, based on a 10 x 10 km UTM square grid approach, for monitoring the species spatial distribution and temporal trends (Reuther et al., 2000). This method was also used for monitoring the otter population in Portugal (Trindade et al., 1998; Sales-Luís et al., 2012), Spain (Jiménez et al., 2008) and many other countries (Sales-Luís et al., 2012).
Following the recognition of the species global decline, several conservation actions were taken allowing the species recovery in most of its original range. For instance after the decline observed in the 1970’s (Cortés et al., 1998; Jiménez et al., 2008), the Spanish otter population showed recovery signs related to the expansion of the American crayfish (Ruiz-Olmo and Clavero, 2008), as well as to the improvement of watercourses quality and the reduction in toxic pollutants (Cortés et al., 1998; Jiménez et al., 2008).
Today the Eurasian otter is classified as Near Threatened (NT) by the International Union for Conservation of Nature - IUCN (Roos et al., 2015), being also listed in Appendix I of Washington Convention (CITES), Appendix II of the Bern Convention and Annexes II and IV of the EU Habitats and Species Directives (Roos et al., 2015).
In Portugal, a nation-wide distribution map was created in 1995 and, in spite of considering the otter population as one of the most viable and well spread in Europe, highlighted critical areas and priority sites for the species conservation (Trindade et al., 1998). Since then, Portuguese otter populations have been studied in different systems and scale of analysis (e.g. freshwater courses, dams, fish farms, hydrographic regions, protected areas) (Freitas et al., 2007; Pedroso et al., 2007; Sales-Luís et al., 2007; Novais et al., 2010; Basto et al., 2011). The species broad distribution, and presumably high abundance, lead to a change in the otter status from Insufficiently Known (Cabral et al., 1990) to Least Concern (LC) (Cabral et al., 2005).
As a consequence of the species being included in the EU Habitats and Species Directives (Roos et al., 2015), otter populations have to be monitored over time (Reid et al., 2013). Nevertheless in Portugal, besides the 1995’s national census (Trindade et al., 1998), were all 989 10x10 km squares were surveyed, and a partial one (211 of 989 10x10 km squares were surveyed) conducted in 1998 (Farinha, 1999), no other large-scale census was conducted in the last two decades.
The long time lapse from the last large-scale evaluation of the species distribution, and the obligatory monitoring rule from EU Habitats and Species Directives make this project should be viewed as an important contribution to understand the spatial and temporal trends in otter distribution in Portugal, being the extent of occurrence one of the quantitative criteria needed to evaluate species status (Rodrigues et al., 2006).
2. Objectives
1 Update the otter distribution map in the south-central region of Portugal and identify the factors influencing the species distribution in that region;
2 Compare the present and 1995 spatial distribution patterns and address the temporal trend after 20 years;
3 Identify areas where species is absent and important areas for otter conservation; 4 Propose conservation measures for sustaining otter populations.
3. Methods
3.1. Study Area
Located in the south-central region of Portugal, the selected study comprises three hydrographic regions (Tejo, Sado and Guadiana) andextends from Portalegre (east) to the Atlantic shore (west) and from Leiria (north) to Ourique (south).
Giving the time and financial constrains to a nation-wide survey (corresponding to 986 10x10 km UTM squares), the study area was selected based on the following criteria: (i) sub-sample of the total area surveyed in 1995 (Trindade et al., 1998), including both confirmed otter presence and absence areas; (ii) inclusion of the largest critical areas for otters identified in 1995; (iii) inclusion of has many river basins as possible, like Sado river basin that were also subsampled (50% of area) in 2002 (Sales-Luís et al., 2012), and (iv) preference for areas subject to environmental pressures.
Based on the above mentioned criteria, 4 river basins and one coastal region were fully or partially surveyed, totalising 300 10x10km UTM squares (Fig. 1) distributed as follows:
Tejo hydrographic region (202 UTM squares) - largest region in the study area, and where most negative results were found in 1995 (Trindade et al., 1998), being sub-divided in three areas:
o Lis river basin (11 squares);
o Tejo river basin, sub-divided in five areas: Tributaries of right bank (26 squares); Tributaries of left bank (35 squares); Sorraia river basin (56 squares); Zêzere river basin (25 squares);
Tejo estuary, Costa da Caparica and Arrábida (15 squares). o West coastal riverine region between Lis and Tejo basins (34 squares). Sado hydrographic region (80 squares);
Figure 1. Study area divided in basins and sub-basins. CLT (Costal area between Liz and Tejo basins), GUA (Guadiana river basin), LIZ (Lis river basin), SAD (Sado river basin), SOR (Sorraia river basin), TCA (Tejo estuary, Costa da Caparica and Arrábida), TDR (Tejo river right bank tributaries), TEQ (Tejo river left bank tributaries), ZEZ (Zêzere river basin).
3.2. Otter Survey
Otter surveys followed the standard method proposed by Macdonald (1983) and recognised by IUCN Otter Specialist Group (OSG) for large scale monitoring purposes (Reuther et al., 2000). In a geographic information system (GIS) program, Quantum GISTM, the study area
was divided into the 10 x10 km square grid (Fig. 1). In each square, one or two transects, with maximum length of 600m, were performed on freshwater bodies, ending as soon as an otter sign was found. If no evidence of otter presence was found in these transects, three spot checks (20-25m of length) were conducted in optimal marking sites (e.g. under bridges or in river junctions), based on previous knowledge on the species marking activity (Foster-Turley et al., 1990). Presence signs assumed the form of tracks, spraints (otter scats) and jellies (viscous anal secretions). Conducted between September 2014 and April 2015, transects were established, as much as possible, in exact same places selected in the 1995 study (Trindade et al., 1998) in order to allow data comparability.
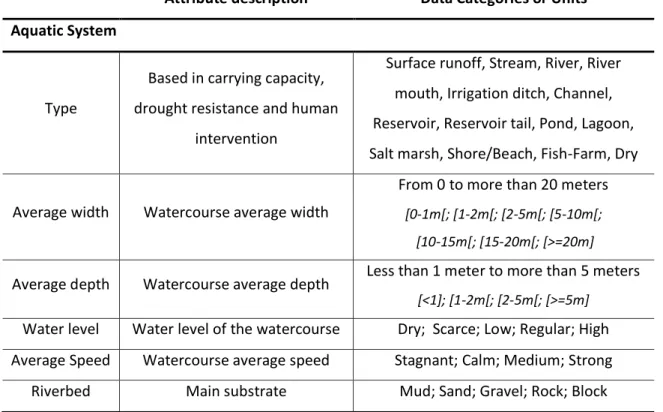
For each sampling site, besides the type and quantity of otter signs, information was registered about the aquatic system, vegetation cover and human intervention for posterior analysis at the local scale (Table 1). Besides the positive/negative dichotomy, when freshwater was unavailable negative squares were classified as dry squares.
Table 1. Local scale attributes of sampling sites for otter survey.
Attribute description Data Categories or Units
Aquatic System
Type
Based in carrying capacity, drought resistance and human
intervention
Surface runoff, Stream, River, River mouth, Irrigation ditch, Channel, Reservoir, Reservoir tail, Pond, Lagoon, Salt marsh, Shore/Beach, Fish-Farm, Dry
Average width Watercourse average width
From 0 to more than 20 meters [0-1m[; [1-2m[; [2-5m[; [5-10m[;
[10-15m[; [15-20m[; [>=20m]
Average depth Watercourse average depth Less than 1 meter to more than 5 meters [<1]; [1-2m[; [2-5m[; [>=5m]
Water level Water level of the watercourse Dry; Scarce; Low; Regular; High Average Speed Watercourse average speed Stagnant; Calm; Medium; Strong
Table 1 (cont.). Local scale attributes of sampling sites for otter survey.
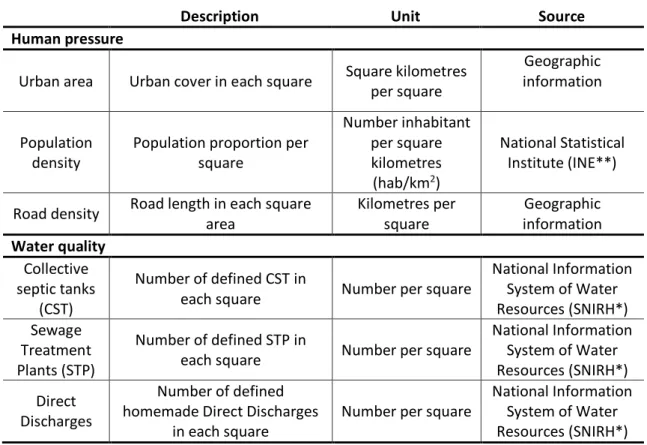
While local scale attributes characterise transects / spot checks sites, study area (macroscale) attributes reflect availability in each 10x10 km square. Macroscale parameters were chosen accordingly to their relevance for otter ecology (e.g. Beja, 1992; Prenda et al., 2001; Ruiz-Olmo and Jiménez, 2008; Pedroso et al., 2014b) and classified in three types: water availability, human pressure and water quality (Table 2).
Table 2. Macroscale attributes used to describe each surveyed 10x10km square.
Description Unit Source
Water availability
River Order (1 to 6)
Watercourses length grouped by Strahler classification
(e.g. Order 1 without parenting watercourse; Order
X+1 result of at least two Order X watercourses junction) Kilometres per square Geographic information Total River Length
Watercourses length in each square Kilometres per square Geographic information Order Diversity Shannon–Wiener index of watercourse orders diversity
in each square
Number per square Geographic information Area of Large
Reservoirs
Area of large and medium reservoirs in each square
Square kilometres
per square GoogleEarth
TM
Area of Small Reservoirs
Number of small reservoirs in
each square Number per square GoogleEarth
TM
Monthly Precipitation
Average rainfall in survey each survey month Square millimetres per square National Information System of Water Resources (SNIRH*)
Attribute description Data Categories or Units
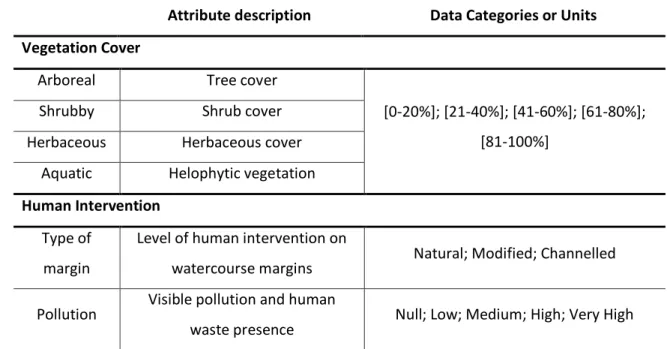
Vegetation Cover
Arboreal Tree cover
[0-20%]; [21-40%]; [41-60%]; [61-80%]; [81-100%]
Shrubby Shrub cover
Herbaceous Herbaceous cover Aquatic Helophytic vegetation
Human Intervention
Type of margin
Level of human intervention on
watercourse margins Natural; Modified; Channelled
Pollution Visible pollution and human
Table 2 (cont.). Macroscale attributes used to describe each surveyed 10x10km square.
Description Unit Source
Human pressure
Urban area Urban cover in each square Square kilometres per square
Geographic information
Population density
Population proportion per square Number inhabitant per square kilometres (hab/km2) National Statistical Institute (INE**)
Road density Road length in each square area Kilometres per square Geographic information Water quality Collective septic tanks (CST) Number of defined CST in
each square Number per square
National Information System of Water Resources (SNIRH*) Sewage Treatment Plants (STP) Number of defined STP in
each square Number per square
National Information System of Water Resources (SNIRH*) Direct Discharges Number of defined homemade Direct Discharges
in each square
Number per square
National Information System of Water Resources (SNIRH*)
SNIRH* - (http://snirh.apambiente.pt/); INE** - (https://www.ine.pt/xportal/xmain?xpgid=ine_main&xpid=INE)
3.3. Statistical analysis
The comparative analysis of the otter surveys of 1995 and 2014/2015 was mostly descriptive, considering the limitations of using a binary variable like otter’s presence/absence. Nevertheless, the McNemar’s chi-square test (Siegel and Castellan, 1988) was used to show if there was significant changes in otter’s presence/absence between the study years and among the sampled sub-basins.
Multivariate logistic regression was used to determine the effect of the macroscale attributes (environmental and human-related explanatory variables) on the presence/absence of otter in each square and therefore identifying the combination of variables that explain otter’s distribution. This analysis can use categorical and non-normally distributed data and also continuous and/or normally distributed data, since linearity between the dependent and each explanatory variable is ensured (Hosmer and Lemeshow, 2000). The linearity of the continuous explanatory variables was initially checked with the Box-Tidwell test at a significance level of 0.05 (Menard, 2001). As this assumption was violated all the explanatory variables were categorized, based on their quartiles, and data linearity was checked again using the Mantel–
variables were coded as categorical variables (dummy variables) and linear categorized variables were treated as continuous in the logistic regression procedure (Hosmer and Lemeshow, 2000)
The association between the explanatory variables and the presence/absence of otter was tested using the maximum likelihood method (Hosmer and Lemeshow, 2000). A stepwise forward selection procedure was applied, based on the Wald’s test (Hosmer and Lemeshow, 2000). The type and degree of association of each variable with the presence of the species was determined using the odds ratio (ψ). To assess the fit of the model, the Likelihood ratio test (G-test) and a classification table were used. The G-test compared the deviance of the model considering only the constant versus the final model, based on a chi-squared distribution at a significance level of 0.05 (Hosmer and Lemeshow, 2000).
Multicollinearity is a statistical phenomenon in which predictor variables in a logistic regression model are highly correlated, leading to unreliable and unstable estimates of regression coefficients. This problem was overcome by retaining only the most biologically meaningful variable in the analysis, for pairs of variables with Pearson’s correlation coefficient higher than 0.70.
In an effort to further detail the relationships between the macroscale attributes and otter’s distribution, a Principal Component Analysis (PCA) of each square was performed, codifying the samples based on the presence/absence of otter and on the sampled sub-basins. The PCA was complemented with a Hierarchical Cluster Analysis of the same data using the complete-Linkage method and the Euclidean distance as dissimilarity measure (dendrogram not shown) in order to identify groups of squares based on the environmental and human-related explanatory variables. These groups were then overlaid on the PCA biplot, allowing a joint interpretation of the results. Prior to these analyses, continuous data were ln (x + 1) transformed to improve normality (Legendre and Legendre, 1998).
4. Results
4.1. Otter Survey
Of the total 300 grid squares (10x10 km) surveyed for otter presence, 4.3% were classified as “Dry”, since freshwater was unavailable permanently or temporally, at the moment of field work. The remaining 88.3% were scored as positive and 7.3% has negative. For statistical propose “Dry” count as “Negative” for otter presence, once the field work was made in the rainy seasons (Fall, Winter and early Spring) and no signs of water was found.
Survey results highlighted two main areas of otter’s absence namely near Porto de Mós and surrounding Tejo estuary (Figure 2).
As figure 3A shows, 14 types of aquatic systems were surveyed. The most surveyed systems were “Stream”, “River” and “Reservoir”. “Channel”, “Shore/beach”, “River mouth”, “Fish-farm”, “Salt marsh” and “Dry” showed propensity to negative results for otter presence (Figure 3B). Inversely, “Reservoir tail”, “Pond”, “Lagoon”, “Surface runoff” and “Irrigation ditch” apparently proved to be favourable habitats for otters (Figure 3B).
Figure 3. Percentage of each type of aquatic system surveyed (A); Comparison of otter’s presence results for each type of aquatic system (B) Stream 43.4% River 31.9% Reservoir 9.7% Chanel 2.9% Irrigation ditch 2.7% Dry/ No access 2.4% Pond 1.3% Surface runoff 1.3% Salt marsh 1.3%
River mouth 1.1% Reservoir Tail 0.5% Shore/Beach 0.5% Lagoon 0.5% Fish-farm 0.3% Others 7.0% 0% 20% 40% 60% 80% 100% Positive Negative
A
B
Most of otter positive sites are characterized by a regular presence of water, natural margins and a dense herbaceous cover (Figure 4A, B and C). In other hand, increased flow speed, dense shrubby cover, pollution and a lack of aquatic vegetation seem to have a negative effect on otters (Figure 4D, E, F and G, respectively). Variables like width and depth and arboreal cover suggest not having an influence in otter’s distribution (Figure 4H, I and J). Finally, the main substrate of the water body bed (Figure 4K) has barely any influence on otter’s presence but its size can influence detectability of otter’s signs.
Figure 4. Graphic analysis relating each local scale attribute, collected in the field, and otter’s presence.
0% 10% 20% 30% 40% 50%
Dry Scarce Low Regular High
A. Water level
0% 10% 20% 30% 40% 50% 60%B. Type of margin
Positive Negative 0% 5% 10% 15% 20%C. Herbaceous Coverage
0% 5% 10% 15% 20% 25% 30% 35%D. Average Speed
Positive Negative 0% 5% 10% 15% 20% 25% 30%E. Shrubby Vegetation
Coverage
0% 5% 10% 15% 20% 25% 30% 35% 40%F. Pollution level
Positive Negative
Figure 5 (cont.). Graphic analysis relating each local scale attribute, collected in the field, and otter’s presence.
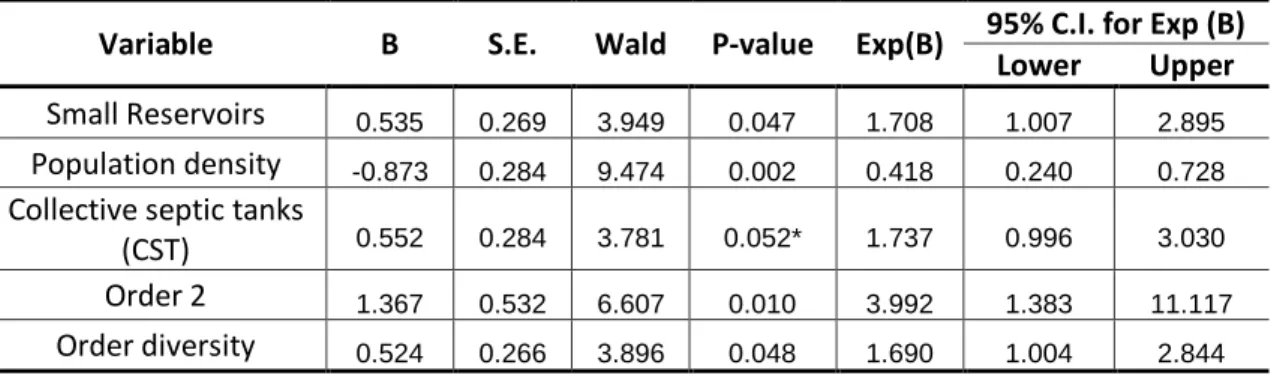
Binary logistic regression best model (R2 = 45%) show the relationship between otter’s
presence and the defined macroscale attributes (Table 3). All attributes retained in the model show significant (P < 0.05) or nearly significant (CST) relations the response variable. Order 2 watercourses are the most important for otter presence and, inversely to the other attributes, population density seems to have a negative impact on otter presence (B negative).
0% 10% 20% 30% 40%
G. Aquatic Vegetation
Coverage
0% 5% 10% 15% 20% 25%H. Average width (m)
Positive Negative 0% 10% 20% 30% 40% 50% <1 1 a 2 2 a 5 >5I. Average depth (m)
0% 10% 20% 30% 40%J. Arboreal Vegetation
Coverage
Positive Negative 0% 5% 10% 15% 20% 25% 30% 35%Mud Sand Gravel Rock Block
K. Riverbed
Positive Negative
Table 3. Summary of macroscale attributes retained in the best model defined by logistic regression. *- p-value nearly significant and therefore included in the model
Variable B S.E. Wald P-value Exp(B) 95% C.I. for Exp (B)
Lower Upper
Small Reservoirs 0.535 0.269 3.949 0.047 1.708 1.007 2.895
Population density -0.873 0.284 9.474 0.002 0.418 0.240 0.728
Collective septic tanks
(CST) 0.552 0.284 3.781 0.052* 1.737 0.996 3.030 Order 2 1.367 0.532 6.607 0.010 3.992 1.383 11.117
Order diversity 0.524 0.266 3.896 0.048 1.690 1.004 2.844
The resulting model shows a good performance explaining 90% of the variance (Table 4). Its explanatory value is even more relevant if we consider the correct classification of otter presence (96.2%) by opposition to correct classification of otter absence (45.7%).
Table 4. Classification table of the best model defined by logistic regression
Predicted
Otter’s presence Percentage Correct
0 1
Otter’s Presence 0 16 19 45.7
1 10 255 96.2
Overall Percentage 90.3
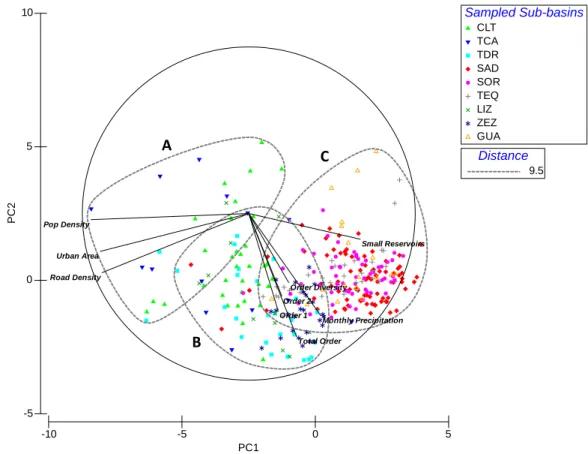
PCA results (Figures 5 and 6) are in agreement of the previous result as a clear segregation is observed between surveyed squares on the basis of its macroscale attributes and reveals a good explanation of data variability (54.1%). Although all variables were used in these procedures, just the ones showing correlation with the two first components (axis), and therefore important variables for data discrimination (|r| >= 0.5; P < 0.05), are shown: Small reservoir, Population Density, Urban area and Road density for the 1st axis (PC1) and Order 1,
Order 2, Total order, Order diversity and Monthly precipitation for the 2nd axis (PC2). Graphical
analysis show a good relation between variables and otter’s presence (Figure 5) and a geographical gradient per sub-basin (Figure 6) mostly defined by PC1. Alongside with the PCA, a Hierarchical Cluster Analysis (HCA) was conducted in order to group squares with similar response to variables. The three resulting groups are defined in Figures 5 and 6 by A, B and C and allowed the identification of the geographical gradient.
Figure 5. PCA results concerning otter’s presence per surveyed square based in all macroscale attributes. Only those correlated with PCA axis are showed. A, B and C are the clusters formed by HCA at the Euclidean distance of 9.5 as dissimilarity measure.
Figure 6. PCA results per surveyed square and sub-basin based in all macroscale attributes. Only those correlated with PCA axis are showed. A, B and C are the clusters formed by HCA at the Euclidean distance of 9.5 as dissimilarity measure. -10 -5 0 5 PC1 -5 0 5 10 P C 2 Otter presence/absence 0 1 Distance 9.5 Order 1 Order 2 Total Order Small Reservoirs Monthly Precipitation Urban Area Pop Density Road Density Order Diversity -10 -5 0 5 PC1 -5 0 5 10 P C 2 Sampled Sub-basins CLT TCA TDR SAD SOR TEQ LIZ ZEZ GUA Distance 9.5 Order 1 Order 2 Total Order Small Reservoirs Monthly Precipitation Urban Area Pop Density Road Density Order Diversity A A B C C B
4.2. Data comparison of the 1995 and 2015 surveys
Comparing today’s results - 265 (88.3%) of positive squares for otter presence – with those obtained in 1995 - 239 (79.1%) (Figure 7 – Trindade et al. 1998), an increase of 9.2% is observed for the otter occurrence in the area. This represents an overall positive evolution of otter’s distribution, although otters are still absent in some areas (Figure 2).
Analysing results at the square level (Figures 8 and 9), 85% maintain the same result (stable) as in 1995, 12% are now positive (expansion) and just 3% change from positive to negative (retraction). In relation to sub-basins (Figure 1), McNemar’s test results showed that only Tejo river right bank tributaries (TDR) had significant changes (p < 0.001) (Table 5), once 13 squares here previously negative and are now positive (Appendix 2). Lis and Sorraia river basins were the only ones where no change was observed along this 20 year period.
Figure 8. Otter distribution trend (% of change) between 1995 and 2015 surveys. Stable – no change; Expansion – negative squares in 1995 that are positive in 2015; Retraction – positive squares in 1995 that turn negative in 2015.
Figure 9. Comparison of otter distribution between 1995 and 2015 surveys. Stable – no change; Expansion – negative squares in 1995 that are positive in 2015; Retraction – positive squares in 1995 that turn negative in 2015.
85% 12% 3% Stable Expansion Retraction
Table 5. McNemar’s Test results per sub-basin. NA (Not Applicable) – Sub-basins without changes.
McNemar's χ2 df P-value
Tejo estuary, Costa da Caparica and Arrábida (TCA) 0 1 1
Guadiana river basin (GUA) 0 1 1
Lis river basin (LIZ) NA 1 NA
Riverine Costal between Lis and Tejo basins (CLT) 4.5 1 0.034
Sado river basin (SAD) 0 1 1
Sorraia river basin (SOR) NA 1 NA
Tejo river right bank tributaries (TDR) 11.077 1 0.001
Tejo river left bank tributaries (TEQ) 0 1 1
Zêzere river basin (ZEZ) 0.5 1 0.480
In a partial study conducted by Farinha (1999) in 1998 (where sampled 10x10 km squares are randomly surveyed), Tejo river basin and riverine costal region between Lis and Tejo basins had already some improvement in otter distribution (7 and 1 squares expansion, respectively). On the other hand, Sado river basin showed a retraction in 2 squares, between 1995 and 1998 (Farinha, 1999). In a more recent study (Sales-Luís et al., 2012), Sado river basin results maintain stable when compared to 1995 in the wet season though when compared to this work (2015) there is a retraction of 1 square.
4.3. Priority sites for conservation
As a result of the 1995 survey, Trindade et al. (1998) defined some areas as critical for otter conservation, considering the large areas with scarce otter presence and high disturbance factors that, according to the authors, put in risk population viability. Of the four defined areas, the two largest ones, North of Lisbon and Setúbal Peninsula, are included in the present surveyed area (Figure 10A). In 2015 survey showed a more favourable situation as from a total of 28 positive squares in 1995 an increase to 52 positive squares was observed in 2015 (Figure 10B).
Figure 10. Critical areas defined by Trindade et al. (1998) overlapped with results of 1995 (A) and 2015 (B) surveys. For statistical propose “Dry” count as “Negative” for otter presence.
Based on otter’s relative abundance and in the size and quality (state of conservation) of aquatic environments, Trindade et al. (1998) also defined 86 important sites named as Conservation Priority Sites. Eighteen of these are included in the study area (Figure 11). These sites were divided in three categories: priority site (High Priority); important site (Medium Priority); and site under consideration (Low priority), for otter’s conservation. As Figure 11 shows, priority sites in the study area have different sizes and shapes and the Low priority ones that had a strong incidence of otter’s absence in 1995 stay fairly stable (still negative) in the 2015 survey. Overall, the observed expansion of the otter’s distribution does not alter the status at the Priority Sites, once both years’ results are similar.
Figure 11. Important sites for otter’s conservation defined by Trindade et al. (1998) overlapped with distribution trend between 1995 and 2015.
4.4. Efficiency of the survey method
In order to test the efficiency of the combined survey method a comparison was made between spot checks and transect results. Testing distance as a factor for otter presence, the focus was to try to understand the minimum sampling distance for otter detection (Figure 12). For comparative purposes, spot check results and its sampling order (if otter was detected on the 1st, 2nd or 3rd spot) was also addressed (Figure 13). As shown in figure 12, almost all otter’s
signs (97%) were found within the 250m mark and most of them (81%) even until the 50m mark. On the other side, the last spot checks have in overall a better result than the first spot checks (Figure 13). Across the entire field work, for a total of 366 surveys, 265 were transects (of which 236 positive for otter presence) and 101 were spot checks (29 positive for otter presence).
Figure 12. Transects evaluation by distance classes in meters. Once a transect end with an otter sign or at 600m all data is from positive transects.
Figure 13. Spot checks evaluation by sampling order
0 20 40 60 80 100 120 140 160 180 0 50 100 150 200 250 300 350 400 450 500 550 600 N u mb er o f tr an sect s Distance (m) 3 19 7 51 20 1 1st 2nd 3rd N u mb er o f Sp o t C h eck s
Spot Checks Surveyed Order
Positive Negative
5. Discussion
5.1. Otter Survey
Although merely in a descriptive way, this study allowed to relate otter presence with the type of surveyed system and its local scale characteristics. Being a semi-aquatic species, otter presence was expected in places with freshwater availability (e.g. Beja, 1992; Prenda et al., 2001) and, as much as possible, in areas with adequate conditions for refuge and cover (Barbosa et al., 2001). Strong flows and lack of aquatic vegetation, which improves the evasion or explains absence of otter prey (Basto et al., 2011), human interventions like watercourses channelling and pollution (Trindade et al., 1998), and apparently water salinity (shores, beaches and salt marshes), characterize the areas where surveys were negative for otters. Nevertheless, it is known that coastal otters can feed in marine waters (Beja, 1997), although individuals need freshwater availability to wash the fur in order to preserve its insulating capacity (Beja, 1992). In spite of the few sampling sites on marine waters, the negative results seem more related to other conditions, like human pressure, rather than by the aquatic systems themselves.
Negative surveys are also related to a high density of shrubs. This influence may be associated to a decrease in potential marking sites and lack of detectability from the observer and not a direct result of otter absence. A higher percentage of cover usually implies more refuge, which is considered advantageous for the species. This negative association between cover and otter detection was already referred by Pedroso et al. (2007) which stated that more cover also negatively affects the number of conspicuous sprainting sites and consequently may lead to false absences.
Water body substrate composition appears to have little influence on otter presence but may bias otter marks detectability (Reid et al., 2013). In thinner materials, like mud or sand, due to the compact property is easy to find otter’s footprints but in larger materials, like rocks and blocks, spraints are the ones that can be easily detected. On the other hand, in gravel it is harder to find footprints or spraints, due to their size, shape and colours can be hard to detect.
On the macroscale analysis, and as defined by the logistic regression results, small reservoirs, population density, collective septic tanks, order 2 watercourses and watercourses order diversity are the attributes that influence otter presence at the 10x10km scale. Small reservoirs, Order 2 and Order diversity, all showing a positive relation with otter presence, are directly associated to water availability. Small reservoirs, commonly used for cattle raising and
agriculture purposes in southern Portugal where most of watercourses are dry in summer, are a suitable alternative as otter’s foraging territories (Prenda et al., 2001; Basto et al., 2011). Order diversity and Order 2 variables give two different views of the freshwater lotic grid. On one hand, Order diversity means the overall available watercourses, independently of size, length or water capacity. On the other hand Order 2 is the second most significant attribute (P=0.010) and represent permanent watercourses by opposition to Order 1 watercourses, that are smallest and consequently ephemeral, being dry during most of the year . Order 2 are also the most common type of stream/rivers available in the study area. Overall these attributes are indicators of permanent freshwater availability considered the most important factor for otter’s distribution mainly in summer (Beja, 1992; Prenda et al., 2001; Pedroso et al., 2014a). Population density, the most significant variable of the model, has a negative association with otter’s presence (Barbosa et al., 2001). Being a top predator, otters have few or non-potential threats in the study area relatively to predators. Human presence on the other hand can cause several problems to otter conservation like habitat loss modification (e.g. water drainage, riparian vegetation degradation) or accidental killings (e.g. road kills). Although not a significant variable per si, Collective septic tanks was included in the regression model, but oddly had a positive association with otter’s presence. This interaction can be probably explained by the increase of organic material in water systems and consequently the increase of its productivity positively influencing otter prey, since most of these discharges into the aquatic system are of human disposal (organic material) and not of industrial nature.
As the logistic regression model results, also the PCA results demonstrate water availability variables strongly associated with the positive survey results. On the other hand human pressure variables, like population density, appears to strongly influence most of otter’s absence, mainly when water availability is scarce. The same applies to sub-basins with clustering analysis identifying a geographic subdivision. Setúbal Peninsula (A) represents a small and highly populated region with a Mediterranean temperate climate and a lack of freshwater systems. On the other hand the right side of Tejo river (B) is dominated by watercourses of diverse orders and a maritime climate that makes precipitation a key variable to maintain water availability, but some large and high density urban areas occur in left side of the river. Finally, we found the south basins (C), in a low human density area, mostly with Mediterranean temperate climate, relying on reservoirs as freshwater principal resource.
5.2. Surveys comparison and priority sites for conservation
In 20 years, otter’s distribution denotes an expansion of almost 10% (79.1% in 1995 to 88.3% in 2015). This increase is related to the improvement of Tejo river right bank tributaries, probably because of water quality management and American crayfish invasion. In this work, otter feeding habits were not considered. Nevertheless a rough observation of the spraints found during fieldwork showed that most of the spraints were mainly composed of crayfish, an invasive widespread freshwater crustacean known to be a very important prey species for otter, namely in the study area (Beja, 1996; Sales-Luís et al., 2007).
According to the 1995 survey (Trindade et al., 1998), the regions at North of Lisbon and Setúbal Peninsula were two critical areas for otter conservation at the national level. Present results, twenty years apart, show an improved situation with a large number of positive squares in the CLT+TDR (Figure 10B) while Setúbal Peninsula critical area stayed fairly the same. The large region at North Lisbon seems now to be divided in two smaller critical areas, Lisbon region at south and Porto de Mós surroundings at north (Appendix 3).
Of all important areas for otter conservation, high and medium priority sites as defined by Trindade et al. (1998), showed positive results for otter presence. Compared to the other classes, Low priority sites have worst results, with fairly half of their squares as negatives, but in overall this results stay similar to Trindade et al. (1998) results. The main area of today’s otter absence locates in the Setúbal Peninsula, a dry and heavy populated region that remained mostly negative after 20 years. The other two otter absence areas, previously in the same large area, are now divided and overlaps almost exactly with two low priority sites defined in 1995 (Trindade et al. 1998).
5.3. Survey’s method efficiency
Field work results show that shortening the standardized 600m transects has no influence on the survey outcomes once after 250m it is unlikely to find otter signs. This results are in agreement with the ones of 1998 partial national census (Farinha, 1999), where 87% of positive surveys were under 200m. When transects are unavailable or negative, the IUCN standard methodology recommends to survey a maximum of three ideal places to find otter’s marks, the called spot checks. This practice requires some time and fund resources and a selection criteria of proximity was applied, but close (the 1st) spot checks showed the worst
results. Negative results like this could be caused by the same factors that prevent otter presence detection on sampled transects. In some squares no spot checks could be performed mostly because of inexistent freshwater sites or inaccessible ones. In these conditions, surveyed sites are not optimal but the possible ones.
The comparison of transects and spot checks results, suggest the appropriateness of some changes in standard field methodology for otter monitoring. For instance, there is few or no benefit of conducting 600m transects, as shorter ones (e.g., 400m) should suffice. Another methodological change could be to increase the spot checks length from 25m to 50m, once our results show that 81% of the otter’s signs were found under the 50m mark. Finally, doing firstly the spot checks should allow a quicker survey, and transects could work as last resort.
6. Conclusion
In summary, Eurasian otter distribution in the study area is mostly positively influenced by freshwater availability. When water is a limiting factor and the negative impact of human population density is too high, there are no conditions for otter’s occurrence (e.g. critical areas). Probably even more important than human density, but still related, is the lack of habitat for otters caused by water pollution and human’s nature-changing actions, like watercourses channelling. Nevertheless, the positive evolution of otter distribution throughout the last two decades is clear.
In general, population decrease is a fast process but their recovery, as well as their habitat recovery, is a slow, expensive and sometimes unsuccessful process (Foster-Turley et al., 1990). In Portugal, previous studies suggest a healthy population but this assumption is solely based on otter distribution data as no population estimates were ever made at the national level. To prevent a similar fate as other European populations that in the past became extinct or threatened it is important to establish some practical conservation measures:
- Population monitoring at regular intervals to estimative population size - by molecular analysis of spraints, visual individuals counting or videotaping (depending on human and financial resources) – and population shifts;
- Establish legal and/or structural measures to reduce road kills and watercourses modifications;
- Promote effective protection of the Conservation Priority Sites, especially those ranked as high and medium priority;
- Establish tighter control of watercourse pollution;
- Reinforce environmental education actions of the human populations, mainly the ones directly related to freshwater habitats (e.g. fishermen and fishfarmers).
References
Barbosa, A.M., Real, R., Márquez, A.L., Rendón, M.Á., 2001. Spatial, environmental and human influences on the distribution of otter (Lutra lutra) in the Spanish provinces. Divers. Distrib. 7, 137–144.
Basto, M., Pedroso, N., Mira, A., Santos-Reis, M., 2011. Use of small and medium-sized water reservoirs by otters in a Mediterranean ecosystem. Anim. Biol. 61, 75-94.
Beja, P.R., 1992. Effects of freshwater availability on the summer distribution of otters Lutra lutra in the southwest coast of Portugal. Ecography (Cop.). 15, 273–278.
Beja, P.R., 1996. An analysis of otter Lutra lutra predation on introduced American crayfish Procambarus clarkii in Iberian streams. J. Appl. Ecol. 33 (5), 1156-1170
Beja, P.R., 1997. Predation by marine-feeding otters (Lutra lutra) in south-west Portugal in relation to fluctuating food resources. J. Zool. London 242, 503–518.
Bernardo, J.M., 2008. Influência antropogénica na distribuição de lontra (Lutra lutra). Master thesis. Universidade de Aveiro. Aveiro.
Blanco-Garrido, F., Prenda, J., Narvaez, M., 2008. Eurasian otter (Lutra lutra) diet and prey selection in Mediterranean streams invaded by centrarchid fishes. Biol. Invasions 10, 641– 648.
Cabral, M.J., Almeida, J., Almeida, P.R., Dellinger, T., Ferrand d’Almeida, N., Oliveira, M.E., Palmeirim, J.M., Queiroz, A.L., Rogado, L., Santos-Reis, M. (Eds.), 2005. Livro Vermelho dos Vertebrados de Portugal. Instituto da Conservação da Natureza, Lisboa.
Cabral, M.J., Magalhães, C.P., Oliveira, M.E. & Romão, C. 1990. Livro Vermelho dos Vertebrados de Portugal, vol. I – Mamíferos, Aves, Répteis e Anfíbios. Serviço Nacional de Parques, Reservas e Conservação da Natureza, Lisboa. 219 pp.
Calzada, J., Delibes-Mateos, M., Clavero, M., Delibes, M., 2010. If drink coffee at the coffee-shop is the answer, what is the question? Some comments on the use of the sprainting index to monitor otters. Ecol. Indic. 10, 560–561.
Clavero, M., Ruiz-Olmo, J., Sales-Luís, T., Blanco-Garrido, F., Romero, R., Pedroso, N.M., Prenda, J., 2008. Lo que comen las nutrias ibéricas. La nutria en España. Veinte años de
seguimiento de un mamífero amenazado. pp. 345–367. SECEM, Málaga.
Cortés, Y., Fernández-Salvador, R., García, F.J., Virgós, E., Llorente, M., 1998. Changes in otter
Lutra lutra distribution in Central Spain in the 1964-1995 period. Biol. Conserv. 86, 179–
183.
Farinha, N., 1999. Distribuição da Lontra Lutra lutra em Portugal continental. Situação de 1998. Instituto da Conservação da Natureza.
Freitas, D., Gomes, J., Luis, T.S., Madruga, L., Marques, C., Baptista, G., Rosalino, L.M., Antunes, P., Santos, R., Santos-Reis, M., 2007. Otters and fish farms in the Sado estuary: Ecological and socio-economic basis of a conflict. Hydrobiologia 587, 51–62.
Foster-Turley, P., MacDonald, S., Nason, C., 1990. Otters: an action plan for their conservation. IUCN Species Survival Commission. IUCN. Gland.
Guter, A., Dolev, A., Saltz, D., Kronfeld-Schor, N., 2007. Using videotaping to validate the use of spraints as an index of Eurasian otter (Lutra lutra) activity. Ecol. Indic. 1–5.
Hosmer, D.W., Lemeshow, S., 2000. Applied Logistic Regression (2nd Edition). Wiley, New York.
Jiménez, J., López-Martin, J. M., Ruiz-Olmo, J., Delibes, M., 2008. ¿Por qué se está recuperando la nutria en España? La nutria en España. Veinte años de un mamífero amenazado. pp. 273-304. SECEM, Málaga.
Kruuk, H., 2006. Otters: ecology, behaviour, and conservation. Oxford University Press, Oxford Kruuk, H., Conroy, J.W., 1987. The use of spraints to survey populations of otters Lutra lutra.
Biol. Conserv. 35, 187-194.
Legendre P, Legendre L. 1998. Numerical Ecology (2nd edition). Elsevier, Amsterdam
MacDonald, S.M., 1983. The status of the otter (Lutra lutra) in the British Isles. Mammal Review. 13, 11-23.
MacDonald SM, Mason CF (1994) Status and conservation needs of the otter (Lutra lutra) in the Western Palaeartic. Council of Europe Press. Nat Environ 67:1–54
McDonald, J.H. 2014. Handbook of Biological Statistics (3rd edition). Sparky House Publishing, Baltimore, Maryland
Menard, S. 2001. Applied Logistic Regression Analysis. Sage University Papers Series on Quantitative Applications on Social Sciences, 07-106. Thousand Oaks, CA, Sage
Novais, A., Sedlmayr, A., Moreira-Santos, M., Gonçalves, F., Ribeiro, R., 2010. Diet of the otter Lutra lutra in an almost pristine Portuguese river: Seasonality and analysis of fish prey through scale and vertebrae keys and length relationships. Mammalia 74, 71–81. Pedroso, N.M., 2012. Otters and Dams in Mediterranean Habitats: A Conservation Ecology
Approach. PhD Thesis. Universidade de Lisboa Faculdade de Ciências, Lisboa.
Pedroso, N.M., Sales-luís, T., Santos-Reis, M., 2014a. The Eurasian otter Lutra lutra (Linnaeus, 1758) in Portugal. Munibe Monogr. Nat. Ser. 3, 133–144.
Pedroso, N.M., Marques, T. A., Santos-Reis, M., 2014b. The response of otters to environmental changes imposed by the construction of large dams. Aquat. Conserv. 24, 66–80.
Pedroso, N.M., Sales-Luís, T. & Santos-Reis, M. (2007) Use of Aguieira Dam by Eurasian otters in Central Portugal. Folia Zool. 56, 365–377.
Prenda, J., López-Nieves, P., Bravo, R., 2001. Conservation of otter (Lutra lutra) in a Mediterranean area: The importance of habitat quality and temporal variation in water availability. Aquat. Conserv. Mar. Freshw. Ecosyst. 11, 343–355.
Quaglietta, L., Fonseca, V.C., Hájková, P., Mira, A., Boitani, L., 2013. Fine-scale population genetic structure and short-range sex-biased dispersal in a solitary carnivore, Lutra lutra. J. Mammal. 94(3), 561-571.
Reid, N., Lundy, M.G., Hayden, B., Lynn, D., Marnell, F., McDonald, R. a., Montgomery, W.I., 2013. Detecting detectability: Identifying and correcting bias in binary wildlife surveys demonstrates their potential impact on conservation assessments. Eur. J. Wildl. Res. 59, 869–879.
Reuther, C., Dolch, D., Green, R., Jahrl, J., Jeffereies, D.J., Krekemeyer, A., Kucerova, M., Madsen, A., Romanowski, J., Roche, K., Riuz-Olmo, J., Teubner, J., Trindade, A., 2000. Surveying and monitoring distribution and population trends of the Eurasian otter (Lutra lutra). Habitat 12, 1-148.
Rodrigues, A. S., Pilgrim, J. D., Lamoreux, J. F., Hoffmann, M., & Brooks, T. M. (2006). The value of the IUCN Red List for conservation. Trends in Ecology & Evolution, 21(2), 71-76.
Roos, A., Loy, A., de Silva, P., Hajkova, P. & Zemanová, B. 2015. Lutra lutra. The IUCN Red List of Threatened Species. Version 2015.2. <http://www.iucnredlist.org/>. Downloaded on 26
June 2015.
Ruiz-Olmo, J., 2007. Lutra lutra (Linnaeus, 1758). Atlas los Mamíferos Terrestres de España 278– 281.
Ruiz-Olmo, J., Clavero, M., 2008. Los cangrejos en la ecología y recuperacíon de la nutria en la Península Ibérica. La nutria en España. Veinte años de seguimiento de un mamífero
amenazado. pp. 369–396. SECEM, Málaga.
Ruiz-Olmo, J., Jiménez, J., 2008. Ecología de la nutria en los ambientes mediterrâneos de la Península Ibérica. La nutria en España. Veinte años de seguimiento de un mamífero
amenazado. pp. 305–343. SECEM, Málaga.
Ruiz-Olmo, J., Saavedra, D., Jiménez, J., 2001. Testing the surveys and visual and track censuses of Eurasian otters (Lutra lutra). J. Zool. 253, 359–369.
Sales-Luís, T., Bissonette, J.A., Santos-Reis, M., 2012. Conservation of Mediterranean otters: The influence of map scale resolution. Biodivers. Conserv. 21, 2061–2073.
Sales-Luís, T., Pedroso, N.M., Santos-Reis, M., 2007. Prey availability and diet of the Eurasian otter (Lutra lutra) on a large reservoir and associated tributaries. Can. J. Zool. 85, 1125– 1135.
Siegel S, Castellan NJ. 1988. Nonparametric Statistics for the Behavioral Sciences (2nd edition). McGraw-Hill International Editions, New York
Trindade, A., Farinha, N., Florêncio, E., 1998. A distribuição da lontra Lutra lutra em Portugal. Situação em 1995. Instituto da Conservação da Natureza, Lisboa.
Appendix
Appendix 2. Sub-basins squares result per census in order to perform McNemar’s Test.
Tejo estuary, Costa da Caparica and Arrábida (TCA)
Survey 1995
Sorraia river basin (SOR)
Survey 1995
Positive Negative Positive Negative
Su rv ey 2015 Positive 3 2 Su rv ey 2015 Positive 56 0 Negative 1 9 Negative 0 0
Guadiana river basin (GUA)
Survey 1995 Tejo river right bank
tributaries (TDR)
Survey 1995
Positive Negative Positive Negative
Su rv ey 2015 Positive 14 1 Su rv ey 2015 Positive 8 13 Negative 1 2 Negative 0 5
Lis river basin (LIZ) Survey 1995 Tejo river left bank tributaries (TEQ) Survey 1995
Positive Negative Positive Negative
Su rv ey 2015 Positive 8 0 Su rv ey 2015 Positive 32 1 Negative 0 3 Negative 2 0
Riverine Costal between Liz and Tejo basins (CLT)
Survey 1995 Zêzere river basin (ZEZ)
Survey 1995
Positive Negative Positive Negative
Su rv ey 2015 Positive 9 14 Su rv ey 2015 Positive 23 2 Negative 4 7 Negative 0 0
Sado river basin (SAD) Survey 1995
Positive Negative Su rv ey 2015 Positive 77 2 Negative 1 0
Appendix 3. Critical areas defined by Trindade et al. (1998) overlapped with 2015 results. Grey circles represent actual (2015) critical areas.