WORKING PAPER SERIES
CEEAplA WP No. 11/2008
The poverty effect of remittance flows: evidence
from Georgia
Ainura Uzagalieva
The poverty effect of remittance flows: evidence
from Georgia
Ainura Uzagalieva
CEEAplA e CERGE -EI
Working Paper n.º 11/2008
Agosto de 2008
CEEAplA Working Paper n.º 11/2008 Agosto de 2008
RESUMO/ABSTRACT
The poverty effect of remittance flows: evidence from Georgia
The main purpose of this study is to analyze the poverty effect of remittance flows in Georgia through direct and indirect channels within the context of a modified computable general equilibrium model (CGEM). The main questions of interest are if and to what extent remittance flows contribute to the production and consumption pattern of the poor. Two aspects of poverty reduction are emphasized in this study: (1) the impact of remittances on the aggregated and sectoral economic growth; and (2) the impact of remittances on the poor households, their production and consumption patterns across regions. Apart from households’ factor endowments and consumption patterns, which are reported elsewhere, particular attention is paid to regional differences in terms of market access and transaction costs. The conclusion to be drawn from this study is that, while having a strong macroeconomic growth effect at the aggregated level, emigration and inward remittance flows do not affect all sectors and residents symmetrically. Moreover, they have a rather limited impact in terms of poverty and income inequality.
JEL Classification Codes: R13, O11
Ainura Uzagalieva
Departamento de Economia e Gestão Universidade dos Açores
Rua da Mãe de Deus, 58 9501-801 Ponta Delgada
The poverty effect of remittance flows: evidence from Georgia*
(a preliminary draft) Ainura Uzagalieva** (a) CEEAplA (b) CERGE-EI June, 2008 AbstractThe main purpose of this study is to analyze the poverty effect of remittance flows in Georgia through direct and indirect channels within the context of a modified computable general equilibrium model (CGEM). The main questions of interest are if and to what extent remittance flows contribute to the production and consumption pattern of the poor. Two aspects of poverty reduction are emphasized in this study: (1) the impact of remittances on the aggregated and sectoral economic growth; and (2) the impact of remittances on the poor households, their production and consumption patterns across regions. Apart from households’ factor endowments and consumption patterns, which are reported elsewhere, particular attention is paid to regional differences in terms of market access and transaction costs. The conclusion to be drawn from this study is that, while having a strong macroeconomic growth effect at the aggregated level, emigration and inward remittance flows do not affect all sectors and residents symmetrically. Moreover, they have a rather limited impact in terms of poverty and income inequality.
JEL Classification Codes: R13, O11
_________________________________________________________________________________________________ *) This study is supported by the EU 6th framework project “EU Eastern Neighbourhood: Economic Potential and Future Development (ENEPO)”. I gratefully acknowledge financial support by European Commission under the ENEPO project. I am indebted to Mathias Luecke from the Kiel Institute for the World Development for useful comments and suggestions enriching this study. I thank Levan Gogoberishvili from the Statistical Department of Georgia for providing the Georgian dataset and Kseniya Tereshchenko from CERGE-EI for extracting the data from Access databases.
**) Comments and suggestions are welcome. Corresponding the author: uzagali@uac.pt at the Centre of Applied Economics Studies of the Atlantic at the Department of Economics and Management, the University of the Azores and Ainura.Uzagalieva@cerge-ei.cz at the Economic Institute of the Academy of Science of the Czech Republic. The opinion of the author does not necessarily express the view of these institutions. All usual disclaimers apply.
1. Introduction
Poverty reduction is a policy priority important at both national and international levels, as stressed in the Millennium Development Goals. This calls for a careful consideration of issues involved in poverty reduction as well as adequate methodological tools for analyzing, understanding and reducing poverty. One of the most interesting issues in this context is the poverty effect of remittance flows in the low-income Commonwealth Independent States (CIS). These countries have experienced recently the large inflows of remittances, on the one hand, and an increase in poverty and inequality incidences, on the other. For example, 9 out of 12 CIS members are classified nowadays as low-income countries where the size of population groups with incomes falling bellow the average level is large (e.g. Simai 2006). At the same time, officially recorded remittances to this region increased substantially, making about 10% of remittances received by developing countries in overall (Quillin, Segni, Sirtaine and Skamnelos 2007). Since most of the CIS countries committed to reduce poverty incidence and eliminate extreme poverty by 2015, it is very important to understand whether and how remittance flows can contribute to the implementation of poverty reduction strategies.
The poverty implication of remittance flows, in both sending and receiving destinations, has been analyzed so far in many instances, however, only a few of these studies are focused on the CIS. This stems from a number of limitations intrinsic to the context of the post-communist countries. Namely, the phenomenon itself is relatively new in these countries, besides complex issues associated with the lack of adequate methodological tools as well as data for analyzing e.g. irregular migration, pervasive market imperfections with informal relations and kinship networks cause difficulties in analyzing carefully the phenomenon. For example, under market imperfections, as it was mentioned by Stiglitz (1994), the standard Arrow-Debreu macroeconomic models with a complete set of markets and optimizing agents are not expected to fully explain the economic issues
under question. In addition, the non-stationary data required at a reasonable level of disaggregation are beyond the statistical coverage in most of these countries. The purpose of this study, therefore, is to attempt to fill some gap in this area by focusing on the poverty implication of remittance flows in Georgia.
Georgia is a small country that has seen a significant outflow of migrants and, at the same time, a large inflow of foreign currency recently. While the available data only provide an incomplete picture, accumulated net migration since the beginning of the 1990s exceeded 880 thousand individuals (with some return migrants in 2004 and 2005).1 Inward remittances to Georgia amounted to more than US$ 800 million in 2006, equivalent to about 10.2% of GDP and 72.0% of the incoming foreign direct investments (US$ 1 100 million).2 The size of unofficial remittances is
also large, consisting about US$ 315 million or 39.4% of the total amount of remittances.3
Meanwhile, according to the official sources, about more than a third of population (35%) is below the national poverty line: Georgia is ranked 97th in the list of countries by human development index
in 2006.
The main purpose of this study is to analyze the poverty effect of remittance flows in Georgia through direct and indirect channels within the context of a standard social accounting matrix (SAM) based computable general equilibrium model (CGEM). The main questions of interest are if and to what extent a large size in the remittance flows contributes to the production and consumption pattern of the poor. Two aspects of poverty reduction are emphasized in this study: (1) the impact of remittances on the aggregated and sectoral economic growth; and (2) the impact of remittances on poor households, their production and consumption patterns across regions. In addition, this study
1 Statistical Yearbook of Georgia, 2007.
2 Georgian-European Policy and Legal Advice Centre (GEPLAC): Georgian Economic Trends, Quarterly Economic Trends, February, 2008.
3 Georgian-European Policy and Legal Advice Centre (GEPLAC): Georgian Economic Trends, Quarterly Economic Trends, October, 2007.
pays particular attention to regional differences in terms of market access and transaction costs, apart from households’ factor endowments and consumption patterns reported elsewhere.
The available Georgian data cover the national accounts, including the input-output transactions table, detailed balance of payments, annual report on household surveys,4 and raw data on household budget surveys for 2004. These surveys were conducted on 3551 households inhabiting in the capital city (Tbilisi) and 9 regions through the questionnaires “Shinda 04” for household expenditures, “Shinda 05” for private and state transfers to households, and “Shinda
05-1” for households income from employment and self-employment which are used in this study.5 The source of the data is the State Department for Statistics of Georgia (SDSG).
2. General macroeconomic and institutional environment in Georgia
Georgia is a relatively small and mountainous country with population of 4.5 million and area of 69.7 thousands sq. km. The topographical features of its territory are very contrasting including the Great Caucasian chain (5068 m. above the sea level), the medium height mountains (about 3000 m.) and inner lowlands (e.g. Kolkheti and Alazani) which are used predominantly for cultivating tea, citrus, grapes and other agricultural products (the arable area is about 11% of the territory). There are 12 regions in the country including a capital region (Tbilisi), two autonomous republics and 9 regions, which are geographically and economically very diverse. The macroeconomic structure of the economy, in terms of the average shares of value added and total output by regions (Table 1), shows that industry and service activities are concentrated mostly in the capital city Tbilisi and few other regions located predominantly at the inner lowlands (e.g. Region 4). Agriculture, which is more widespread across the regions, plays a crucially important role as a
4 SDSG: “Households of Georgia”, 2003-2004
5Shinda stands for the Georgian abbreviation of households observation (see State Department for Statistics of Georgia: “Households of Georgia, 2003-2004”).
source of production and employment. It accounts for about 21% in the gross value added and represents itself the largest employer of domestic labor (54%).
Table 1. The regions and main activities of Georgia
Regions Industry Hotels and restaurants
Transport and
communications Construction Agriculture
Georgia, total
including: 100.00 100.00 100.00 100.00 100.00
Kakheti Reg. 1 3.62 0.52 0.11 1.77 14.32
City of Tbilisi Reg. 2 43.47 77.83 78.99 63.00 0.10
Shida Kartli Reg. 3 7.51 1.67 0.07 4.61 7.33
Kvemo Kartli Reg. 4 21.36 1.64 1.87 4.44 18.67
Mtskheta-Mtianeti Reg. 5 3.71 5.32 0.10 2.38 4.71 Samtskhe-Javaketi Reg. 6 3.98 0.62 0.04 0.81 7.66 Adjaria Reg. 7 2.64 5.76 8.04 3.74 5.27 Guria and Racha-Lechkhumi Reg. 8 1.28 0.79 0.08 1.36 6.88
Samegrelo-Zemo Svaneti Reg. 9 1.83 2.10 10.32 14.51 16.62
Imereti Reg.10 10.59 3.76 0.37 3.39 18.45
Source: SDSG
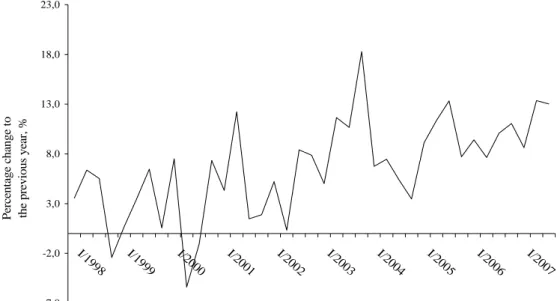
The macroeconomic situation in Georgia is characterized generally by high volatility (Figure 1) originated in the external as well as internal sources of instability. For example, a slowdown in the economic growth rates, from 11.7% in 2003 to 7.5% in 2006 at the annual basis, stems from the trade embargo imposed by Russia on Georgia in 2005 and 2006, as well as political instability and inflation factors within the country. According to the annual reports of the central bank of Georgia, the large sizes of current account (1.2 billion USD) and trade (2.0 billion USD) deficits in 2006 are originated in the fall of exports, followed the Russian trade embargo, and high prices for the imported mineral products, which have amplified inflation to 9% in 2006 relative to the 2000-2002 average rate of 5%. Additional inflation factors are the large inward remittances and capital flows in
foreign currency since, under underdeveloped domestic capital markets, the central bank has limited capacity to sustain large sterilized interventions. In addition to this, frequent changes in the domestic policy regimes and political instability under weak domestic institutions cause additional shakiness in the economy. All these suggest that domestic macroeconomic situation is not easily controlled by the local policy-makers in Georgia.
-7,0 -2,0 3,0 8,0 13,0 18,0 23,0 I/199 8 I/199 9 I/200 0 I/200 1 I/200 2 I/200 3 I/200 4 I/200 5 I/200 6 I/200 7
Quarterly data for the period from 1998 to 2007
Perce n ta ge cha nge t o th e previ ous ye ar, %
Figure 1. Real GDP growth rates in Georgia
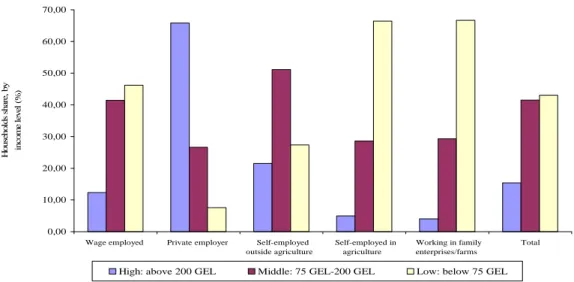
The local market conditions and institutions are characterized generally by fragmented labor and credit markets, while the number of poverty incidences is large in Georgia. In order to demonstrate the poverty situation of Georgia, households are grouped into three categories, based on the data extracted from the sample of 6754 respondents contained in the Georgian household surveys. These categories are: 1) the group of poor households with monthly incomes less than 75 GEL;6 2) the group of middle income households with incomes varying from 76 GEL and 200 GEL; and households, whose income exceeds 200 GEL, are assumed in this study as rich ones. According
6 This threshold is chosen because it corresponds to the minimum substance level (75 GEL) in Georgia (see SDSG: Statistical Yearbook of Georgia for 2006).
to the country-wide data, the share of households living below the poverty line is very large (about
43%) in total number of households. Rural areas have a higher poverty incidence (52%) than the
urban ones (35%). 0,00 10,00 20,00 30,00 40,00 50,00 60,00 70,00
Wage employed Private employer Self-employed outside agriculture Self-employed in agriculture Working in family enterprises/farms Total H ous ehol ds s h ar e, b y in co m e le v el (% )
High: above 200 GEL Middle: 75 GEL-200 GEL Low: below 75 GEL
Figure 2. The distribution of households by income level
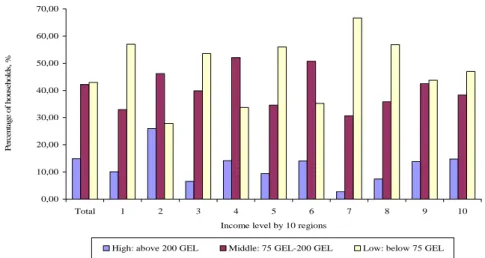
The poverty profile of household groups by major economic activities (Figure 2) is further analyzed in terms of a head count ratio calculated within each group. Self-employed and workers involved in family business enterprises and farms have the highest poverty incidence (about 70%), followed by wage employed. One has to remark that the share of self-employed workers is very large in the economy of Georgia, composing about 50% of economically active population. Private employers have the lowest poverty incidence of less than 10%. A comparison of regions in terms of individual household incomes reveals a large divergence in intra-regional poverty (Table 2 and Figure 3). According to Table 2, the median level of household incomes, for example, is lower than the mean of all regions. Moreover, both median and mean levels vary largely from one region to another, e.g. from 53 GEL and 74 GEL in Region 7 (Adjaria) to 132 GEL and 177 in Region 2 (Tbilisi), correspondingly. From the standard deviation values and the shapes of income distributions, one can observe that differences in terms of poverty gap are also very large.
Table 2. Distribution of labor incomes by regions
Reg. 1 Reg. 2 Reg.3 Reg.4 Reg. 5 Reg. 6 Reg. 7 Reg. 8 Reg. 9 Reg. 10
Maximum 1 054 2 000 500 950 767 3 000 600 1 000 850 667 Minimum 3 3 5 10 5 7 3 10 3 3 Mean 101 177 92 134 103 143 74 93 123 117 Median 68 132 70 109 70 100 53 70 87 80 Standard deviation 108 172 78 105 109 210 66 92 113 103
Source: the author’s calculations
0,00 10,00 20,00 30,00 40,00 50,00 60,00 70,00 Total 1 2 3 4 5 6 7 8 9 10 Income level by 10 regions
P er ce n ta ge of hou se h o ld s, %
High: above 200 GEL Middle: 75 GEL-200 GEL Low: below 75 GEL
Figure 3. Incomes across and within the regions
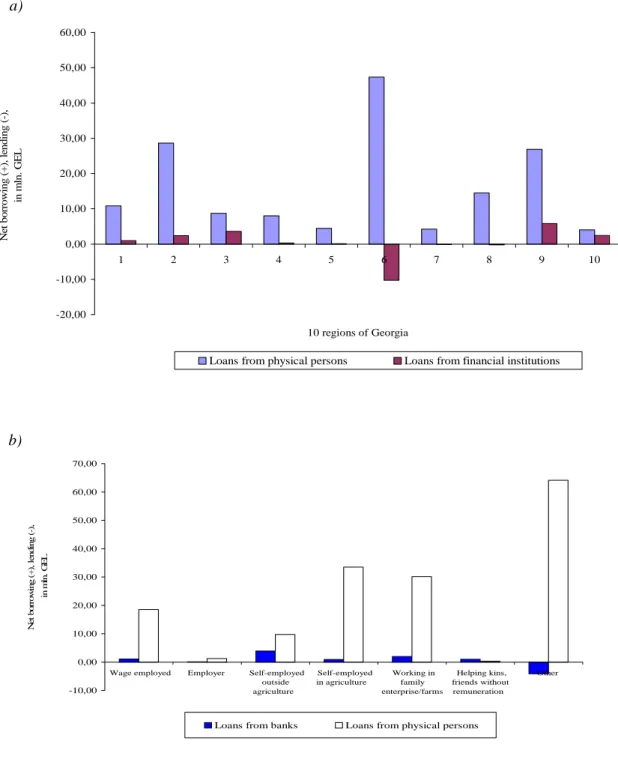
Due to a large number of poverty incidences as well as fragmented credit and labor markets, commercial banks are reluctant to extend loans to clients with low incomes whose land and assets are considered inadequate collateral. In addition, the capital markets, pension fund systems are underdeveloped, while the insurance market is very small (0.3% of GDP). As a result, the poor members of the society especially in distant regions have limited or no access to credit markets as well as employment opportunities. Consequently, households borrow funds more from physical persons (or other households), instead of financial institutions and banks (Figure 4). Moreover, one should remark that the size of the borrowed funds varies largely by regions, implying a very limited
or no access to these funds in some regions (e.g. Region 4, 5, 7 and 10). Presumably, access to credit and other assets in this country is determined mainly by informal networks and kinship.
a) -20,00 -10,00 0,00 10,00 20,00 30,00 40,00 50,00 60,00 1 2 3 4 5 6 7 8 9 10 10 regions of Georgia N et borrow ing (+ ), le nding (-), in m ln. G E L
Loans from physical persons Loans from financial institutions
b) -10,00 0,00 10,00 20,00 30,00 40,00 50,00 60,00 70,00
Wage employed Employer Self-employed outside agriculture Self-employed in agriculture Working in family enterprise/farms Helping kins, friends without remuneration Other N et bor ro w ing ( + ), l en d ing (-), in m ln . G E L
Loans from banks Loans from physical persons
Figure 4. The main sources of credit funds in Georgia by:
a) regions;
Taking into account some of the above-mentioned features of the Georgian household sector as well as the macroeconomic and institutional environment, the direct and indirect channels between remittance flows and households well-being are analyzed within the context of a modified CGE model. The model incorporates regional differences in terms of household factor endowment, consumption pattern and market access. The main questions of interest are whether and to what extent the poor households groups, which have different access to markets, can benefit from larger inward remittance flows and, thus, higher disposable incomes at the national levels. These questions are addressed by incorporating regional differences into the CGE model in terms of market access and transaction costs, apart from households’ factor endowments and consumption patterns have been reported so far elsewhere.
3. Methodology
Earlier studies focused on the poverty implication of various economic issues in developing countries used empirical methods, typically, econometric techniques and standard SAM based CGE models (e.g. Barham and Boucher 1998; Carrington, Detragiache and Vishwanath 1996; Docquier and Rapoport 2003; Holden, Taylor and Hampton 1998; Milanovic 1987). From methodological point of view, most studies dealing with the poverty issues tend to favor the second approach since it allows capturing a general equilibrium effect. In particular, Holden, Taylor and Hampton (1998) stress that when households are highly diversified within a country, remittances increase the differentiation of households further and facilitate market based exchange among them. Subsequently, the general equilibrium effect of remittances is strong because of high transaction costs among highly diversified households, which necessitates using the CGE framework. The former approach is criticized on a ground that it lacks a clear theoretical foundation and adequate data required at a highly disaggregated level (see e.g. Azis 2002).
Three generations of CGE models have been widely used so far for analyzing the various aspects of poverty issues. The first and second generation models, for example, incorporate the distributional questions of trade and tax policies. They do not treat, however, poverty issues explicitly, while the third generation models incorporate interdependence among labor markets in the rural and urban sectors and, thus, allow assessing the poverty impact more explicitly (Khan 2007). Therefore, the third approach, i.e. the SAM based general equilibrium approach that incorporates detailed interactions within and between household groups as well as differences in access to markets is recognized to be an adequate tool for analyzing the phenomenon more realistically.
Important factors determining the pattern and magnitude of the poverty effect caused by remittance flows are the nature of local markets and conditions, affecting the market access of various household types (Adhikari 1992). The models enabling to account detailed interactions between household types are very often referred to as village economy SAM based CGE models in the literature (e.g. Taniguchi 2003). The main drawback of these models, however, lies in necessity to use highly disaggregated data (at the level of a single village) which are usually unavailable. For these reasons, only a limited number of studies have managed so far to incorporate such a detailed dataset within the CGE framework, as demonstrated e.g. in Adelman, Taylor and Vogel (1988) who analyzed the impact of remittances on the rural household sector in the Mexican economy. Due to difficulties associated with disaggregating SAM, in this respect, most studies focused on regional models (e.g. Khan 2007), integrating fully and partially regionalized SAMs into the CGE framework.
Recent studies carried out in the framework of regionalized CGE models found that the magnitude and nature of the impact caused by remittance flows on poverty, income distribution and economic development depends on different factors. The latter include the size of remittance
inflows, the type of out-migration, and the distribution of factor endowment within countries (Quibria 1997). Furthermore, emigration and remittance flows to a country do not affect all residents symmetrically. For example, it is found that in the urban areas remittances contribute to the increase of household incomes and consumption smoothing (Kannan and Hari 2002), saving and asset accumulation (Hadi 1999), and access to health services (Yang 2003). In rural areas, the impact can be two-fold depending on whether and how households are involved into the internal and international remittance processes. Xiaoping, Heerink, Holden and Futian (2005) suggest that if rural households receive remittance incomes directly from their migrant family members, then they substantially decrease their farm activities in favor of market related ones (e.g. hiring labor, production and lending). This eventually changes the resource allocation and aggregate welfare, improving markets. Under market imperfections, however, the impact of remittance inflows on the local market conditions as well as farm activities can be negligible or even negative. This is because the overall incentives of farms to land conservation activities decrease substantially. Therefore, since land conservation activities are labor intensive and farm family members leave for market activities, labor in farms is not easily substitutable by hired labor (Thapa 2003).
The above-mentioned studies suggest that the diversity of household groups in terms of location and access to various markets and resource opportunities needs to be taken into careful consideration when analyzing the poverty implication of remittances. Differences in terms of transaction costs and market margins between different locations usually take into account such diversity among households.
Given market imperfections, informal sector, and limited statistical coverage in data on Georgia, this study attempts to analyze the macroeconomic implication of remittance flows, in terms of poverty reduction, through direct and indirect causal channels. The main questions of interest are whether and to what extent remittance flows contribute to the production and consumption pattern of
the poor. Two aspects of poverty reduction are emphasized in this study: (1) the impact of remittances on the aggregated and sectoral economic growth; and (2) the impact of remittances on the poor households, their production and consumption patterns across regions. Particular attention is paid to regional differences in terms of market access and transaction costs, apart from households’ factor endowments and consumption patterns reported elsewhere.
3. The SAM based CGEM with regional differences: data calibration and simulation results
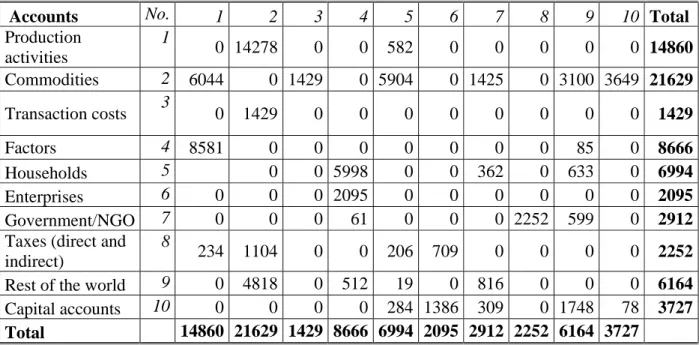
Generally, the SAM maps production and distribution at the aggregate level and summarizes succinctly the interdependence between productive activities, factor prices, household income distribution, balance of payments, capital accounts, etc. Given the technical conditions of production, the value added is distributed to the factors of production, then accrued by these factors it further flows to households along with the ownership structure of assets and wages. The SAM represents the matrix of equal rows (receipts) and columns (expenditures), as of accounting constraint. The Georgian aggregated SAM (Table 3), which is based on the standard approach of
International Food Policy Research Institute (IFPRI),7 constructed on the economy-wide data. It
represents 13 production activities from 18 sectors reported in the original input-output tables. The domestic production generates 12 commodities. The production of agricultural commodities is separated between large and small agricultural enterprises. Transaction costs among institutions, including households, enterprises and government originate in domestic sales, exports and imports activities. Production factors, which are capital, labor and self-employment, are decomposed between agriculture and other production units. Labor is split to high-, medium- and low-skill components using the sub-classification of employed by major work positions.
Table 3. National SAM (the aggregated version) for Georgia, 2004
Accounts No. 1 2 3 4 5 6 7 8 9 10 Total
Production activities 1 0 14278 0 0 582 0 0 0 0 0 14860 Commodities 2 6044 0 1429 0 5904 0 1425 0 3100 3649 21629 Transaction costs 3 0 1429 0 0 0 0 0 0 0 0 1429 Factors 4 8581 0 0 0 0 0 0 0 85 0 8666 Households 5 0 0 5998 0 0 362 0 633 0 6994 Enterprises 6 0 0 0 2095 0 0 0 0 0 0 2095 Government/NGO 7 0 0 0 61 0 0 0 2252 599 0 2912
Taxes (direct and indirect)
8
234 1104 0 0 206 709 0 0 0 0 2252
Rest of the world 9 0 4818 0 512 19 0 816 0 0 0 6164
Capital accounts 10 0 0 0 0 284 1386 309 0 1748 78 3727
Total 14860 21629 1429 8666 6994 2095 2912 2252 6164 3727
Source: The input-output tables (SDSG)
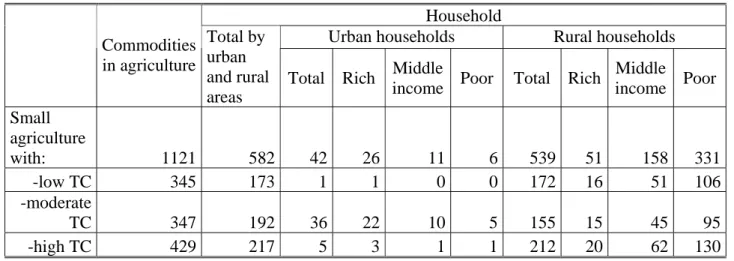
The original SAM has been modified in this study by disaggregating the small agricultural enterprises into three groups of regions in order to enable the regional dimension of the market access and transaction costs. A basic intuition behind this is that farmers located in the remote or mountainous areas of the country face higher transportation and marketing margins than other regions. In this respect, three types of household farms, which have the highest poverty incidence, are distinguished in the model. These are the household farms located geographically in regions with high- medium- and low-transaction costs. The grouping of regions is based on the topographical features of the country’s territory. In particular, regions located at the mountainous parts are considered to have high-transaction costs, while regions with small cities and arable land incur medium-transaction costs. The capital city with its surroundings is assumed to be in a low-transaction cost area. The regional disaggregation of small agricultural enterprises into three groups by transaction costs and household groups in SAM is presented in (Table 4). Clearly, urban households face lower transaction costs with about 88% of their production activities concentrated in
the regions with low and medium transaction costs, while about 40% of production activities, into which rural households are involved, take place in the regions with high transactions costs.
Table 4. The distribution of small farmers by transaction costs and household groups
Household
Urban households Rural households
Commodities in agriculture Total by urban and rural areas
Total Rich Middle
income Poor Total Rich
Middle income Poor Small agriculture with: 1121 582 42 26 11 6 539 51 158 331 -low TC 345 173 1 1 0 0 172 16 51 106 -moderate TC 347 192 36 22 10 5 155 15 45 95 -high TC 429 217 5 3 1 1 212 20 62 130
Source: Input-output tables and household surveys (SDSG)
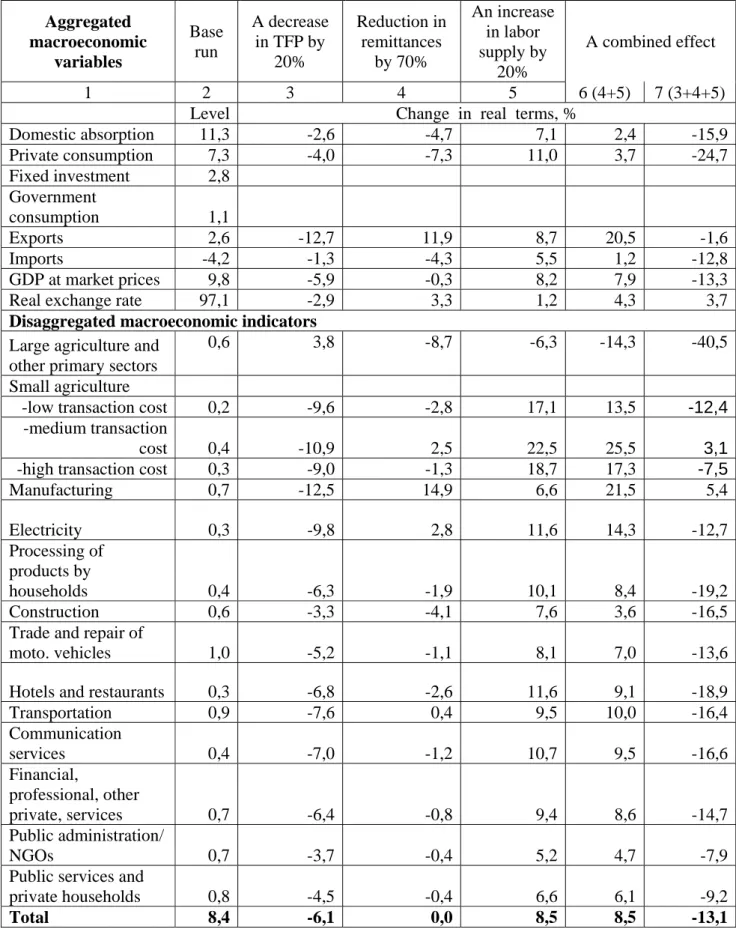
In examining the poverty profiles, the household accounts are of particular importance because the flows of income and expenditures need to be adequately reflected in the SAM. Therefore, taking into account income levels, the households of Georgia are classified into six groups: rich, rural-middle income, rural-poor, urban-rich, urban-rural-middle income, and urban-poor. Five illustrative scenarios are set out in Table 5 for Georgia. The macroeconomic impact of remittance inflows applied homogeneously across all sectors is strongest on the private household consumption and negligible on the GDP growth rate. Remittances lead to higher domestic absorption, larger imports and lower exports. The combined effect of remittance inflows and emigration is negative with respect to all variables considered, with the strongest impact on the private consumption, domestic absorption and GDP growth rates. The growth rates of these variables in a hypothetical economy in the absence of migration and remittances in 2004 would be lower by 24.7%, 13.6% and 13.3%, correspondingly.
Table 5. The results of SAM based CGEM simulations Aggregated macroeconomic variables Base run A decrease in TFP by 20% Reduction in remittances by 70% An increase in labor supply by 20% A combined effect 1 2 3 4 5 6 (4+5) 7 (3+4+5)
Level Change in real terms, %
Domestic absorption 11,3 -2,6 -4,7 7,1 2,4 -15,9 Private consumption 7,3 -4,0 -7,3 11,0 3,7 -24,7 Fixed investment 2,8 Government consumption 1,1 Exports 2,6 -12,7 11,9 8,7 20,5 -1,6 Imports -4,2 -1,3 -4,3 5,5 1,2 -12,8 GDP at market prices 9,8 -5,9 -0,3 8,2 7,9 -13,3
Real exchange rate 97,1 -2,9 3,3 1,2 4,3 3,7
Disaggregated macroeconomic indicators
Large agriculture and other primary sectors
0,6 3,8 -8,7 -6,3 -14,3 -40,5
Small agriculture
-low transaction cost 0,2 -9,6 -2,8 17,1 13,5 -12,4
-medium transaction
cost 0,4 -10,9 2,5 22,5 25,5 3,1
-high transaction cost 0,3 -9,0 -1,3 18,7 17,3 -7,5
Manufacturing 0,7 -12,5 14,9 6,6 21,5 5,4 Electricity 0,3 -9,8 2,8 11,6 14,3 -12,7 Processing of products by households 0,4 -6,3 -1,9 10,1 8,4 -19,2 Construction 0,6 -3,3 -4,1 7,6 3,6 -16,5
Trade and repair of
moto. vehicles 1,0 -5,2 -1,1 8,1 7,0 -13,6
Hotels and restaurants 0,3 -6,8 -2,6 11,6 9,1 -18,9
Transportation 0,9 -7,6 0,4 9,5 10,0 -16,4 Communication services 0,4 -7,0 -1,2 10,7 9,5 -16,6 Financial, professional, other private, services 0,7 -6,4 -0,8 9,4 8,6 -14,7 Public administration/ NGOs 0,7 -3,7 -0,4 5,2 4,7 -7,9
Public services and
private households 0,8 -4,5 -0,4 6,6 6,1 -9,2
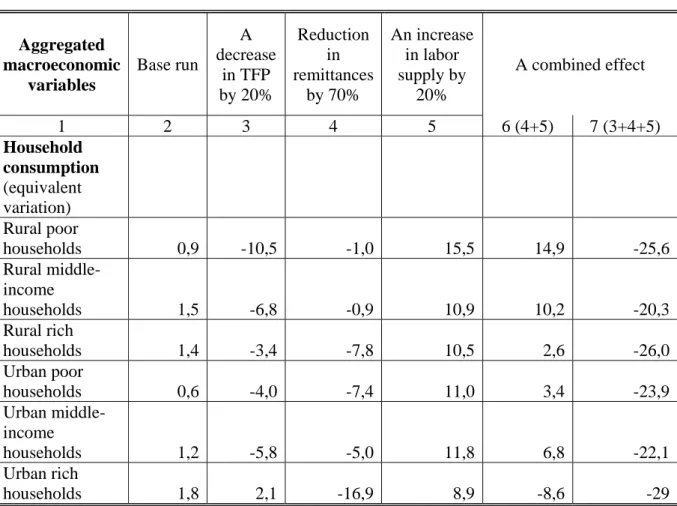
Table 5. The results of SAM based CGEM simulations (continuation) Aggregated macroeconomic variables Base run A decrease in TFP by 20% Reduction in remittances by 70% An increase in labor supply by 20% A combined effect 1 2 3 4 5 6 (4+5) 7 (3+4+5) Household consumption (equivalent variation) Rural poor households 0,9 -10,5 -1,0 15,5 14,9 -25,6 Rural middle-income households 1,5 -6,8 -0,9 10,9 10,2 -20,3 Rural rich households 1,4 -3,4 -7,8 10,5 2,6 -26,0 Urban poor households 0,6 -4,0 -7,4 11,0 3,4 -23,9 Urban middle-income households 1,2 -5,8 -5,0 11,8 6,8 -22,1 Urban rich households 1,8 2,1 -16,9 8,9 -8,6 -29
Source: the author’s estimations
At the level of individual sectors, a simulated increase in remittance inflows has a strongest influence on the manufacturing output, which decreases by 14.9% and large-scale agricultural production by about 8.7%. The impact of remittances on the production of household farmers (or small agriculture) is two-fold. In regions with low and high transaction costs, the production increases by 2.8% and 1.3%, correspondingly, while in the medium transaction cost regions it falls by 2.5%. Presumably, moderate transaction costs allow these farmers to decrease substantially their farm activities and get involved into other kind of market related activities, once they receive remittances. The positive effect of remittances is pronounced in the construction (4.1%) and service (e.g. hotel and restaurants) sectors (2.6%) and negative impact on the electricity sector (-0.8%). The
impact on the remaining sectors is negligible. The combined effect of remittance inflows and emigration is strongest in the small agriculture. Namely, the production of farms in regions with low, moderate and high transaction costs falls by 13%, 26% and 17%, correspondingly. Only the large agricultural sectors gain in output by about 14.3%.
In terms of households groups included in the model, the results reveal that emigration and remittance flows do not affect all residents symmetrically, but depend on the identity of households. In urban areas, remittances contribute to the increase of household incomes and consumption smoothing, while in rural areas the effect is positive, but rather week. For example, the groups of rural poor and middle-income households can benefit of somewhat 1% in their private consumption each, while in urban areas these groups gain 7.4% and 5.0%, correspondingly. One can observe also that the magnitude of this impact is smaller compared to that of rich households with the pure effect of remittances equivalent to 16.9% and 7.8% of private consumption, respectively, in urban and in rural areas. Consequently, remittances are beneficial to the wealthier members of this society (i.e. rich households) in both urban and rural areas. An increase in the supply of labor by 20%, on the contrary, would improve the welfare state of households in all groups, especially, of the rural poor at the outset. These households would benefit a 16% increase in private consumption under better access to labor markets. The smallest effect of labor supply is on rich urban households (about 9% of private consumption).
5. Conclusion
The conclusion to be drawn from this exercise is that, while having a strong macroeconomic growth effect at the aggregated level, emigration and inward remittance flows do not affect all sectors and residents symmetrically. Moreover, they have a rather limited impact in terms of poverty and income inequality. In urban areas, for example, remittances contribute to the increase of
household incomes and consumption smoothing, while in rural areas the effect is two-fold. Namely, in regions with low and high transaction costs, remittances are beneficial to small farmers, while in the medium transaction cost regions the effect is opposite. Presumably, the moderate level of transaction costs allow these farmers to shift from the farm related activities to market ones, once have access to remittances. The magnitude of the impact caused by remittances on the consumption pattern is smallest for the group of poor and middle-income rural households (1.6% and 1.0%, respectively) and largest for rich urban households. Under the absence of remittances, rich households would incur a loss of about 16.9% in their private consumption. Consequently, the wealthier members of the society gain more from remittances than poorer household categories. Better access to labor markets, on the contrary, would improve the welfare states of many, especially, of the rural poor at the outset.
Policy priorities, in these circumstances, should be given to a pro-poor approach, especially, in improving institutional mechanisms through which the poor members of the society can have access to labor and credit markets within the country. With the focus on the inclusion of low-income and rural households in the financial sector, for example, the policies could be designed for meeting the needs of household farmers in distant regions. This would include also enabling various possibilities for linking remittance flows with the microfinance based mechanisms focused on promoting saving, insurance and investment within regions, as well as decreasing transaction costs across the regions.
References
Adelman, I., Taylor, E. and Vogel S. (1988) Life in a Mexican Village: A SAM Perspective, Journal
of Development Studies,1
Adhikari, J. (1992) Ethnicity, Off-Farm Income and Resource Use in the Semi-subsistence Farming System of Kaski District, Nepal. A thesis submitted for the degree of Doctor of Philosophy of the Australian National University
Azis, I. J. (2002) A New Approach to Modeling the Impacts of Financial Crises on Income Distribution and Poverty, Tokyo: ADBI Research Paper, 35
Barham, B. and Boucher, S. (1998) Migration, Remittances and Inequality: Estimating the Net Effect of Migration on Income Distribution, Journal of Development Economics, 55
Carrington, W.J., Detragiache, E. and Vishwanath, T. (1996) Migration with Endogenous Moving Costs. American Economic Review, 86 (4)
Docquier, F. and Rapoport, H. (2003) Remittances and Inequality: a Dynamic Migration Model, CREDPR Working paper, Stanford University
Georgian-European Policy and Legal Advice Centre (2008): Georgian Economic Trends, Quarterly Economic Trends, February
Georgian-European Policy and Legal Advice Centre (2007): Georgian Economic Trends, Quarterly Economic Trends, October
Hadi, A. (1999) Overseas Migration and the Well-being of Those Left Behind in Rural Communities of Bangaladesh. Asia-Pacific Population Journal, 14(1)
Holden, T., Taylor, J. and Hampton, S. (1998) Structural Adjustment and Market Imperfections: a Stylized Village Economy-wide Model with Non-separable Farm Households. Environment
Holden, S. T., Shiferaw, B. and Pender, J. (2001) Market Imperfections and Land Productivity in Ethiopian Highlands, Journal of Agricultural Economics, 52(3)
Kannan, P. and Hari, S. (2002) Kerala’s Gulf Connection: Emigration, Remittances and their Macroeconomic Impact, 1972 - 2000. Centre for Development Studies Working Paper, 328 (http://cds.edu/download_files/328.pdf)
Khan, H.A. (2007) Social Accounting Matrices (SAMs) and CGE Modeling: Using Macroeconomic Computable General Equilibrium Models for Assessing Poverty Impact of Structural Adjustment Policies. CIRJE Discussion Papers Series, 463, Center of International Research and the Japanese Economy
Milanovic, B. (1987) Remittances and Income Distribution. Journal of Economic Studies, 14(5) Quibria, M.G. (1997) International Migration, Remittances, and Income Distribution in the Source
Country: a Synthesis. Bulletin of Economic Research, 49(1)
Quillin, B., Segni, C., Sirtaine, S., and Skamnelos (2007) Remittances in CIS countries: A Study of Selected Corridors. Chief Economist’s Regional Working paper, 2
Simai, M. (2006) Poverty in Inequality in Eastern Europe and the CIS Transition Economies. DESA Working Paper, 17
Statistical Yearbook of Georgia (2007) Web site: www.statistics.ge
State Department for Statistics of Georgia (2005) “Households of Georgia”, 2003-2004 Stiglitz, J. (1994) Whither Socialism? Cambridge, Ma.: The MIT Press
Taniguchi, K. (2003) Village Level Social Accounting Matrices: Data Requirements. In: Approaches to Assessing the Impact of Globalization on African Smallholders: Household and Village Economy Modeling, Proceedings of Working Session, Globalization and the African Small Holder Study, edited by J. Dixon, K. Taniguchi, and H. Wattenbach.
Thapa, G.B. and Weber, K.E. (1995) Status and Management of Watershed in the Upper Pokhara Valley, Nepal. Environmental Management, 19 (4)
Xiaoping S., Heerink, N., Holden, S. and Futian, Q. (2005) Off-farm Employment, Factor Market Development and Input Use in Farm Production - A Case Study of a Remote Village in Jiangxi, Province, China. Discussion Paper, Norwegian University of Life Sciences
Yang, D. (2003) Remittances and Human Capital Development: Child Schooling and Child Labor in the Origin Households of Overseas Filipino Workers. Harvard University, Department of Economics Literature Center Working Paper (www.people.fas.havard.edu/-dyang/papers/yang_remittances.pdf)