Comparison of embodied energy and carbon dioxide emissions of brick and
concrete based on functional units
Soheyl Sazedj
University of Évora, Department of Rural Engineering, Évora, Portugal
António J. Morais
Architecture Faculty – Technical University of Lisbon, Department of Technology, Lisbon, Portugal
Said Jalali
University of Minho, School of Engineering, Guimarães, Portugal
Abstract
Building materials have different consumption patterns of energy and emissions of carbon dioxide during their production. These differences result from the treatment of the raw materials and the techniques applied to production. Subsequently on an environmental classification one wonders what kind of constructive solution becomes more benevolent to the environment.
Masonry building technique has made a comeback as an alternative to conventional reinforced concrete structures with ceramic blocks for closing the spans. The present study refers to the environmental comparison of these two systems. As the definition of functional unit has been introduced to facilitate the comparison of different existing alternatives, the walls are chosen as the functional units, for different building plans and conditions. The comparison considers the most important environmental parameters, i.e. the embodied energy and the carbon footprint.
Results obtained indicate that masonry-building walls have a lower embodied energy and carbon footprint compared to those of conventional building. The differences vary with the length of the walls, but are over 22% and reach some 55%. It is hoped that the different wall types considered will enable the comparison of the two options for real application.
1. Introduction
In order to enable a decision on a structural solution to find the more environmental friendly structure, specific information is needed. A tool recommended by ISO 14040, which regulates international environmental assessment and life cycle of products, is the comparison of functional units. Applying it to construction and having in mind the comparison of structural solutions it seems most likely that the consideration of walls as functional units are more suitable, as the architectural form remains untouched or is not predefined. In this case the units must have the same function in stability, thermal and acoustic insulation. Hence, structural walls, exterior and interior, with spans of 4, 6 and 7 and height of 2.7 meters are regarded as functional units for the comparison of the materials already mentioned.
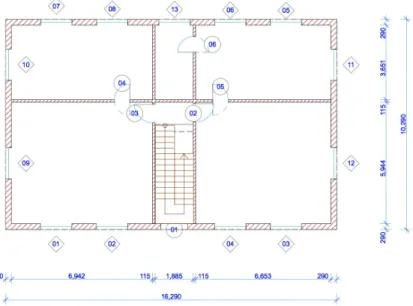
The model shown in Figure 1 with a building area of 167.6 m2 is structurally designedi for both constructive solutions.
Figure 1, Plant of the ground floor
The comparison is meant between the functional units of the same span, one as reticulated structure with reinforced concrete columns and ceramic blocks for closing the spans and the other totally in masonry of ceramic blocks. The rendering and slabs are not considered in the functional units, as they are the same for the two constructive solutions. So, the assessment will highlight the differences in the two constructive options and compares the structural core construction materials.
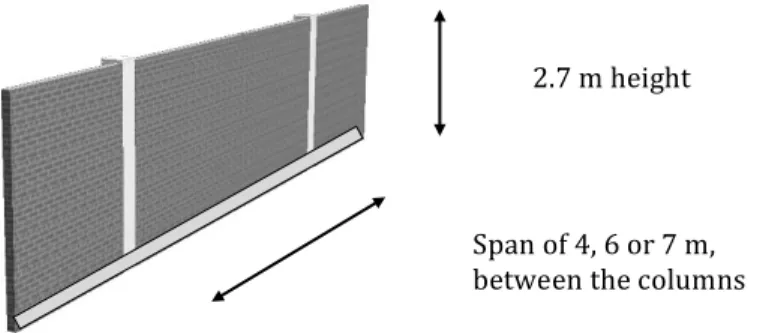
The Figures 2 and 3 show the functional units which can be used in any adequate architectural design. Figure 2. Brick wall as functional unity
In case of the masonry the unit consists of the height of 2,7 m and the span of the stiffness walls considering the axis of the walls. The other case has the same height multiplied by the span between the pillars, also considering the axis of the pillars, and additionally the concrete beam at the floor level.
2.7 m height
Span of 4, 6 or 7 m, between the interior walls
Figure 3. Wall of conventional reticulated reinforced concrete building filled with ceramic blocks as functional unit
2. The Benchmarks
The data used for the ceramic blocks are supplied by the factory, Preceramii, a large-scale producer of ceramic blocks, who applies advanced technology in the production, and more two documents, "INVENTORY OF CARBON AND ENERGY" (ICE)iii, (UB), 2011 with data from UK, the publication "DADOS DE REFERÊNCIA PARA BENCHMARKING"iv (CTCV) from 2004 with data from Portugal. The last document confirms the data obtained from the manufacturer in Portugal.
Besides these current data the following sources have been also considered. A survey of data in Spain, "GUIDE DE L'EDIFICACIÓN SOSTENIBLE"v (IC) and “Ecologia dos Materiais de Construção’’vi (UM) with ecological data on building materials, collected at the
European level.
The Institutions and authors referred above present the data according to the type of energy used for the production, electric and thermal energy, and depending on the size of the factory, small, medium and large. Generally the statistics and the results are based more on the use of thermal energy, electricity has only a contribution of 20%. The values used here are average values to increase the likelihood of a fair comparison of the data.
Table 1, Comparison of embodied energy and carbon emission in the production of ceramic block
UB CTCV PRECERAM IC UM
EMBODIED ENERGY (MJ/kg) 3,0 1,37 1,02 4,5 2,99
CARBON DIOXIDE EMISSION (kgCO22/kg)
0,22 0,112 0,100 - 0,19
Table 1 shows that the data of CTCV are significantly lower. The reason lies in the statistical analysis of the period. The other institutions analyzed data from the plants over a period of several years beginning in 1995 with some accuracy. However, these data, which are averages, reflect also the years where the industry had not yet taken steps to reduce energy and pollution in production. Unlike the survey, CTCV refers only to the year 2004 with the latest industry data already applying the new manufacturing technologies with new measures to reduce energy and pollution. The values of Portuguese plants already incorporate technological advances. In the Kyoto Protocol industrialized countries agreed to a reduction
2.7 m height
Span of 4, 6 or 7 m, between the columns
of 25 to 40% of emissions by 2020. Considering the plausibility of future developments in most ceramic plants, this research, adopts the data of the Portuguese manufacturer indicating the lowest embodied energy and carbon dioxide emission.
Regarding the data for cement, the same sources and data from a Portuguese cement factory are presented in Table 2. Data for CIMPOR Company, the largest cement producer in Portugal, is from the latest annual report "Sustainability Report '08"vii values related to the production of cement in 2008.
Table 2, Comparison of embodied energy and carbon emission in the production of cement
UB CIMPOR IC UM
EMBODIED ENERGY (MJ/kg) 4,6 3,591 7,02 4,00
CARBON EMISSION (kgCO22/kg) 0,83 0,676 - -
In Table 2 the data of CIMPOR are more relevant for Portugal, as they represent the real energy consumption and pollution from year 2008 and do not represent other sources such as average values of several years and of other countries.
It is considered that the cement constitutes about 14% of concrete, water (with water / cement ratio = 0.5) between 6 and 7% and the rest are almost 80% of aggregates, one can conclude that proportionally the carbon emission in the manufacturing of concrete is 0,10 kgCO2/kg with 0.095 for cement (14%) and 0,005 (80%) for aggregates, whereas the
contribution of water is negligible. The carbon emission in the production of aggregates is composed of grinding of aggregates using thermal energy and mixing them using electricity when manufacturing concrete. The ICE document supplies the value of carbon emission in the production of aggregates. Since the process is the same in Portugal or UK and there is no technological development in this process and furthermore as the principal pollution is dust, it is confirmed that the data of the United Kingdom should be equal for Portugal. Likewise the values for the energy consumption in production of concrete can be determined. The assigned value for concrete is 0.81 MJ/kg, with 0.504 for the cement and 0.307 for the aggregates and water. These values appear according to author’s own survey (S) in the following table.
Table 3, Comparison of embodied energy and carbon emission in the production of concrete
UB S IC UM
EMBODIED ENERGY (MJ/kg) 0,95 0,81 1,008 1,00
CARBON EMISSION (kgCO22/kg) 0,13 0,10 - 0,065
The collection of data on steel production, particularly the rebar used in concrete, and the analysis and justification of data on the embodied energy and carbon emission is a difficult and complex task. The steel industry is the largest producer of carbon among the industries in general, in the world. The steel industry is conscious of this fact. In Europe several projects are running to develop technologies for the reduction of carbon emission and also for the storage of CO2 and its use for electricity production. The best-known project is
ULCOS (Ultra Light Steel manufacturing CO2). ULCOS is a consortium of industry
(ULCOS II) with the aim of reducing CO2 emissions by half. There was also a significant
development in reducing pollution over the last 15 years by using electric oven. However, the industry is still far from the goal.
Moreover, the issue is the complexity of the manufacture of steel and the different methods of production. In addition to this fact some data refer to the raw steel and others to treated steel, ready for use in construction. Furthermore attention should be paid if the data refers to virgin or recycled steel.
As it is almost impossible to have the actual data, it has been decided to establish average values, because every order of rebar can be treated differently by the industry and it is almost impossible to define the embodied energy and the carbon emissions of steel shipped accurately.
The data provided by the ICE document seems to be more accurate. The documents "Energy Management"viii (SI), and "Insights from Steel - Benchmarks and Environment"ix (TK), although not complete, confirm the mentioned data.
Table 4, Comparison of embodied energy and carbon emission in the production of steel
UB (ICE) SI TK UM
virgin recycled average raw virgin virgin
EMBODIED ENERGY (MJ/kg) 36,40 8,8 24,6 18,4 - 10
CARBON EMISSION (kgCO22/kg) 2,68 0,42 1,71 1,361 2,0 0,557
Considering the data of Table 4 and the facts mentioned above, the average values for the rebar in the ICE document reflect better the reality and are more suitable for this analysis. Thus the average value for energy consumption is considered 24.60 MJ/kg and 1.71 kgCO2/kg carbon pollution.
According to tables 1 - 4 the following quantifications of embodied energy and carbon dioxide emission are chosen for the two construction solutions studied.
Carbon Emission
Ceramic block 0,100 kg CO2/ kg
Concrete 0,100 kg CO2/ kg
Steel 1,710 kg CO2 / kg
Mortar (5 to 10 MPa strength) 0,213 kg CO2 / kg
Embodied Energy
Ceramic block 1,02 MJ/ kg
Concrete 0,81 MJ/ kg
Steel 24,60 MJ / kg
Mortar (5 to 10 MPa strength) 1,40 MJ / kg
These figures relate to the manufacture of materials up to the preparation for transport at the factory gate. Emissions and embodied energy for the transport of materials for the functional units have not been considered.
3. Comparison of the Results
The functional units in masonry are considered for spans of 4, 6 or 7 m of two types, an exterior wall with ceramic blocks of 290 mm thick, so called thermal blocks with the minimum necessary resistance of 10 MPa, and interior wall using ceramic blocks of 110 mm, with high density and resistance of 45 MPa. The higher resistance design of structural interior walls sustains the stability of masonryx, on the other hand the higher density of the block is environmentally not in favor of masonry.
In the case of conventional construction the same spans are considered, but the exterior or interior units have side columns of 30x30 cm cross section. The width of 30 cm is a common dimension, which can be found in most of the small 4 or 5 story buildings and is structurally appropriate especially in earthquake zones. So the exterior walls will use the same thermal block to guarantee similar thermal insulation quality and the spans of the inner walls are filled with inferior quality of light ceramic blocks. This is in favor for the conventional construction, but as structural inner walls are considered, their width may annul the benefit.
Concerning the comparison with masonry, it must be considered that masonry buildings, as advised by the Eurocode 8, standard for seismic design, may not surpass 4 stores. Therefore the chosen width for the columns in conventional construction is an average figure that serves for this study, equal for interior as exterior walls, as generally it is used for the ground floor. All functional units have a height of 2,70 m. It has to be considered that on upper floors the width or at least the reinforcement steel in columns can be reduced. Therefore, the following results must be different for upper floors. It will be a matter of another quantification to verify the data for each floor.
Regarding the equal thermal and acoustical insulation quality for the functional units, especially for the exterior walls, which are of concern, as the thermal block is beneficial for both solutions the fact remains that in case of the conventional construction the concrete pillars are thermal bridges. This problem is be solved by considering an external 30 mm thermal insulation for both cases. The thermal transmittance for the conventional solution is 0,456 and for masonry 0,422 W/m2K, which is a rather very small difference. Therefore, for
both solutions can be concluded that the functional units, hereby, fulfill similar thermal, acoustical and structural criteria for the process of comparison.
3.1 Functional Unit: Exterior Wall
Data for exterior walls are estimated based on the sources indicated before and presented in Table 5. For the exterior walls Table 5 clearly shows that in the case of structural masonry increasing emissions are directly proportional to the increase of the span. Given the values for the span of 4 m as the base value, the Factor shows the proportion of increase according to the length of the wall. The increase is 50% when the length of the wall increases from 4 m to 6 m and 75% from 4 m to 7 m. It is noticed that the same proportions exist for the carbon dioxide emissions. Unlike the conventional construction an increase of 50% in length shows an increase of 36% of the emission. An increase of 75% in the length shows an increase of 55% of the emission. In conventional construction the larger spans are more environmental friendly compared to smaller spans for the same construction. Comparing the two construction techniques it is noticed that the masonry building has a lower CO2 emissions
than the conventional construction. The difference decreases from 27% to 18% when the length of the wall increases from 4 to 7 m.
Table 5, Carbon Emission (kg CO22 / Functional Unity)
Functional Unity Conventional Construction Carbon Factor Carbon Masonry Factor Difference
4 m 748,34 1,00 545,18 1,00 27,15%
6 m 1020,93 1,36 817,78 1,50 19,90%
7 m 1157,23 1,55 954,07 1,75 17,56%
The embodied energy values change in a similar way to the carbon emission. The embodied energy increases proportionally to the increasing span. In conventional construction embodied energy increases 33% when the span increases from 4m to 6m and 49% when increases from 4 m to 7 m. This behavior is similar to the changes in CO2 emission indicated
in Table 5.
Table 6, Embodied Energy (MJ) in Functional Unities
Functional Unity Conventional Construction Masonry Difference
Energy Factor Energy Factor
4 m 7675 1,00 5060 1,00 34,07%
6 m 10206 1,33 7591 1,50 25,62%
7 m 11471 1,49 8856 1,75 22,80%
The variation of embodied energy between the two constructive solutions is also similar to variation observed for the carbon emission, albeit the values are larger for embodied energy.
3.2. Functional Unit: Interior Wall
Values of carbon emission estimated for interior walls with 4m, 6m and 7m lengths are presented in Table 7. The trend of the values for the interior walls is similar to those shown for exterior walls. However, it has to be considered that while the volume of masonry material is less, 110 mm thick, the concrete columns, 30x30 cm, have the same size as the exterior. This explains the higher values of the differences observed between the two types of construction technique for interior walls and exterior walls.
Table 7, Carbon Emission (kg CO2 / Functional Unity)
Functional Unity Conventional Construction Carbon Factor Carbon Masonry Factor Difference
4 m 381,89 1,00 195,97 1,00 48,68%
6 m 438,92 1,15 293,95 1,50 33,03%
In conventional construction the change of 50% in the length increases only 12% in CO2 emission and a 75% increase in length results in an increase of 18% in CO2 emission.
Table 8, Embodied Energy (MJ) in Functional Unity
Functional Unity Conventional Construction Energy Factor Energy Masonry Factor Difference
4 m 4257 1,00 1874 1,00 55,98%
6 m 4776 1,12 2810 1,50 41,16%
7 m 5035 1,18 3279 1,75 34,88%
Table 8 presents data obtained for embodied energy for the two types of construction technique and three spans considered. Comparing the embodied energy of the two constructive solutions the trend is the same as the CO2 emissions. In conventional
construction the difference between the spans for embodied energy are 12% to 18%, but as already noted, between the two solutions the differences are higher, varying from 35% to 56% (Table 8) compared to 27% to 49% (Table 7).
4. Conclusion
The present study compares the CO2 emission and embodied energy for interior and
exterior walls of conventional construction with reinforced concrete columns and ceramic bricks and the masonry building (using only ceramic bricks). The functional units considered have the same structural and physical properties. The comparison shows that under the same conditions the carbon dioxide emission of an exterior masonry wall is 27% to 17% less than that of the conventional construction depending on the wall span. The smaller the span the higher the differences obtained. In the case of interior walls the carbon dioxide emission is 49% to 27% less for the masonry building when compared to conventional building technique. The embodied energy, for the exterior masonry walls are 34% to 23% less than conventional building technique, while for interior walls they are 56% to 45% lower.
It is relevant to note that these differences are mainly due to the absence of reinforced concrete columns in the masonry walls. Buildings in seismic areas can be built with ceramic blocks up to 2 or 4 stories, depending on the seismic classification of the area. In non-seismic areas this contribution can be multiplied as the boundaries only depend on the dimension of the structure. Moreover, this study shows planers how to conduct a more environmental friendly design and construction.
References
i Sazedj, Soheyl, Análise de Sustentabilidade de Alvenaria Estrutural, PhD theses, Faculty
of Architecture, University of Lisbon, (2012)
ii Grupo Preceram, Travasso, 3101-901, Pombal, Portugal, 2010
iii Hammond, Geoff; Jones, Craig, Sustainable Energy Research Team, Department of
Mechanical Engineering, University of Bath (UB), United Kongdom, INVENTORY OF CARBON AND ENERGY (ICE), 2008
iv Centro Tecnológico da Cerâmica e do Vidro (CTCV), , Portugal, "REFERENCE DATA
FOR BENCHMARKING", 2004
v Rovira Fontanals, Josep Lluis, Casado Martinez, de Institut Cerdá (IC), GUÍA DE
L’EDIFICACIÓN SOSTENIBLE, Spain, 1999
vi Said Jalali, F. da Eira Marcelo e J.A Nelson, ECOLOGIA DOS MATERIAIS DE
CONSTRUÇÃO, “ECOLOGY OF CONSTRUCTION MATERIALS” of Bjorn Berge, 1999, translated and adapted for Portuguese, Universidade Minho (UM), Portugal, 2007
vii CIMPOR Cimentos de Portugal, SGPS, SA., RELATÓRIO DE SUSTENTABILIDADE
’08, “Portugal, 2008
viii Stahlinstitut VDEh und Wirtschaftsvereinigung Stahl im Stahl-Zentrum,
ENERGIEWIRTSCHAFT, "ENERGY MANAGEMENTE”,
http://www.stahl-online.de/Deutsch/Linke_Navigation/Technik_Forschung/Energie_und_Umwelttechnik/En ergiewirtschaft.php?highmain=2&highsub=3&highsubsub=1, Germany, 2010, last
consulted May 2011
ix Weddige, Hans-Joern, Thyssen Krupp Steel, INSIGHTS FROM STEEL –
BENCHMARKS AND THE ENVIRONMENTE, Germany, 2009
x Sazedj, Soheyl, Análise de Sustentabilidade de Alvenaria Estrutural, PhD theses, Faculty