Financing Constraints and the Firm Size Distribution:
Are Young Firms Constrained?
Francisco Fernando Leal Marques Augusto 152210011
Supervisor: Isabel Horta Correia Co-Supervisor: Pedro Santos Raposo
Dissertation submitted in partial fulfillment of requirements for the degree of MSc in Economics, at the Universidade Católica Portuguesa, September 24th 2013.
i
Abstract
Financing Constraints and the Firm Size Distribution: Are Young Firms Constrained? Francisco Fernando Leal Marques Augusto
This work evaluates the existence of financial constraints over young firms for the period 2002-2007. Starting by evaluating the shape and evolution of the FSD across this period, the expected impact over the distribution is observed. To confirm if the observed patterns are effectively financing constraints over young firms, the approach conducted by Cabral & Mata (2003) is replicated for the same period of data. This procedure delivers successful results: financing constraints limit the size of the firm at an initial stage of firms’ life. Furthermore, this conclusion is weighted over the possibility of different kind of factors driving financial constraints: a simple exercise comparing the hypothetical access to financial markets by young firms is conducted, leading to the conclusion that the financing constraints acting over firms for the period 2002-2007 are due to idiosyncratic characteristics of the firms.
ii
Ackowledgments
I am thankful to Ministério da Segurança Social e do Trabalho and Fundação para a Ciência e Tecnologia for the access to the Quadros de Pessoal dataset.
The undeniable guidance and support conceded by Professora Isabel Horta Correia and Professor Pedro Santos Raposo left an irreplaceable mark over this thesis and will serve as inspiration for my future career. In particular, I thank Professora Isabel Horta Correia for introducing me to the paper that strongly acts as an inspiration for this work (Cabral & Mata, 2003) and Professor Pedro Santos Raposo for the priceless Stata CAE and education codes that tamed the data that ultimately led to all the conclusions presented in this thesis.
This thesis largely surpasses its numerous pages. If it results from my deep interest on the evolution of the firms’ lifecycle and its aggregate impact over the economy, it is a consequence of six years of study, friendship and life that will be remembered with happiness and nostalgia. The support received from my family and friends during all these years is the key element for the successful completion of the challenges I come across in life.
In particular, I am grateful for my Grandmother’s cookings and midnight: “Como é que isso corre?”’s, thankful for my Father, Xana, Gonçalo and Xando’s Sunday night dinner discussions and indebted with Francisca for her patience and uttermost support.
A word of gratification for all my friends and colleagues that shared with me the experience of embarking on an Economics Bachelor program when the Economy was no longer what it was in the books, and the never-ending bounds created by the most distinguished MSc in Economics group the University has ever come across. Finally, a very special praise for the Post-Graduate Program in
Banking, Financial Regulation and Supervision’s friends, which undeniably allowed me to discover my
III
Contents
ABSTRACT ... I ACKOWLEDGMENTS ... II LIST OF FIGURES ... IV LIST OF TABLE REFERENCES ... IV
1. INTRODUCTION ... 1
2. LITERATURE REVIEW: THE FSD AND FINANCING CONSTRAINTS ... 3
3. ARE YOUNG FIRMS FINANCIALLY CONSTRAINED? ... 6
3.1 VALUING THE IMPACT OF FINANCIAL CONSTRAINTS OVER THE FSD ... 6
3.2THE ENTREPRENEUR AND THE SIZE OF THE FIRM:PROVING THE EFFECT OF FINANCING CONSTRAINTS OVER THE FSD ... 11
3.3 FINANCING CONSTRAINTS OVER YOUNG FIRMS: IDIOSYNCRATIC CHARACTERISTICS OF THE FIRM VERSUS CIRCUMSTANTIAL CREDIT RATIONING ... 16
4. CONCLUSION ... 22
BIBLIOGRAPHY ... 24
APPENDICES... 26
APPENDIX 1: DATA SELECTION ... 27
1.1. Data Sampling for Graph 1 and Graph 4 ... 28
1.2. Data Sampling for Graph 2, Graph 3 and Graph 5 ... 28
1.3. Data Selection for Subsection 3.2 ... 30
APPENDIX 2: A MODEL FOR FINANCING CONSTRAINTS OVER YOUNG FIRMS ... 32
IV
L
IST OFF
IGURESFIGURE 1 – FSD BY AGE COHORTS, 2002 AND 2007 ... 10
FIGURE 2 – FSD OF FIRMS BORN IN 2002, IN 2003, IN 2007 AND IN 2003 FOR THOSE WHICH SURVIVED UNTIL 2007 10 FIGURE 3 – FSD OF THE NEW SAMPLE OF FIRMS IN 2002 AND 2007 ... 13
FIGURE 4–FSD BY AGE COHORTS,1986,1991,1996,2002 AND 2007 ... 18
FIGURE 5-FSD OF FIRMS BORN IN 1986,1991,1996,2002 AND 2007, REPRESENTING THE FIRMS BORN ON THOSE YEARS AND THOSE THAT SURVIVED UP TO 6 YEARS OF LIFE, IN THE YEAR OF BIRTH AND AFTER 6 YEARS. ... 19
FIGURE 6 – THE EVOLUTION OF THE PORTUGUESE YIELD CURVE, JULY 1993 – JULY 2012, PERCENTAGE VALUES. ... 20
FIGURE 7 – INTEREST RATES MEASURED BY DIFFERENT INDICATORS (PERCENTAGE VALUES) ... 34
L
IST OFT
ABLER
EFERENCES TABLE 1–SAMPLE NUMBER OF FIRMS,2002 AND 2007... 8TABLE 2 – SAMPLE NUMBER OF FIRMS, DIVIDED BY AGE-COHORT, 2002-2007 ... 8
TABLE 3 – NUMBER OF FIRMS BORN IN 2002 AT 2002 AND SUBSEQUENT YEARS ... 9
TABLE 4 – AGE CLASS DEFINITION BY THE YEAR OF BIRTH OF ENTREPRENEUR ... 13
TABLE 5–REGRESSION RESULTS FOR THE YEARS 2002 AND 2007 ... 15
TABLE 6 – CREDIT ACCESS DYNAMICS ON TWO SUBSEQUENT PERIODS ... 20
TABLE 7 – ENGLE-GRANGER TEST COMPARING THE YIELD RATE AGAINST THE INTEREST RATES TO THE NON-FINANCIAL SECTOR ... 35
1
1. Introduction
The study of firms in the economy elucidates the evolution of markets and the economy as a whole. Among other effects, firm size persistently developed new grounds explaining the lifecycle of firms and the effects of several determinants impacting firms’ decisions and growth. One of its strongholds is the Firm Size Distribution (FSD): its rightly skewed form and unstable behavior are a consequence of many different incentives faced by the firms. For instance, recent literature (Braguinsky, et al., 2011) proved that strong distortions upon the labor market created incentives that eventually diminish firms’ will to grow. This argument is used to justify the strongly skewed distribution pattern for the Portuguese economy observed over the last decade.
Adding to the previous reasoning, financing constraints have also been considered as a strong limiting factor for firms’ development, helping explain the skewed shape of the FSD. For a large batch of Italian firms, Angelina & Generale (2008) proved that financing constraints act as a limiting factor, specifically when firms are young.
The importance of financing constraints over the FSD is quite straightforward: with limited access to credit, some of the firms do not have sufficient access to funds that would enable them to grow to their optimal size. The rightly skewed distribution would be the aggregate result of the lack of funds available to the firms. The effect is intensified when firms are young and this is due to a variety of reasons: incomplete market information or lack of guarantees from the entrepreneur are relevant examples. (Cabral & Mata, 2003) have already proved that financing constraints are crucial in the definition of the FSD for the period 1986-1991, exactly focusing on the FSD of young firms.
The question to be posed is quite straightforward: are young firms financially constrained over a more recent period?
In order to answer this question it is crucial to understand and evaluate the dynamics and shape of the FSD of differently aged firms. To fulfill this purpose, the total set of firms in the Portuguese economy for the period 2002-2007 in the manufacturing sector is divided by several subsets of firms with different ages. The key variable is firm size, defined as the total number of employees of the firm, the same procedure executed by Cabral & Mata (2003) and Angelina & Generale (2008).
From this variable, the shape of the FSD is evaluated, with the sole purpose of identifying patterns that point towards the relevance of financing constraints. Generically, if financing constraints are relevant for younger firms, most of them will have sub-optimal sizes, which will lead to a strong right skewness upon the FSD of the young firms. Similarly, older firms will present less skewed distributions, as financing constraints become less relevant across time.
FI N A N C I N G CO N S T R A I N T S A N D T H E F S D: AR E Y O U N G F I R M S C O N S T R A I N E D?
2 Even if the shape of the FSD appears to reveal the effect of financing constraints over the size of the aggregate of firms, this result does not imply per se the existence of financing constraints upon young firms. Any other determinant limiting the optimal size of firms would expectedly create this type of pattern over the distribution. Nevertheless, proving this evolution over the shape of the FSD is a first step to recognize the aggregate impact of financing constraints over firm size.
This analysis is taken further by replicating the model of Cabral & Mata (2003) for the period 2002-2007, where the age of the entrepreneur, as a proxy for the total wealth available for the firm, will assess if the patterns observed in the study of the FSD are due to financing constraints.
Proving the existence of financing constraints raises another question: is this effect due to idiosyncratic characteristics of the firm or due to conjectural financial market limitations?
A distinction between idiosyncratic effects (young firms are financially constrained because they are young) and circumstantial credit rationing (supply of credit is limited at an initial stage and less limited at a later stage in an exogenous way to the firms, such as financing institutions inability to access funds) is considered.
This thesis suggests that the 2002-2007 period presents sufficient characteristics to study the guarantee financing constraints are due to idiosyncratic characteristics of the firms, while controlling for the circumstantial credit rationing effects.
This work is organized as follows: section 2 discusses the FSD and the financing constraints in economic literature. Section 3 is divided in three subsections: on the first subsection, the pattern of the FSD is analyzed; on the second subsection, the replication of Cabral & Mata (2003) study is conduced and on the third the type of effects verified over the two previous subsections is evaluated; section 4 concludes.
3
2. Literature Review: the FSD and Financing Constraints
Firm size always embodied the search for the dynamics and determinants of firms’ evolution in a market. The FSD, as an aggregate picture of the size of firms, defined relevant patterns used to confirm the evolution of firms across time, while extrapolating determinants that by affecting a firm’s individual behavior define the shape of the FSD.Amazingly, the most widely recognized result of this approach belongs to Gibrat (1932). The FSD was proved to follow a log-normal distribution, implying firm growth is independent from firm size. This conclusion was supported by the apparent stable pattern of the shape of the FSD across time.
The first statement relates to proportional growth, i.e., given a set of firms, the probability of a 1% growth is the same whether the firm has 10 or 1000 employees, and besides its usual reference as Gibrat’s law, it is also known as the Law of Proportional Effect. These two conclusions were readily embodied in literature, reaching the status of stylized facts for quite a long time (e.g. the results of Simon and Bonini (1958) or Mansfield (1962)). On the other hand, the stability of the FSD implies that its shape remains the same across time. Combining both effects guarantees that firms’ proportional growth remains as a constant particularity across time.
Starting in the 70’s, a new wave of studies led to a different conclusion1: the growth of firms may be related with their size. Smaller firms grow faster than larger firms, controlling for the firms that survived their first years of life (Du Rietz (1975), Evans (1987) and (Dunne, et al., 1988)). Additionally, the FSD is not stable over time (Angelini & Generale (2008)) and log-normality may not be observed for the entire FSD (Cabral & Mata (2003)). The justification for these results relies on the quality of the data used by the studies: they started embodying the entire set of firms for a given sector of an economy, instead of merely a convenient sample of firms, usually obtained from public information datasets.
As Angelini & Generale (2008) point out, these new conclusions led to the creation of two new stylized facts: the FSD is extremely skewed to the right (Cabral & Mata, 2003) and skewness decreases monotonically to the left as firms age (at a given moment in time, younger firms are more skewed than older firms (Cabral & Mata, 2003). Cabral & Mata (2003) study started from the evaluation of the log-normality of the FSD hypothesis across a large manufactory dataset of Portuguese firms, for the period 1986-1991. Making use of the extended generalized gamma distribution, the authors concluded that the FSD for the complete set of firms did not followed a log-normal distribution, presenting instead a rightly skewed distribution. Nonetheless, if the process was repeated for subsets of differently aged firms, the oldest subset of firms followed a log-normal distribution.
FI N A N C I N G CO N S T R A I N T S A N D T H E F S D: AR E Y O U N G F I R M S C O N S T R A I N E D?
4 These two stylized facts destroyed the original framework defined in this section: firm growth now depends on firm size. Accepting this statement leads to two important questions: which factors explain size and, consequently, firm growth? Moreover, how does the aggregate impact of those factors over individual firm explain the shape and distribution characteristics of the FSD?
By defining the firms’ lifecycle as the set of characteristics presented by a firm at each period from the moment it enters a market, to the time it leaves that market, allows for the recognition and discussion of plausible firm size determinants. Those related with idiosyncratic factors to the firm and those which exogenously affect the complete set of firms. Among the several determinants considered, what are those that can ultimately be translated in the FSD, or, on the opposite case, which determinants may emerge by observation and discussion of the FSD? Several have been presented in literature but can be generically defined in two main categories:
1. Constraints to efficient firm size, meaning firms may have a sub-optimal size given their characteristics;
2. Thresholds to efficient firm size, in the sense of the existence of more efficient “sizes” along the FSD.
The second category received great focus due to the study of Braguinsky, et al. (2011), arguing on how labor market policy and restrictions have pushed the Portuguese FSD to the left and may have even lowered aggregate productivity.
On the other hand, this thesis considers the first type of determinants, particularly the case of financing constraints over young firms. In case they exist, they are expected to lead to a right skewed FSD for young firms that will tend to disappear as they grow older.
Using the complete set of firms of the Portuguese manufacturing sector, Cabral & Mata (2003), evaluated if financing constraints could explain the previously presented dynamics. By defining a simple model where the wealth of the entrepreneurs (as proxied by the age of the entrepreneur) was the relevant variable to explain firm size, they have proved that financing constraints occur, in a framework of asymmetric information problems. The dataset considered was the same for which they concluded that the right skewness of the FSD decreased as older firms where considered, successfully relating both dimensions of analysis.
Also over an asymmetries of information framework, Angelina & Generale (2008) proved that financing constraints played an active role over young firms in the Italian manufacturing sector over a more recent period of data (2005). Aghion, et al. (2007) found that the level of financial markets efficiency has a limiting impact over the decision of new firms to entry the market, this time considering information regarding 16 industrialized and emerging countries.
5 Thus, this evolutionary pattern over firms seems to be related with firms’ idiosyncratic effects over the firms’ lifecycle and finds solid ground over financial intermediation literature. Assimetries of information may limit the access to credit to firms which are new in a market, or enter new projects: if bank monitoring is not sufficiently developed, assimetries of information limiting the credit institutions to aknowledge the project cash-flows, may retract them from lending, limiting firms to the offering of debt contracts to grant funds (Diamond, 1991); limited liability of the debtholder will restrain credit to firms, effect that when controlled enables young firms to grow faster (Albuquerque & Hopenhayn, 2004); the possibility of assimitries of information arising from lack of collateral (Berger, et al., 2011) may become more relevant when the total wealth available for the entrepreneur is not sufficient to attain the optimal size of the firm.
Young firms have the characteristics to justify the relevance and existence of credit constraints. Nevertheless, the possibility of distinction between idiosyncratic effects and circumstantial financial market limitations has never been accounted for by any of the previous empirical studies of this field, as far as the author could acknowledge. The distinction between firms’ idiosyncratic characteristics and circumstantial financial market limitations is crucial to elucidate if it is the case that the previously presented characteristics are limiting the young firms or if it is the case of harsher supply credit conditions in the market and will be discussed in further detail in subsection 3.3 of this thesis.
6
3. Are Young Firms Financially Constrained?
3.1 Valuing the Impact of Financial Constraints over the FSD
The FSD is an excellent starting point to understand the determinants affecting the evolution of firms along their lifecycle. Common determinants affecting firms’ size will develop smaller or larger impacts over the FSD. By studying these impacts, overall or specific subsets of the distribution will present adherence to the hypothesis created upon its shape.
If young firms are financially constrained, firm size is expected to be lower than or at the firms’ optimal level. Independently from the way firm size is measured, if the firm is not able to gather the desired funds from the credit market, either it has enough own funds to develop its activity, or it will remain at a sub-optimal level. Notice that this rationale is independent from the optimal size of the firm, i.e., being small may be an optimal decision for a firm.
This impact will be traduced in a rightly skewed FDS for young firms, where part of the set will be undersized by lack of funds, while the other part has sufficient funds to attain its optimal size. As financial constraints are eroded (for instance, asymmetries of information seize to exist) all firms will have the needed funds available, attaining at their optimal size, ceteris paribus. Consequently, the FSD of older firms will be less skewed than that of young firms.
This is not a new hypothesis. Cabral & Mata (2003) and Angelina & Generale (2008) already implied this intuition over the FSD in their works. Both authors considered the same approach over different sets of firms2: by dividing the complete set of manufacturing firms over subsets of differently aged firms, the authors evaluated how the shape of the FSD varied across these subsets. Firm size is defined as the total number of employees of a firm. With this framework, the studies concluded that the FSD of young firms presents a rightly skewed distribution, that fades away when older firms are considered (Cabral & Mata, 2003, Angelini & Generale, 2008), or the same young firms are considered at a later age (Cabral & Mata, 2003). Using the same methodology will enable to assess if the pattern of the FSD suggests the existence of financing constraints in 2002 and 2007, while allowing comparisons across different periods of the same dataset (cf. Cabral & Mata(2003)), in addition to comparisons across different countries, for roughly the same period (cf. Angelina & Generale (2008)).
2 Cabral & Mata (2003) used the same dataset used by this thesis for the years 1984 and 1991. Angelina & Generale
(2008) considered a large set of survey respondent Italian firms for the years 1992, 1995, 1998 and 2001, and, additionally, the WBES, a large dataset of firms with more than 5 employees, produced by the World Bank for the years 1999 and 2000.
7 Other firm size definitions might have been considered (for instance, total firm assets). Still, the total number of employees guarantees comparability across several relevant studies of this field. Besides those already attributed to Cabral & Mata (2003) and Angelina & Generale (2008), it will allow to comprehend if financing constraints are a contemporaneous effect to labor market distortions studied by Braguinsky, et al. (2011), which conduced to a rightly skewed FSD. For the exact same reason (although limited to the paper of Cabral & Mata (2003)), the FSD will only verse upon the manufacturing sector. This may act as a limitation for the study, since other sectors may reveal as important determinants for the evolution of firms. This work does not deal with this limitation, but studies on other sectors, such as services, could be a clear path for future research3. The reference period was also selected bearing in mind comparability properties with the previous works.
To draw the FSD of the selected set of firms, both authors considered a Kernel-smoother approach, strongly justified by the non-parametric nature of this technique. This way, a graphical representation of the FSD emerges without imposing any empirical distribution upon the considered sets of firms4. To define the sample of age to be graphed by the Kernel, Cabral & Mata (2003) took two steps: first, they divided the set of firms by age groups creating several distributions across time; secondly, they defined a sample of timely born firms and pictured the distribution at the moment they were born and after some years have passed. Angelina & Generale (2008) followed a similar procedure, although aggregating firms with the same age from different sample years on a whole set of firms with different age.
With this framework, both studies concluded that the FSD of young firms presents a rightly skewed distribution when compared to the FSD of older firms. Using the same methodology of Cabral & Mata (2003) will enable to assess if the pattern of the FSD suggests the existence of financing constraints in 2002 and 2007, while allowing comparisons across different periods of the same dataset (cf. Cabral & Mata(2003)), in addition to comparisons across different countries (cf. Angelina & Generale (2008)).
Thus, to evaluate the existence of this pattern over the FSD, the complete set of firms of the manufacturing sector of the Portuguese economy for the year 2002 and 2007 was selected. Data was obtained in the employer-employee dataset Quadros de Pessoal. This large dataset comprises information about the firm and its employees of all salary-paying firms in the Portuguese economy. Inquiries asking for information as of October of the contemporary year compose this dataset and are of mandatory response to every firm5.
3Sutton (1995) discuss how this preference for the manufacturing sector was born from sample convenience and
how it may act as a limiting property of this literary field.
4This thesis will also use the kernel parameterization of Cabral & Mata (2003). Comparability properties are also
considered as justification.
5Until 1993, data was obtained with reference to March of the contemporary year. Any possible effects arising due
FI N A N C I N G CO N S T R A I N T S A N D T H E F S D: AR E Y O U N G F I R M S C O N S T R A I N E D?
8 Firm size was defined as the total number of employees of a given firm. The FSD will only verse upon the manufacturing sector. This may act as a limitation for the study, since other sectors may reveal as important determinants for the evolution of firms. This work does not deal with this limitation, but studies on other sectors, such as services, could be a clear path for future research6. The reference period was also selected bearing in mind comparability properties with the previous works.
The total number of firms for each of the years of study is presented in the table below:
Table 1 – Sample number of firms, 2002 and 2007
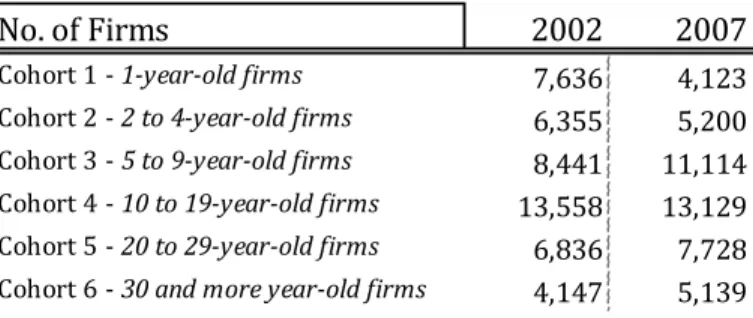
If financing constraints are expected to be found over young firms, the FSD should present a more skewed pattern when young firms are considered. To confirm this hypothesis, two procedures are followed. First, the total sample of firms is divided by firms’ age. A total of 6 age categories (age cohorts) are defined, comprehending more granular categories over the young firms. The age of firms comprehended in each category and the total number of firms considered in each of the categories is presented in the table below:
Table 2 – Sample number of firms, divided by age-cohort, 2002-2007
This sample allows for the study of firms that lived for very different periods and will effectively control for different skewness patterns along the distribution for a large span of firm ages. Furthermore, it captures effects related with young firms, suggesting how those developments persisted or not for older periods of firms’ life. Nonetheless, this procedure is not sufficient to fully understand if financing constraints are playing an active role over young firms. By comparing firms that are not timely born, conditions facing each firm may have been different at different stages in life. The second procedure will correct for this factor: this time, only the firms born in 2002 are selected. Again, across these years,
will be referenced when relevant. Additonaly, the author obtained access to the dataset from 1986 to 2008,
but the complete set of employee information was only available up to 2007.
Year
No. of Firms
2002 46,973
2007 46,433
No. of Firms
2002
2007
Cohort 1 - 1-year-old firms 7,636 4,123
Cohort 2 - 2 to 4-year-old firms 6,355 5,200
Cohort 3 - 5 to 9-year-old firms 8,441 11,114
Cohort 4 - 10 to 19-year-old firms 13,558 13,129
Cohort 5 - 20 to 29-year-old firms 6,836 7,728
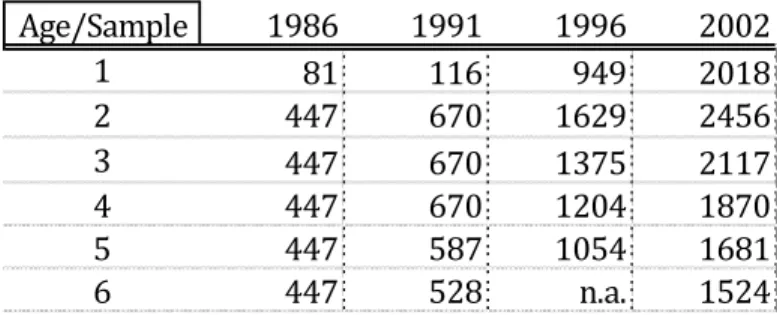
9 skewness of the FSD is expected to decrease as time advances. Firms born in 2002 will be followed in 2007, with the total number of firms confirming this pattern being presented on the following table7:
Table 3 – Number of firms born in 2002 at 2002 and subsequent years
Notice that there are more firms on the second year of life of any given year, than there is in the first, which would imply there would exist more firms in t+1 of firms born at t, than at year t. This is due to one of the dataset’s particularities: since the study counts with information of firms up to a certain month of the year, subsequently born firms will only appear on the subsequent year of report8.
By drawing the FSD, it is easy to conclude upon the trustworthiness of the hypothesis. In this sense, the Kernel density smoother turns out as an excellent approach since it allows for adequate data adaptability, while not imposing a formal parameterized form over the distribution. Overall, it will generate a clear picture of the FSD which will allow for the evaluation of the stated hypothesis and is generally presented in the following form (Wand & Jones, 1995):
̂( )
∑ (
)
Where, in the context of this thesis, ̂ is the estimated density function, x is a given point in the distribution, K(.) stands for the kernel, h stands for the bandwidth, n is the total number of firms and the observed (log) size of firm . The decision to use the log of firm size is justified by dispersion of firm size, without significance losses. As the parameterization for the Kernel, a Gaussian form with 0.50 bandwidth was chosen.
By computing the kernel figures for the previously considered cohorts, this pattern becomes evident. For both types of sample, the kernel-density smoother estimated and the results are presented in the following graphs:
7 For further discussion upon sample selection, please consider appendix 1 and its subsections. 8 For full discussion of this particularity, please consider Appendix 1.2.
No. of firms
Born in 2002
in 2002 2,018 in 2003 2,456 in 2004 2,117 in 2005 1,870 in 2006 1,681 in 2007 1,524
FI N A N C I N G CO N S T R A I N T S A N D T H E F S D: AR E Y O U N G F I R M S C O N S T R A I N E D?
10
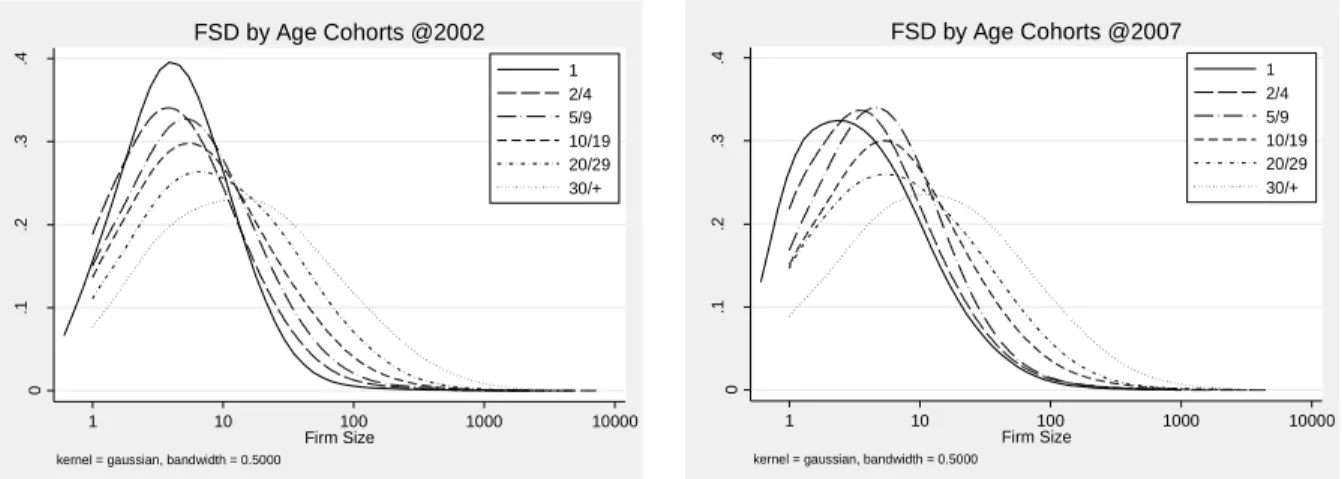
Figure 1 – FSD by age cohorts, 2002 and 2007
Figure 2 – FSD of firms born in 2002 pictured in 2003, 2007 and 2003 for those which survived until 2007
Graph 19 presents the FSD of the complete set of firms divided by the age cohorts, both for 2002 and 2007. A clear evolution towards a less skewed distribution is clearly observed, as the older cohorts persistently move to the right.
Graph 210 presents the FSD for the firms born in 2002 pictured in 2003, 2007 and those that survived up to 2007 in 2003. This strange year selection is due to the already mentioned particularity in the dataset: since the survey considers firms in a given year up to the month the survey is produced, it is blind to the firms born after the period of the survey. Therefore, some firms are not considered in the year they are born. To correct this limitation, the FSD of the firms born in 2002 was pictured with reference to 2003. Even if some firms have not survived until 2003, this procedure will lead to better representation of the whole set of firms being born in 2002.
9Sample selection details on appendix 1.1.
10Sample selection detail on appendix 1.2.
0 .1 .2 .3 .4 D e n si ty 1 10 100 1000 10000 Firm Size 1 2/4 5/9 10/19 20/29 30/+
kernel = gaussian, bandwidth = 0.5000
FSD by Age Cohorts @2002 0 .1 .2 .3 .4 D e n si ty 1 10 100 1000 10000 Firm Size 1 2/4 5/9 10/19 20/29 30/+
kernel = gaussian, bandwidth = 0.5000
FSD by Age Cohorts @2007 0 .1 .2 .3 .4 D e n si ty 1 10 100 1000 10000 Firm Size Born at 2002 in 2003 Suvivors at 2007 Survivors 2007 in 2003
kernel = gaussian, bandwidth = 0.5000
11 Although it is a more subtle effect than those present at graph 1, a clear move to the right is observed, whether we consider the all sample of firms born at 2002 in 2003, or simply those which survived up to 2007 in 2003.
It is concluded that the pattern expected in case financing constraints are a limiting determinant over the firms’ size occurs. The following results are enunciated:
Result 1: For the years 2002 and 2007, the strong right skewness observed for the young firms, progressively tends to disappear as older firms are considered.
Result 2: For the years 2002 and 2007, if the FSD of the same set of firms is pictured over two different periods, the FSD of the young version of firms is more skewed to the right than that of the older version of firms11.
Therefore, the pattern observed over the FSD of the several subsets of differently aged firms created, allows for the recognition of the hypothesized shape of the FSD. This suggests that a relevant set of firms may start its participation in a market with an under-optimal size, opening up the possibility of study of the FSD from financing constraints perspective for the years 2002 and 2007.
3.2 The Entrepreneur and the Size of the Firm: Proving the Effect of Financing
Constraints over the FSD
To understand if financing constraints act over young firms for the years 2002 and 2007, the model defined and computed by Cabral & Mata (2003) is replicated in this thesis. The key variable in this model is the wealth of the entrepreneur: it will measure the likeliness of the firm being under-sized at its early moments of existence. The firm may attain its optimal size if the entrepreneur has enough wealth available or if the financing constraints are not enough to influence the achievement of the desired size. If not enough wealth is available to the entrepreneur, the firm will have an under-optimal size. Therefore, the relevant factor is how the wealth of the entrepreneur allows the firm to achieve the firms’ desired optimal size. Even so, the decision upon the efficient size of the firm is independent from that restriction. As firms age, financing constraints are eroded and firms (at least those that survive) achieve their desired size. Overall, due to financing constraints, some firms may not have their efficient size when they enter the market, which leads to an extremely skewed FSD just like that one observed in section 3.1. Their model satisfactorily replicates and explains the FSD shape and is based on the premise that the age of the business owner is a proxy for the wealth of the entrepreneur12.
11Results 1 and 2 are also obtained if other years are considered, notably, 1986, 1991 and 1996. This supports the
consistency of both results.
FI N A N C I N G CO N S T R A I N T S A N D T H E F S D: AR E Y O U N G F I R M S C O N S T R A I N E D?
12 The authors carefully review the assumption that age is a good indicator to the assess of wealth across time, regressing the size of the firm against this and other firm relevant variables. They prove that age is significant when firms are young and non-significant when firms are old, which, as a proxy of wealth, guarantees that financing constraints are important for firms at the beginning of their activity.
The procedure to be replicated, perfectly mimics this approach, whether from sample selection process, the equations to be estimated or the variables selected to be part of the equations.
To start with, the entrepreneur is defined as an employee identified as “Business Owner” in the Quadros
de Pessoal dataset. Only the firms showing the same entrepreneurs across both periods were selected,
implying that only firms for which the original entrepreneurs remained at the firm for the complete set of time were used, regardless of the number of persons identified as entrepreneurs for one specific firm. Actually, this is a small13 depart from the selection presented in Cabral & Mata (2003) where all entrepreneurs belonging to the firm were included, and no reference is made to the possibility that the other “Business Owners” entered along the way. This selection does not compromise comparative properties of the model, embodies this selection refinement14.
Not all firms considered in subsection 3.1 presented valid information over their business owners. This raises questions over the consistency of the results identified in section 3.1 and 3.2 since those graphs considered firms that will not have entrepreneurs with sufficient information to be considered in this study. Graph 3 pictures the FSD for the new sample of firms. Notice that since the choice of entrepreneurs (and consequently firms) is constrained upon 2002, there is no need to represent the distribution of firms in 2003. In addition, this sample will only consider those firms that survived until 2007. Consequently, there will be no need to distinguish the distribution of the firms in 2002, which survived up to 2007, and the global set of firms born in 2002 because they will coincide.
13 And unique.
13
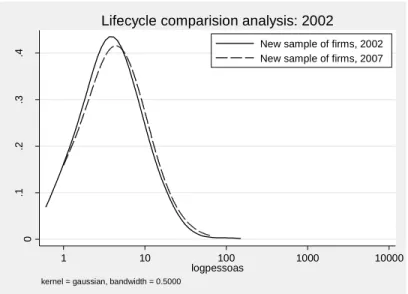
Figure 3 – FSD of the new sample of firms in 2002 and 2007
Graph 3 presents the same skewness pattern of graph 2: there is a (slighter) move of the FSD of older firms to the right. This way, and since the pattern is also observed, the model will hopefully explain if financing constraints occur over the firms in sample.
The size of firms is the variable to be explained by the regressions and is considered in its logarithmic form, consequence of its extremely skewed pattern. The age of the entrepreneurs is defined as the age of the entrepreneurs at 2002 and 2007. For the same reason as the variable size of the firm, age of the entrepreneurs is considered in its logarithmic form. Additionally, and to better understand how different age classes may impact over the development of firms along their lifecycle, four age classes are created and presented in the following table:
Table 4 – Age class definition by the year of birth of the entrepreneur
Dummies representing ten educational levels are considered to understand how different educational levels may perpetuate the efficiency of the firm: since 10 educational levels were identified, nine dummies were created.
0 .1 .2 .3 .4 D e n si ty 1 10 100 1000 10000 logpessoas
New sample of firms, 2002 New sample of firms, 2007
kernel = gaussian, bandwidth = 0.5000
Lifecycle comparision analysis: 2002
Age Class Class 1 Class 2 Class 3 Class 4 1953 -> 1961 Prior to 1952 -> 1952 1962 -> 1967 2002->2007 1968 -> Today
FI N A N C I N G CO N S T R A I N T S A N D T H E F S D: AR E Y O U N G F I R M S C O N S T R A I N E D?
14 On top of that, another set of dummies is created to decompose marginal effects arising from different economic sectors of activity. From the CAE 2-digits decomposition, 15 dummies were constructed over the manufacturing sector15.
Finally, to control for the level of efficiency associated with the entrepreneurs, education of the entrepreneurs at each of the years of study is added to the regressions. This way, the level of efficiency which could be associated with higher technical capabilities of the entrepreneurs will not affect the marginal effect of wealth (measured by the age of the entrepreneurs) on the final results.
A total of 750 entrepreneurs related to 562 firms are identified and used over the two years of analysis. The set of entrepreneurs is based on those who are simultaneously present on the two periods of analysis and for which information is completely available regarding the two variables over the two periods.
Three regression equations are defined with the underlying assumption that the log of firm employees follows a general gamma distribution16:
∑ ∑ { } { } (1) ∑ ∑ { } { } (2) ∑ { } (3)
Each one of the equations above tries to convene the information regarding age in such a way its characteristics are fully understood: the first equation measures the sole impact of the age of the entrepreneurs over firm size, leaving control variables over their dummy format. The second equation persists on the identification of the effects of the age of the entrepreneurs, this time by levels of age, partly dividing the effect over the smoother levels of differently aged/wealthier entrepreneurs. This equation relaxes over the expected positive relation between the age and the wealth of the
15 The CAE suffered several definition updates across time, namely, 1993, 2002 and 2007. This code
standardizes the CAE versions across the years. Some dummies may represent an adaptation of the CAE 2-digits nomenclature, including or excluding classes, according to the several nomenclature updates.
16Cabral & Mata (2003) used the extended generalized gamma distribution, as presented in Farewell & Prentice
(1977). The estimation carried on this thesis considered the generalized gamma distribution. The relevant differences between both only occur when kappa goes to infinity, therefore leading the distribution to a (log-) normal distribution, which does not appear as likely after studying the distribution for this hypothesis and rejecting it.
15 entrepreneurs by creating age classes, among which sufficient wealth would be available to the entrepreneur. Finally, the last equation simply combines the marginal effect over the (log) firm size of the age of the entrepreneurs and their education. Instead of classes of education represented in dummies, this regression accesses how far the number of years of education directly controls over the size of the firm.
The results are presented on the table below:
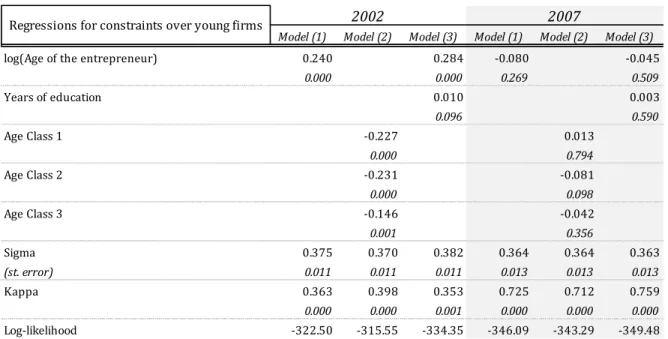
Table 5 – Regression results for the years 2002 and 2007. For each of the variables the top value represents the value of the coefficient, while the value in italic is the p -value (except for sigma, where it represents the standard error). For example, regarding the log of age of the entrepreneurs, 2.31% the expected increase in firm size by a 10% increase in the entrepreneurs’ age, while 0.000 the p-value of such coefficient. Dummies’ results for education and manufacturing not presented for briefness
Model one and three present significant and positive coefficients over the age of the entrepreneurs, while non-significant and negative coefficients over the second period of data. The positive and significant contribution of the wealth of the entrepreneurs (measured by the age of the entrepreneurs) over the first period, and non-significance over the second period appears to validate the hypothesis of financing constraints over young firms. Since the age of the entrepreneurs positively contributes to the size of the firm at the moment of firms’ birth, but becomes irrelevant at a later stage, the pattern found over the FSD appears to be related with financing constraints over firms, with the ability of remaining at optimal size being associated with the amount of wealth of the entrepreneurs.
Although the coefficient over the age of the entrepreneurs is non-significant at the second period of analysis, it presents a negative sign. Would this value be significant, the total amount of wealth available to the entrepreneurs would decrease the expected size of the firm after the firm had survived
Model (1) Model (2) Model (3) Model (1) Model (2) Model (3)
log(Age of the entrepreneur) 0.240 0.284 -0.080 -0.045
0.000 0.000 0.269 0.509 Years of education 0.010 0.003 0.096 0.590 Age Class 1 -0.227 0.013 0.000 0.794 Age Class 2 -0.231 -0.081 0.000 0.098 Age Class 3 -0.146 -0.042 0.001 0.356 Sigma 0.375 0.370 0.382 0.364 0.364 0.363 (st. error) 0.011 0.011 0.011 0.013 0.013 0.013 Kappa 0.363 0.398 0.353 0.725 0.712 0.759 0.000 0.000 0.001 0.000 0.000 0.000 Log-likelihood -322.50 -315.55 -334.35 -346.09 -343.29 -349.48
FI N A N C I N G CO N S T R A I N T S A N D T H E F S D: AR E Y O U N G F I R M S C O N S T R A I N E D?
16 for some periods. This may be considered a strange result. Two speculative explanations are given in this thesis: on the one hand, older entrepreneurs may have lower capacity to innovate, therefore compromising the growth of the firm after some years of activity have passed. On the other hand, more experienced entrepreneurs may achieve higher efficiency levels, decreasing the necessary number of employees. Both are simple suggestions for future research, since neither hypothesis is developed in this thesis.
Result 3: A simple model that considers the age of the entrepreneurs as a proxy of wealth estimates that the impact of wealth is positive and significant when firms are born and non-significant when those firms are older. Therefore, result 1 and 2 appear to be explained by financing constraints acting over young firms.
This is an important result since it confirms that the early moments of the firms’ lifecycle crucially depends upon how easily the entrepreneur has sufficient funds available to start the firm. Additionally, those results are true even after 15 years have passed over the original study of Cabral & Mata (2003). This inter-temporal consistency suggests that further investigation should continue over policies to strength the financing lines available to young firms, specifically, on the most common causes defined for financing constraints over young firms, such as asymmetries of information over the new firms.
3.3 Financing Constraints over Young Firms: Idiosyncratic Characteristics of the Firm
versus Circumstantial Credit Rationing
Although result 3 is in line with the intuition confirmed over the observed pattern of the FSD, the pattern may be a result of idiosyncratic characteristics over young firms or circumstantial credit rationing. Distinguishing both effects is crucial to the analysis: idiosyncratic characteristics guarantee that financing constraints act over young firms because they are young, while circumstantial credit rationing does not necessarily lead to that conclusion.
To start with, if idiosyncratic characteristics are relevant, the impact over the shape of the FSD of young firms is expected to be the same of that represented in section 3.1. This leads to one of two scenarios: if the constraints are idiosyncratic characteristics of the firms, they will persist across time, leading to a persistent skewed pattern over the FSD of younger firms, while older firms will present a less skewed pattern. Idiosyncratic characteristics would prove that financing constraints upon younger firms are a result of firms being young: for instance, asymmetries of information play a larger role for younger firms. The constraints would be more related to the demand side of the credit markets, since the firms with the same characteristics would face financing constraints independently of how easy it was to grant credit.
17 On the other hand, if the constraints are due to circumstantial credit rationing, they will vanish after some periods. This leads to the disappearance of the skewed pattern of the FSD over young firms, possibly conducting the movement of the FSD of older firms to the right as they grow along their lifecycle, without changing its skewness pattern. Circumstantial credit rationing would limit financing constraints to difficult credit access conditions that would be independent from endogenous factors to the firms. The constraints would be more related to the supply side of the credit markets, since the firms with the same characteristics would face different credit constraints dependent on when the asked for credit.
The subsequent analysis is conducted on a results robustness perspective. Nonetheless, no other estimation procedure is computed, or other assumptions tested, being the procedure limited to the analysis of the scenario upon which the model was estimated. This could be seen as a strong limitation to the exercise. Nevertheless, the patterns and evolutions presented are a clear step forward, since the differentiation between idiosyncratic characteristics of the firms and circumstantial credit rationing effects was never considered in literature, to the author best knowledge. Further research should consider the possibility of creating a different model endogenously embodying this difference, as this option is not considered in this thesis.
By replicating the exercise of graph 1 and 2 over other years of the sample of firms considered for section 3.1, the same pattern over the FSD is found. Again, firms are considered in logs, to correct for large dispersion. Age classes are the same as those defined in section 3.1.
FI N A N C I N G CO N S T R A I N T S A N D T H E F S D: AR E Y O U N G F I R M S C O N S T R A I N E D?
18
Figure 4 – FSD by age cohorts, 1986, 1991, 1996, 2002 and 2007
0 .1 .2 .3 .4 D e n si ty 1 10 100 1000 10000 Firm Size 1 2/4 5/9 10/19 20/29 30/+
kernel = gaussian, bandwidth = 0.5000
FSD by Age Cohorts @1986 0 .1 .2 .3 .4 D e n si ty 1 10 100 1000 10000 Firm Size 1 2/4 5/9 10/19 20/29 30/+
kernel = gaussian, bandwidth = 0.5000
FSD by Age Cohorts @1991 0 .1 .2 .3 .4 D e n si ty 1 10 100 1000 10000 Firm Size 1 2/4 5/9 10/19 20/29 30/+
kernel = gaussian, bandwidth = 0.5000
FSD by Age Cohorts @1996 0 .1 .2 .3 .4 D e n si ty 1 10 100 1000 10000 Firm Size 1 2/4 5/9 10/19 20/29 30/+
kernel = gaussian, bandwidth = 0.5000
FSD by Age Cohorts @2002 0 .1 .2 .3 .4 D e n si ty 1 10 100 1000 10000 Firm Size 1 2/4 5/9 10/19 20/29 30/+
kernel = gaussian, bandwidth = 0.5000
19
Figure 5 - FSD of firms born in 1986, 1991, 1996, 2002 and 2007, representing the firms born on those years and those that survived up to 6 years of lif e, in the year of birth and
after 6 years.
Graph 4 and graph 5 point to the conclusion that the movement along the FSD occurs for almost 20 years of data upon the FSD. This strongly suggests that the effects observed rely upon idiosyncratic characteristics upon firms, although the consistency of this statement needs to be assessed.
The way firms access credit should be evaluated, enabling to understand in which extent this occurs due to credit demand (predominantly developed from firms’ idiosyncratic characteristics) or due to credit supply (predominantly developing circumstantial credit rationing for firms). By using the yields of the two-year fixed rate Portuguese treasury bonds as a proxy for financial market access, it is possible to assess, first, when the rates show a constant behavior, and second, to compare for changes in level of those precise rates. This is a very limited choice, as other proxies could have been considered to evaluate the access to credit in the economy, for example, the rate over new loans to non-financial corporations. However, no other variable presented such a large timespan: this variable has available information from 1993 to 2007. The adequacy of this indicator is further discussed in Appendix 3.
0 .1 .2 .3 .4 D e n si ty 1 10 100 1000 10000 Firm Size Born at 1986 in 1987 Surivivors at 1991 Survivors at 1991 in 1987
kernel = gaussian, bandwidth = 0.5000
Lifecycle comparision analysis: 1986
0 .1 .2 .3 .4 D e n si ty 1 10 100 1000 10000 Firm Size Born at 1991 in 1992 Survivors at 1996 Survivors at 1996 in 1992
kernel = gaussian, bandwidth = 0.5000
Lifecycle comparision analysis: 1991
0 .1 .2 .3 .4 D e n si ty 1 10 100 1000 10000 Firm Size Born at 1997 in 1998 Survivors at 2002 Survivors at 2002 in 1998
kernel = gaussian, bandwidth = 0.5000
Lifecycle comparision analysis: 1997
0 .1 .2 .3 .4 D e n si ty 1 10 100 1000 10000 Firm Size Born at 2002 in 2003 Suvivors at 2007 Survivors 2007 in 2003
kernel = gaussian, bandwidth = 0.5000
FI N A N C I N G CO N S T R A I N T S A N D T H E F S D: AR E Y O U N G F I R M S C O N S T R A I N E D?
20 If rates are constant over time and firms are timely born, all firms will be facing the same credit supply restrictions across each year of life, caetirus paribus. Instead, different rates across two periods will imply different market access conditions across time, independently of the size of the firm.
The overall level of the interest rates is another challenge for the analysis. Consider the following scenario: for a defined period of time the rates do not move; then, at the subsequent and equal period of time, rates have jumped, but will nonetheless remain stable at the new interest rate level. Although firms born at the beginning of each of the two periods will face the same conditions for the entire period, firms with the exact same characteristics may face a higher level of financing constraints at the second period, than in the first period, since the interest rates are now higher. The dynamics are described in table 6.
Table 6 – Credit access dynamics on two subsequent periods
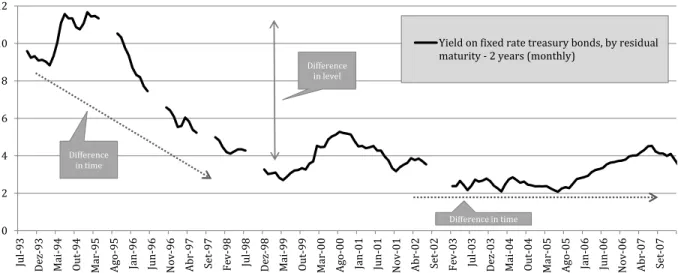
Both dimensions are embodied in the following graph presenting the Portuguese two-year interest rates for the period 1993-2012, as reported by the Bank of Portugal. The constancy effect is emphasized by the dotted arrows and the level effect is represented by the middle solid arrow:
Figure 6 – The evolution of the Portuguese yield curve, July 1993 – July 2012, percentage values.
Two clear periods are defined upon the series:
Low rates at t+1 High rates at t+1
Low rates at
t Constant - easy supply of credit
Irregular - access to credit easier at an early stage
High rates at t
Irregular - access to the credit
easier at a later stage Constant - hard access to credit
0 2 4 6 8 10 12 Jul -93 De z-93 M ai-94 Out -94 M ar-95 A go -95 Ja n-96 Jun-96 N ov-96 A br -97 Se t-97 Fe v-98 Jul -98 De z-98 M ai-99 Out -99 M ar-00 A go -00 Ja n-01 Jun-01 N ov-01 A br -02 Se t-02 Fe v-03 Jul -03 De z-03 M ai-04 Out -04 M ar-05 A go -05 Ja n-06 Jun-06 N ov-06 A br -07 Se t-07
Yield on fixed rate treasury bonds, by residual maturity - 2 years (monthly)
Difference in level
Difference
in time
21
The first period considered is 1993-1996: The rates’ variation during that period is large with a standard
deviation of 1.57% (if the series had considered data up to 1999, the standard deviation would have achieved 3.08%). During this period, the maximum of 12.67% is recorded, as rates ended in levels above 6.09%. Firstly, it can be concluded that rates are not constant. Secondly, this period seems to embody a change in the level of rates. Such large changes have many reasons, one of which is the change in monetary and fiscal policy allowing for the Portuguese entrance in the Eurozone.
The second period considered is 2002-2007: The rates’ variation during this period is low: standard
deviation is 0.73%. The variation interval was [2.08%; 4.53%]. It seems fair to assume that companies faced the same conditions of credit during this period. Regarding changes in level, it is clearly under the level at which the rates started at the beginning of 1993.
Since interest rates present a relatively constant behavior for the second period studied, the effects observed in section 3.1 and estimated in section 3.2 have strong signs of being related with idiosyncratic characteristics of the firms. Therefore, this leads to the conclusion that the estimated effects in subsection 3.2 are indeed motivated by the younger condition of firms, strengthening result 3.
Result 4: Since credit access conditions appear relatively stable across the period 2002-2007, financing constraints obtained in result 3 appear to be motivated by firms’ idiosyncratic characteristics, therefore confirming that firms are constrained because they are young.
Due to the irregular pattern of the interest rate series, it is difficult to conclude upon which kind of effects occur over other FSDs presented in graph 4 and 5. Even so, the period 1993-1998 suggests circumstantial credit rationing at the beginning of the period, since a large decrease in interest rates is observed17.
17If the same analysis were carried for the Cabral & Mata (2003) study, circumstantial credit rationing effects,
would possibly be identified. Although there is no data for the time of the study of Cabral & Mata (2003), it is still possible to do some analysis and speculate over the fluctuation of interest rates around that period. 1984 was the second year of the second IMF intervention in Portugal. It lasted for 3 years (1983-1985), being the middle year of the program the starting year of the study. The final year of the study was one of the most dynamic years for the Portuguese and the European economies: it was the subsequent year of the constitution of the European Economic Union, which eroded commerce, services and capital transaction barriers across several European countries. It also corresponded to one of the several years at which Portugal received significant funds from the EU. This deep contrast in economic conditions across the period examined in the study implies that conditions were radically different at the time companies were born from that where the study stopped its analysis. Consequently, analyzing if firms are financing constrained at this period does not elucidate if young firms are constrained because they are young or because financing constraints changed over the period.
22
4. Conclusion
Firm size is actively studied as a way of developing new grounds on the evolution of firms and markets. Studying the FSD and/or establishing hypothesis over its shape became a recurrent procedure in literature, developing strong ground for the determinants of firm growth. Specifically, and for a recent period, the study of Braguinsky, et al. (2011) considered policy practices dependent on firm size to explain the rightly skewed pattern of the FSD.
Other determinants could explain this pattern, thought. Financing constraints over young firms were widely studied in literature: first by Cabral & Mata (2003) for the portuguese manufacturing firms over the period 1984-1991 and then by Angelini & Generale (2008) for a large set of italian manufacturing firms regarding surveys for 1992, 1995, 1998 and 2001. Can financing constraints over young firms be found over a more recent period of analysis?
To answer this question the expected impact of financing constraints was hypothesized over the FSD: if young firms are constrained, their FSD should be strongly skewed to the right, since part of them will be undersized, specifically, by lack of funds to reach their optimal size. As financing constraints are eroded, they will grow towards their optimal size, changing the shape of the distribution towards a less skewed pattern. Using a large sample of manufacturing firms for the period 2002-2007, this shape is proved to exist.
Still, the existence of this pattern is not enough to guarantee that the determinant behind such pattern is financing constraints. To fulfill this purpose, the model of Cabral & Mata (2003) is replicated over the period 2002-2007. The age of the entrepreneur is a proxy for wealth, which is expected to ease the limiting effect of financing constraints. It is concluded that wealth, measured by age, is positive and significant when the firm is born, and non-significant after some years have passed. These results lead to the conclusion that financing constraints explain the observed pattern over the FSD, implying financing constraints affect young firms across the period 2002-2007.
Additionally, this thesis suggests that the 2002-2007 period presents sufficient evidence to attribute the financing constraints identified in the FSD to idiosyncratic characteristics of the firms. This robustness analysis strengthens the results, and is fundamental to understand if the financing constraints previously concluded are a result of firms being young or a result of circumstantial credit rationing.
Different paths for future research emerge from this thesis: the application of this study to the Portuguese economy for a period subsequent to 2008 may lead to interesting results, since firms’ credit
23 access has changed significantly and for many times from that period onwards. Relying so heavily on an association of the age of the entrepreneurs with wealth is limiting conclusions: wealth may not increase monotonically with age. Nonetheless, the wealth of the entrepreneur will always be a difficult variable to assess. New procedures to measure this variable would certainly be an excellent input to literature. Replicating the current study to other sectors would also be a good starting point for new research in this field, and would certainly allow better explanation of some of the effects discussed in this work18.
Overall, and for the period 2002-2007, firms present significant signs of having been financially constrained, consequence of idiosyncratic characteristics to the firms, confirming that firms may have been financially constrained because they are young.
18 Further limitations could be considered. Namely, the effect of financing constraints should be refined by the use of models that could endogenously differentiate idiosyncratic characteristics from circumstantial credit rationing. Finally, frameworks developed with the aim of evaluating the combined effect of some of the identified determinants would contribute to explain the overall change in shape of the FSD.
24
Bibliography
Aghion, P., Fally, T. & Scarpetta, S., 2007. Credit Constraints as a Barrier to the Entry and post-Entry growth of firms. Economic Policy, 22(52), pp. 731-779.
Albuquerque, R. & Hopenhayn, H. A., 2004. Optimal Lending Contracts and Firm Dynamics. Review of
Economic Studies, 71(2), pp. 285-315.
Angelina, P. & Generale, A., 2008. On the Evolution of Firm Size Distributions. The American Economic
Review, 98(1), pp. 426-438.
Berger, A., Espinosa-Vega, M., Frame, W. S. & Miller, N., 2011. Why do Borrowers Pledge Collateral? New Empirical Evidence on the Role of Assymetric Information. Journal of Financial Intermediation, 20(1), pp. 55-70.
Braguinsky, S., Branstetter, L. G. & Regateiro, A., 2011. The Incredible Shrinking Portuguese Firm. Cabral, L. M. B. & Mata, J., 2003. On the Evolution of the Firm Size Distribution: Facts and Theory. The
American Economic Review, Volume 93, pp. 1075-1090.
Chan, Y.-S. & Thakor, A. V., 1987. Collateral and Competitive Equilibria with Moral Hazard and Private Information. The Journal of Finance, 42(2), pp. 345-363.
Diamond, D., 1991. Monitoring and Reputation: The Choice between Bank Loans and Directly Placed Debt. The Journal of Political Economy, 99(4), pp. 689-721.
Dunne, T., Roberts, M. T. & Samuelson, L., 1988. Patterns of Frim Entry and Exit in the U.S. Manufacturing Industries. The RAND Journal of Economics, Volume 19, pp. 495-515. Ecorys, 2012. EU SMEs in 2012: at the crossroads, s.l.: European Comission.
Evans, D. S., 1987. The Relationship Between Firm Growth, Size, and Age: Estimates for 100 Manufacturing Industries. The Journal of Industrial Economics, Volume 35, pp. 567-581.
Farewell, V. & Prentice, R. L., 1977. A Study of the Distributional Shape in Life Testing. Technometrics, 19(1), pp. 69-75.
Kolmogorov, A., 1941. Confidence Limits for an Unknown Distribution Function. The Annals of
Mathmatical Statisctics, Volume 12, pp. 461-463.
MacKinnon, J. G., 2010. Critical Values for Cointegration Tests. Queen's Economic Department - Working
Paper No.1227.
Mansfield, E., 1962. Entry, Gibrat's Law, Innovation, and the Growth of Firms. The American Economic
Review, 52(5), pp. 1023-1051.
Royston, J. P., 1991. Comment on sg3.4 and an Improved D'Agostino Test. Stata Technical Bulletin 3, September, pp. 23-34.
25 Simon, H. & Bonini, C., 1958. The Size Distribution of Business Firms. The American Economic Review, 48(4), pp. 607-617.
26
Appendices
27
Appendix 1: Data selection
This thesis uses the employer-employee dataset Quadros do Pessoal. The completeness and applicability of these dataset ensured (and continues to do so) large popularity across literature. It comprises information about the firm and its members of all salary paying firms in the Portuguese economy, starting back in 1982.
Inquiries asking for information as of October of the contemporary year compose this dataset and are of mandatory response to each firm, although up to 1993 data was obtained with reference to March of the contemporary year.
The complete set of information comprehends an enormous ammount of data, and for this reason it can be divided in several subsections. Information can be considered either from the firms’ perspective, relating variables of the firm in an aggregate way for each reference year, or divided accordingly to each unique firms’ collaborator whether it is a business owner or an employee.
Considering the firms’ aggregate perspective, the author accessed to the dataset for the period 1984 – 2007. For the second dataset perspective, the full daset was obtained for the period 1986 – 2008.
This study disregards all non-manufacturing firms. In practical terms, it only considers sectors 3 to 19 of the CAE classification19. These include the following sectors:
o Mining and quarrying of energy producing materials;
o Mining and quarrying, except of energy producing materials;
o Manufacture of food products, beverages and tobacco;
o Manufacture of textiles and textile products;
o Manufacture of Leather and Leather products;
o Manufacture of wood and wood products;
o Manufacture of pulp, paper and paper products;
o Manufacture of cock, refined petroleum products and nuclear fuel;
o Manufacture of chemichals, chemichal products and man-made fibres;
o Manufacture of rubber and plastic products;
o Manufacture of other non-metallic mineral products;
o Manufacture of basic metals and fabricated metal products;
o Manufacture of machinery and equipment n.e.c.;
o Manufacture of electrical and optical equipment;
o Manufacture of transport equipment;
o Manufacture n.e.c.;
o Production of electricity, of gas and of water supply.
19The author is extremely grateful for the Stata code designed to adapt different CAE codes along its numerous
FI N A N C I N G CO N S T R A I N T S A N D T H E F S D: AR E Y O U N G F I R M S C O N S T R A I N E D?
28 As the work progresses, different perspectives upon the dataset will be considered. The following subsections consider each of the differenct sample selection exercises, for each of the sections previously considered.
1.1. Data Sampling for Graph 1 and Graph 4
For the construction of the Portuguese FSD by age cohorts, five years of data were considered: 1986, 1991, 1996, 2002 and 2007. Only three variables were considered to this exercise: reference year, firm size and firm age. The first two variables are readily available at the dataset. Firms’ age is not that linear, though. While there is a variable from the default dataset which considers firm’s age, many times this information is missing.
Nonetheless, there is another way of arriving at firms’ age. Besides reference year, year of constitution is also a variable considered for each firm. When information for both variables is available, it is possible to take the difference between the reference year and the constitution year, arriving at firms’ age.
If more than one constitution year was identified for the same firm, the minimum year was chosen. The reason behind this choice is related with the unique firms’ definition in the dataset, which limits the reason for the existance of several constitution years to two alternatives: whether the firm failed (or simply closed activity) and started again, or there is an inaccuracy in the dataset. By choosing to replace constitution year with the oldest reference year, it is assumed there is a specific reason to start a new firm from an existing one, which can be interpreted as the following up of the original firm’s lifecycle. In case of innacurracy, the minimum year is the correct year to consider, therefore traducing in the best answer to the problem. When the minimum year identified led to a negative age (constitution year was not correctly identified in the database) firm information was discarded.
1.2. Data Sampling for Graph 2, Graph 3 and Graph 5
This time, only firms with a completely defined lifecycle were considered which implied furthering the sample selection. From the subset of firms considered in Appendix 1 – 1.1, only those firms presenting values from their date of birth to disappearence were considered. Variables used were reference year, firm size and firm age.
This way, each years’ information relating to a defined year of birth is related with the same set of firms. The considered procedure gains are twofold: on the one hand, the set of firms for each year of birth will be surely facing the same conditions as its peers. On the other hand, it will allow for the replication of the procedure developed in Cabral & Mata (2003) where, by comparision of the FSD of the set of firms born at a specific year, the FSD of the survivors at a subsequent year and the FSD of the survivors at the year of birth, the effects impacting the firms’ lifecycle are assessed.