Do democratic governments
provide more goods and
services?
Manuel Cruz
Dissertation written under the supervision of Professor Alperen Evrin
Dissertation submitted in partial fulfilment of requirements for the MSc in
Economics, at the Universidade Católica Portuguesa, 07/06/2019.
Do democratic governments provide more goods
and services?
Manuel Cruz
Abstract
This thesis studies the relationship between democracy and government consumption, through the lenses of the median voter model of democratic redistribution developed by Meltzer and Richard. Taking a large sample covering countries across all regions of the world for the 1960-2017 period, I estimate a positive effect of democratization on government consumption, controlling for country and year fixed effects. However, these results are not robust, as high levels of significance are not retained once I take the dynamics of government consumption and the Nickel bias into account. Given potential issues of endogeneity, I also carry out a two-stage least squares (2SLS) strategy, by using regional levels of democracy as an instrument, and my results do not change substantively. The lack of definitive conclusions arising from my empirical analysis suggests the relationship between democracies and government consumption may be more ambiguous than the median voter model of redistribution implies. If, for instance, democracy is “captured” by the elites, levels of redistribution might not be determined by the newly enfranchised segments of the population. Thus, I also discuss some of the reasons why recently democratized nations should not necessarily be expected to increase their levels of government consumption.
Resumo
Nesta tese, estuda-se a relação entre democracia e consumo público, tendo em conta o modelo do eleitor mediano num contexto de redistribuição democrática, desenvolvido por Meltzer and Richard. Considerando uma amostra alargada de países de todas as regiões do mundo para o período 1960-2017, estimo um impacto positivo da democratização no consumo público, controlando os efeitos fixos ao nível do país e ano. Contudo, estes resultados não são robustos, já que os elevados níveis de significância não se mantêm uma vez considerados as dinâmicas do consumo público e o problema do enviesamento de Nickel. Dada a potencial existência de endogeneidade, levo também a cabo uma estratégia de mínimos quadrados em dois estágios (2SLS), usando níveis regionais de democracia como variáveis instrumentais e os meus resultados não se alteram substancialmente. A falta de conclusões definitivas da minha análise empírica sugere que a relação entre democracias e consumo público poderá ser mais ambígua do que o modelo do eleitor mediano presume. Se, por exemplo, uma democracia for “controlada” pela elites, os níveis de redistribuição poderão não ser determinados pelos segmentos da população que acabaram de conquistar poder politico. Assim, discuto também algumas das razões pelas quais não se deverão necessariamente verificar aumentos do consumo público em nações recentemente democratizadas.
Acknowledgements
First, I would like to thank my thesis advisor Professor Alperen Evrin for his guidance. The process of development of this thesis went through some twists and turns, but he always showed availability and provided me with useful insights.
This thesis was the final step in my Masters’ programme and its successful completion was dependent on the intellectual skills I have acquired over the last two years. For that reason, I would also like to thank the professors whose classes I have attended and my colleagues for the relentless enthusiasm and companionship. I am especially grateful to Professor Hugo Reis and to my colleague and friend Thomar Van Hees. The latter took some time off a very busy schedule to help me with suggestions, while the former not only taught me econometrics, but provided me with important comments regarding this thesis as well.
Last, but certainly not least, I would also like to thank my friends and family for the continued source of inspiration. In particular, I would like to express all the gratitude I have to my parents. None of this would have been possible without their efforts, support and unconditional love. Thank you.
List of contents
Introduction……….. 6 Literature Review………. 8 Benchmark Model……….... 11 Econometric Specification………... 15 Data………... 19 Results………... 21 Theoretical Considerations………... 26 Conclusion……… 30 References………. 31 Appendix………... 47Algorithm for the 𝑑𝑒𝑚𝑜𝑐 variable………... 47
List of figures
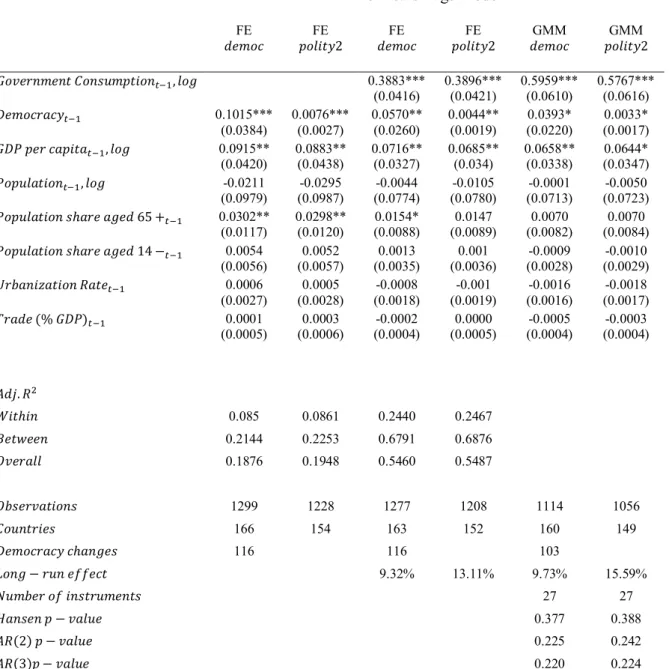
Figure 1: Average world democracy……… 44
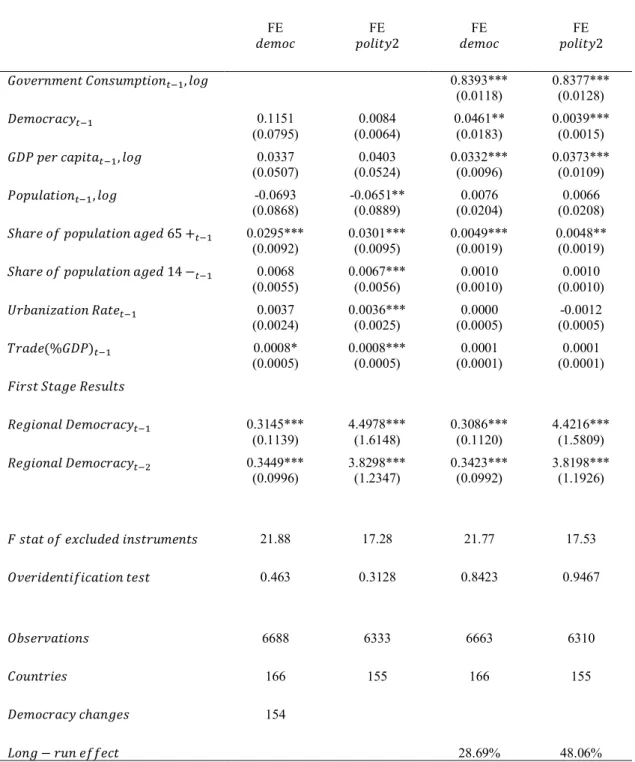
Figure 2: Average democracy across regions………... 45
Figure 3: Average government consumption and 𝑝𝑜𝑙𝑖𝑡𝑦2………... 46
Figure 4: Average government consumption and 𝑑𝑒𝑚𝑜𝑐……… 46
List of tables
Table 1: Summary Statistics………. 37Table 2: Democratizations in the sample………. 38
Table 3: Reversals in the sample………... 39
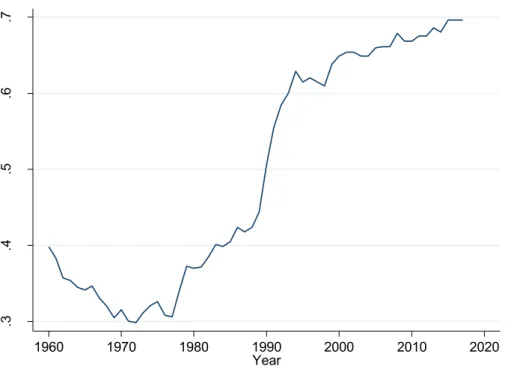
Table 4: Effects of democracy on government consumption – 1 Year Lag…... 40
Table 5: Effects of democracy on government consumption – 5 Years Lag………... 41
Table 6: 2SLS - Effects of democracy on government consumption - 1 Year Lag………. 42
Table 7: 2SLS - Effects of democracy on government consumption - 5 Years Lag……… 43
Table A1: World Bank Indicators – Original Sources………. 50
Table A2: Cross-country regressions………... 51
Table A3: Pooled OLS regressions – 1 Year Lag………... 52
6
Introduction
The world has faced dramatic political and economic changes over the last two centuries. From absolutist monarchies and subsistence levels of development to democratic republics and previously unimaginable standards of living, no early 19th century citizen could
have dreamed of the giant leap humankind was about to take. And, oddly enough, explaining this phenomenon nowadays remains just as hard as it was to predict it back then. Indeed, some theories attribute political changes to the unprecedented levels of economic growth. According to the Modernization Theory, economic development, with all its associated facets – industrialization, urbanization, education – has triggered the worldwide observed transitions from autocratic regimes to democracies1. Conversely, democratic regimes have been pointed
out as a catalyst for economic development, as leaders responding to popular demands should be more likely to enact economic liberalization reforms2. Authors such as Milton Friedman, on
the other hand, have claimed that both political and economic freedoms tend to reinforce each other3. To sum up, should we expect increases in standards of living to generate democratization
processes? Should we expect an acceleration of economic growth once a country democratizes? These are some of the most important questions in political economy.
The debate on the virtues and shortcomings of democracies precedes the observed historical transformations, however. Plato deemed democracy the second worst form of political organization, after tyranny, whereas Aristotle, though less sceptical, believed that the success of a democratic regime was conditional on the ability of the electorate not to succumb to demagoguery. In the first half of the 19th century, Tocqueville praised the ascent of
democracy in the United States, but also warned against the emerging risk of a “tyranny of the majority”. More recent discussions on the relationship between political and economic institutions are thus not new, but have, instead, built upon a secular debate, from which definitive conclusions have not been reached.
Given the broad spectrum of mechanisms underlying these questions, any fruitful analysis must necessarily start by focusing on some of its narrower aspects. In fact, many studies of the economic impact of democratic regimes have examined the relationship between political freedom and policy making. If democratic leaders tend to adopt policies different from those adopted by autocratic counterparts, then there may be a connection between political
1 See Lipset (1959). See Acemoglu et al. (2009) for a dissenting view.
2 See Acemoglu et al. (2019) for an empirical analysis of the effect of democracy on growth.
7
regimes and economic outcomes. In this regard, Meltzer and Richard’s (1981) seminal model of redistribution stands out as one of the most influential theoretical depictions of this potential relationship. This model distinguishes democracies from autocracies by the share of the population voting on policy matters. As democratizations take place, poorer segments of the population gain political voice and, given the model’s assumptions, higher rates of distortionary taxation are chosen to finance a redistribution scheme. Such a result could have deep implications. First, we should expect the size of government, as measured by its expenditures, to increase after a democratization process. Second, if democracies redistribute more, then we should also expect inequality to decrease, ceteris paribus. Other effects could be considered as well. Distortionary taxation weighs on economic growth and therefore democracy could hurt economic development4. If, on the other hand, income is redistributed mainly through the
provision of public goods, the effect on growth could be less clear. At any rate, all these theoretical results rely on the validity of the aforementioned model and, though a logical chain of mechanisms is provided, its underlying assumptions may not necessarily correspond to reality. Moreover, empirical evidence on the topic is not clear either. Despite all the past observed worldwide transitions to democracy and the rising pervasiveness of public spending, we cannot confidently predict whether sudden democratic shocks in dictatorships as diverse as Belarus, Egypt or Brunei would induce higher levels of redistribution in those countries. To be sure, some democratization processes have been associated with increases in redistribution. The extension of voting rights in some Western European nations, such as the United Kingdom, France or Sweden, during the 19th and early 20th century, for instance, preceded the
implementation of redistributive programs. And yet, many empirical analyses tend to report inconclusive results. These studies have often focused on total government spending or revenue, while others disaggregate spending and focus, for example, on public education or social security schemes. Although some exceptions exist, less attention has been given to the impact of democracy on redistribution through the overall public provision of goods and services.
I aim at filling that gap by estimating the effect of democracy on government final consumption for a sample of 191 countries around the world in the period 1960 – 2017. In that respect, I take the 𝑝𝑜𝑙𝑖𝑡𝑦2 continuous measure of democracy from the POLITY IV dataset, as well as a binary indicator from Acemoglu et al. (2019) and estimate a positive impact of democracy on government consumption, using both country and year fixed effects. However,
8
my results lose some significance once I introduce a GMM estimator controlling for the bias that arises in a dynamic panel context with a fixed effects transformation. I also exploit the fact that democratizations tend to occur in regional waves5, by taking an instrumental variable,
denoting regional levels of democracy, to control for the potential endogeneity arising from the democracy variable of interest. Significant results are also not entirely guaranteed once this strategy is implemented. Indeed, although I show some evidence that democratizations lead to higher levels of government consumption, my results should be interpreted with caution, as the theoretical relationship under consideration is not without a few caveats. Maybe democracies are “captured” by wealthy minorities that manage to exert their power over political parties and impose their preferences for lower public consumption. Perhaps voting decisions are mainly guided by ideology and conceptions of fairness rather than individual self-interest. I further discuss these and some other reasons why Meltzer and Richard’s (1981) model might not perfectly describe the redistributive effects of a democratization process in general and the effect of democracy on government consumption in particular.
This thesis is thus organized as follows. In section 2, I survey some of the relevant empirical literature on the effects of democracy on levels of redistribution. In section 3, I present the benchmark model, by Meltzer and Richard, as well as its main assumptions and derive its final result, which is afterwards empirically tested. Section 4 deals with the implemented econometric strategy and, in section 5, a description of all used data and their sources is provided. In the following section, I show the results of my estimation procedures. Then, in section 7, I discuss some of the arguments which could potentially explain why the results of my empirical analysis are not as robust as the model predicts. Finally, section 8 concludes.
Literature Review
I develop an analysis of the relationship between democratizations and government consumption through the lenses of Meltzer and Richard’s (1981) model, which will be described in detail in the following section. Other theoretical models in the literature (see Roberts 1977, Romer 1975) have yielded similar mechanisms and outcomes. In this section, I will instead focus on a body of relevant empirical studies which have shed light on the fiscal policy implications of transitions to democracy.
9
There is, in fact, a vast set of empirical investigations of this relationship using data across different regions and time periods. Different estimation techniques, as well as measures of redistribution have also been employed.
Indeed, many historical studies have, for instance, examined how expansions of political rights in some Western countries in the 19th and early 20th centuries have affected tax policy.
Aidt, Dutta and Loukoianova (2006) and Aidt and Jensen (2009) find a positive and robust effect of suffrage expansion on government size using a sample of, respectively, 12 and 10 Western European nations. However, the former do not tackle endogeneity concerns and the latter’s results fail to remain significant after an instrumental variable strategy is implemented. Aidt and Jensen (2013), on the other hand, find a positive and significant impact on government spending per capita and as a share of GDP for a sample of 8 Western European countries, even after using an instrument, but their overall results are not robust, as the effect on government revenue is not significant.
Scheve and Stasavage (2010, 2012) focus, instead, on the impact of mass warfare on tax policy, but also estimate the role that the expansion of suffrage might have played. In the first study, they find a positive and statistically significant relationship between universal male suffrage and tax progressivity, as measured by top marginal rates of income tax on a group of 8 OECD countries in the period 1900 – 1930. Yet, these results do not hold to a longer-term regression analysis for the same group of countries using pooled OLS estimates for the period 1850 – 1970. In the second study, the existence of competitive elections is also added as a variable of interest, but a significant relationship between political rights and top marginal rates of inheritance taxation is not found for a group of 6 developed nations in the 1816 – 2000 period. The introduction of female suffrage throughout this period has also been analysed as a potential determinant of increases in government size. Lindert (1994) finds that social insurance through government was more favoured in democracies which led the way in providing women with voting rights.
Acemoglu and Robinson (2000) take a different, more qualitative, approach, by showcasing how expansions of suffrage preceded large scale increases of redistribution programmes in Great Britain, France, Germany and Sweden, throughout the 19th and the first
half of the 20th centuries.
An alternative set of studies exploits the high degree of variation of political rights in Latin America during the last decades of the 20th century. These investigations tend to focus
10
not only on the magnitude, but mostly on the different forms of redistribution that democratizations may impact on. In this regard, Huber and Stephens (2012) take a panel dataset of 18 Latin American countries for 1970 – 2007 and use the cumulative number of years each country has been democratic as the variable of interest, to assess the impact of democratic stability in a pooled OLS regression without fixed effects. They find a positive effect on education, healthcare and welfare spending. Interestingly, they also find that education spending is more sensitive to short term changes in political conditions. Kaufman and Segura-Ubiergo (2001) also look at different forms of redistribution, but use a dichotomous measure of democracy instead, as well as a panel correction model controlling for country and year fixed effects. Taking data for 14 Latin American countries in 1973 – 1997, they find a positive effect of democratization on education and healthcare spending and a negative effect on welfare spending.
Other studies, such as Brown and Hunter (1999), examine the interaction between democracy and the level and growth rates of GDP per capita, using a first differences approach for the outcome variable. Taking the same dichotomous measure for democracy, they find a positive impact of democratization on social spending, especially at low levels of income. Additionally, they also find that, unlike democracies, autocracies tend to curtail social spending as GDP growth rates decline.
Other regions are also studied, for example, by Profeta and Scabrosetti (2010). They estimate the impact of democratization not only for Latin American countries, but also taking some Asian and Eastern European nations into account. Considering the 1990 – 2004 period and using pooled OLS regressions, they find a positive and robust effect of democratization on tax revenues and their results hold to region specific analyses. However, their findings for some types of taxation are more ambiguous, as they fail to uncover any significant effect of democracy on social security contributions.
Finally, there are also some studies covering vast groups of countries across all regions in the world, though no definitive results are found either. Acemoglu et al. (2013) take a large dataset of 184 countries from 1960 to 2010 and estimate a positive and significant effect of democratization on tax revenue and total government revenue, whereas Mulligan et al. (2004) do not find significant results when covering a similarly large set of countries. There are a few differences regarding the included countries, the covered time period and the used measures of government size, but the contrasting results are likely to be driven by the different used
11
empirical strategies. Indeed, the former control for country and time fixed effects as well as the dynamics of the dependent variables. The latter, on the other hand, take country averages throughout the considered 1960 – 1990 period and run cross-sectional regressions.
Kammas and Sarantides (2018) use a different approach when measuring redistribution for a sample of 174 countries. Rather than indicators of government spending or revenues, the used outcome variable is given by the difference between market income and disposable income gini coefficients. Thus, this analysis allows for the evaluation of the effective fiscal redistribution generated by democratizations. They find, counterintuitively, that dictatorships have a positive and significant effect on this measure of redistribution. Such a relationship could, arguably, be explained by a higher preference of autocratic leaders for redistribution through cash transfers, rather than through the provision of public goods, which are not accounted for in this measure of redistribution.
Given my focus on government consumption, an additional reference should be made to Mulligan et al. (2004), as this is one of the measures of fiscal policy they consider in their empirical analysis. They do not find a significant effect of democratization on this measure, but their results might be driven by their chosen cross-sectional specification, which does not take country specific factors into account. In the econometric specification section, I describe my empirical strategy and explain why the choices I make for my model may allow for a better depiction of the potential relationship between democracies and public consumption. Anyway, a consensus regarding the hypothesis that democratizations induce higher levels of redistribution is far from being reached, as the divergence of results summarized above can easily attest. Existing data have yielded ambiguous findings and therefore failed to robustly validate Meltzer and Richard’s proposition. Moreover, few of these studies credibly tackle endogeneity issues, making it harder to derive causal interpretations out of their conclusions. In the following section, I describe the benchmark model before testing it empirically later ahead.
Benchmark Model
In this section I introduce Meltzer and Richard’s (1981) seminal study, which shows how, under a set of assumptions on individual behaviour, the form of redistribution and the political process, democratizations would lead to increases in government size. They develop a parsimonious general equilibrium model where a flat tax is imposed on each individual’s labor
12
income and collected funds are redistributed equally over the population via lump sum transfers. The results of the model are not limited to the connection between democracies and redistribution, though I only focus on that aspect.
The first step in understanding Meltzer and Richard’s argument lies on the process through which tax rates are established in the model. Indeed, imposed rates are determined by a voting rule or, in other words, an institutionalized political process. The differences between autocracies and democracies are thus conceptualized, in this framework, by the underlying differences in voting rules. Under autocratic regimes tax policy is determined by a dictator who responds to a small economic elite supporting him, whereas in democracies the model assumes universal suffrage with majority rule. Therefore, a change in the voting rule associated with the democratic transition would imply a change in the politically determined tax rate.
The choices made under each voting rule are those of a decisive voter. Given the unimodality of the policy under vote and assumed majority rule, the median voter will be the decisive voter6. As a democratization process takes the shape of an extension of the franchise
towards the left in the income distribution, i.e. towards poorer segments of the population, the new relevant median voter will be less well-off. This means that the impact of a democratization on the chosen tax rate and therefore on government size can be derived by the relationship between an individual’s income and his preferred tax rate.
In the model, an individual’s earned income 𝑦 is a function of his productivity 𝑥 and the amount of time devoted to labor 𝑛, which depends on productivity itself, as shown below.
𝑦(𝑥) = 𝑥𝑛(𝑥) (1)
There are no savings and thus consumption equals disposable income, which, taking the redistribution process into account, becomes
𝑐(𝑥) = (1 − 𝑡)𝑛𝑥 + 𝑟 (2) , where 𝑟 denotes the lump sum transfer and 𝑡 the tax rate imposed on labor income.
Individuals care not only about consumption, but about leisure as well, and maximize their utility function subject to a constraint on their one-unit time endowment, devoted either to labor or leisure, as follows
13
max
𝑛Є[0,1]𝑈(𝑐, 𝑙) = max𝑛Є[0,1]𝑈[(1 − 𝑡)𝑛𝑥 + 𝑟, 1 − 𝑛] . (3)
The first order condition 0 = 𝜕𝑈
𝜕𝑛 = 𝑈𝑐[(1 − 𝑡)𝑛𝑥 + 𝑟, 1 − 𝑛]𝑥(1 − 𝑡) − 𝑈𝑙[(1 − 𝑡)𝑛𝑥 + 𝑟, 1 − 𝑛] (4) determines the optimal labor choice, 𝑛[𝑟, 𝑥(1 − 𝑡)] that becomes a function of the lump sum transfer and disposable income, which in turn depends on productivity and the tax rate. The utility function is assumed to be strictly concave for both consumption and leisure, thus ensuring that the first order condition derived above yields a maximum7.
There are individuals for whom optimal 𝑛 = 0. From the first order condition we know that those with productivity lower or equal to
𝑥0 = 𝑈𝑙(𝑟, 1)
𝑈𝑐(𝑟, 1)(1 − 𝑡) (5) will prefer not to work and subsist on the transfer 𝑟.
By assumption, both consumption and leisure are normal goods. This can be shown to be sufficient for a unique tax rate equilibrium to exist8. Moreover, it also implies that the tax
rate has a distortionary effect on the choice of labor9. Simply put, as the tax rate increases,
individuals will work less.
When it comes to the political process, each individual prefers his own optimal tax rate. In this regard, the model has two important features. First, the government budget is balanced so that the total amount of collected taxes must fully finance the transfers, as follows.
𝑡𝑦̅ = 𝑟 (6)
Second, individuals take the labor disincentive effect of taxation into account when choosing a tax rate. Collected funds are dependent on total production, which is in turn dependent on labor choices. Since the amount of time devoted to labor is a negative function of the tax rate, so is total production.
7 The second-order condition is given by 𝜕2𝑈
𝜕𝑛2 = 𝐷 = 𝑈𝑐𝑐𝑥2(1 − 𝑡)2− 2𝑈𝑐𝑙𝑥(1 − 𝑡) + 𝑈𝑙𝑙 < 0.
8 See Meltzer and Richard (1981), p.918,919
14
The optimal tax rate is that which maximizes an individual’s disposable income. The decisive voter’s disposable income will be given by
(1 − 𝑡)𝑦𝑑+ 𝑡𝑦̅ (7) , where 𝑦𝑑 denotes his disposable income.
The first order condition will be
𝑦̅ + 𝑡𝜕𝑦̅
𝜕𝑡 − 𝑦𝑑 = 0 (8)
There can be no negative taxes. Moreover, the distortionary effect on labor implies that there is also an upper bound lower than 100% on the chosen rate defined by the preferences of individuals who do not work. Therefore, given the negative sign of the above derivative, the chosen tax rate becomes a negative function of the decisive voter’s income. Besides, the tax rate will be positive, provided the decisive voter is below average income, that is, provided 𝑦𝑑 < 𝑦.
It now becomes straightforward that an enfranchisement of poorer segments of the population would, within this framework, induce a higher equilibrium tax rate. Exceptions to this result would arise if either the new relevant median voter’s income was still equal to or above average income or if the decisive voter was already at subsistence levels in the first place.
The former hypothesis can be dismissed by the overall evidence that income distributions are skewed to the right, which means that the median income lies below mean income. The latter would imply that a large majority of the population subsists on the fruits of labor of a small group of individuals, such that the decisive voter of the economic elite autocratic leaders respond to would not work. That possibility can also be reasonably dismissed. In summary, the presented model illustrates a mechanism whereby expansions of the suffrage would induce increases in redistribution through lump sum transfers. Such a scheme of redistribution is particularly akin to some features of social security systems operating in many countries, but there are many alternative ways by which collected funds can be redistributed. Furthermore, the presented framework only considers taxes on labor income. These results are not restrictive, however. It can in fact be shown that, under a set of additional assumptions, this relationship generalizes to other forms of redistribution. In my empirical analysis, whose underlying strategy is described in the next section, I test whether the proposed mechanism can be expected to apply to redistribution through government consumption.
15
Econometric Specification
I introduce a partial adjustment model, similar to others in the relevant literature (see Aidt, Dutta and Loukoianova, 2006; Aidt and Jensen, 2013), aimed at testing the hypothesis that democratization processes induce increases in public consumption. Such a specification guarantees an identification of both the short and the long run effects, by including a lag of the outcome variable on the right-hand side. Aidt and Jensen (2013) justify their choice by referring to the high degree of persistence in the evolution of the size of government, the likely reason being “that fiscal commitments and institutions carry over from one year to the next”. The inclusion of first-order lags attempts to control for this phenomenon and allow for the estimated impact of democracy to be spread out over time. To this end, consider the model:
𝑌𝑖𝑡 = 𝜌𝑌𝑖𝑡−1+ 𝛽𝐷𝑖𝑡−1+ 𝑋′
𝑖𝑡−1𝛾 + 𝜑𝑖 + 𝜇𝑡+ 𝜀𝑖𝑡 (9)
, where the subscripts 𝑖 and 𝑡 index, respectively, each country and year. The dependent variable 𝑌𝑖𝑡 accounts for government final consumption as a share of GDP, whereas the 𝑌𝑖𝑡−1 right-hand
side variable denotes its one-year lag. The variable of interest, given by 𝐷𝑖𝑡−1, will be the one-year lagged level of democracy. The same econometric procedure will be applied using both a binary and a continuous measure of democracy, described in more detail in the next chapter.
Furthermore, a vector of control variables, represented by 𝑋′𝑖𝑡−1, encompasses other potential determinants of government consumption outlined in the relevant literature. Economic development, as measured by GDP per capita, is included following Wagner’s Law (Wagner, 1883), which predicts that as countries become increasingly richer and more industrialized, the demand for public goods rises more than proportionately to income, implying them to be luxury goods. Urbanization is pointed out as one of the facets of such processes and could also drive the demand for the public provision of goods and services. Demographic trends, and particularly population growth, are likely to impact on government size as well. Lindert (1994) finds a positive relationship between an aging population and social spending. The share of young citizens could also influence public consumption, especially the expenditure on education. Three variables are included on the right-hand side, in order to capture these potential effects. In addition, Rodrik (1998) finds a positive relationship between trade openness and government size, as public spending would play “a risk-reducing role in economies exposed to a significant amount of external risk”. Hence, a measure of trade openness is included too.
16
There are two reasons for all controls to be lagged one year, as pointed out by Brown and Hunter (1999). First, policy outcomes are usually based on past economic and social developments. Second, it ensures a clearer direction of causality. Indeed, the potential existence of a reverse mechanism, whereby government consumption would influence democracy as well as some of my other controls, could lead to biased and inconsistent estimates. Thus, using lagged values for the independent variables ascertains a higher degree of confidence in my results. Finally, 𝜑𝑖 and 𝜇𝑡 account for, respectively, country and year dummies, while 𝜀𝑖𝑡 denotes the error term, which captures all other omitted factors.
One of the problems with the partial adjustment model in this case is the necessity of imposing assumptions on the number of years it should take for the first impact of democratizations to be felt. I initially consider one-year lags for all regressors, but Acemoglu et al. (2013), for instance, take 5-year lags and consider one observation per country every 5 years, as they assume the effects of democratic institutions “not to appear instantaneously or not even in one or two years”. However, such a strategy has the drawback of substantially reducing the number of observations. An alternative would be to take averages, but, as Acemoglu et al. (2013) rightfully point out, that approach would “introduce a complex pattern of serial correlation, making consistent estimation more difficult”. Indeed, the time span over which the causal mechanism I estimate should arise is not clear. For that reason, I also replicate the same strategy taking 5-years lags instead and check whether the assumptions imposed on the number of years significantly alter my results. The sample is, for these cases, split into 12 periods, starting in 1962 and ending in 2017.
Another concern could arise from the existence of communist dictatorships, especially in the former Eastern Europe bloc. In those regimes, high levels of government consumption would probably not be due to the electoral base underlying policy choices but to the economic system itself. As a result, the mechanism I estimate could be severely confounded. Nonetheless, this should not be a major problem, as no data on government consumption is available for these countries prior to their democratization. This means my regressions do not take into account these countries’ within variations of democracy.
A few other caveats underlie this empirical strategy and therefore some considerations should be made. Meltzer and Richards (1981) propose a mechanism under which the expansion of the voting franchise towards poorer segments of the population would necessarily imply that the new relevant median voter would be relatively less well-off. Under a set of assumptions
17
described in chapter 2, this would translate into a political equilibrium associated with a higher imposed tax rate. Simply put, there would be a ceteris paribus relationship between expansions of political power and levels of redistribution. Under the hypothesis I test, this mechanism would take the shape of a positive causal effect of the democracy variable on government final consumption, hence implying a positive estimated 𝛽. However, democratizations might impact on the public provision of goods and services through channels other than that proposed in my benchmark model. In fact, an extensive and not unambiguous literature focuses on the relationship between democracy and economic development, with diverging results. Acemoglu et al. (2019), for instance, estimate a positive and significant effect of democratization on economic growth, while Barro (1996) finds a weakly negative relationship. Since I control for the log of GDP per capita and other variables potentially correlated with democracy, it could be argued that this strategy suffers from a “bad control” problem. Nevertheless, the aim of my empirical analysis is to estimate the direct causal effect of democratization on government consumption as predicted by Meltzer and Richard. My results will, thus, not necessarily imply that a more complex combination of causal mechanisms, with different public consumption outcomes, does not exist.
Furthermore, omitted variables which we do not observe might also influence my dependent variables and be correlated with democracy. There are likely to be considerable institutional and cultural differences between democracies and autocracies, potentially biasing my results. The inclusion of country dummies, i.e. the use of country fixed effects aims at controlling for all time invariant determinants of government size by exploiting within country variations. Likewise, global shocks in specific time periods might have had a generalized impact on government consumption and, therefore, I also control for time fixed effects.
Throughout the implementation of this strategy the sequential exogeneity condition is assumed to hold, such that
𝐸[𝜀𝑖𝑡|𝑌𝑖𝑡−1, 𝐷𝑖𝑡−1, 𝑋′
𝑖𝑡−1, 𝜑𝑖, 𝜇𝑡] = 0. (10)
However, applying fixed effects when taking lagged dependent variables generates a bias (see Nickel, 1981) and renders my estimator inconsistent. Indeed, for finite 𝑇 samples, the dynamic fixed effects estimator does not satisfy the sequential exogeneity assumption, because the time-demeaning operation will imply that the lagged dependent variable regressor in the transformed model encodes information from the dependent variable. The latter is, in turn, mechanically correlated with the error term. It can nonetheless be shown that this bias
18
converges towards 1
𝑇 (Nickel, 1981). Even though Judson and Owen (1999) show that the bias
is negligible for panels with 𝑇 larger than 20, which is the case for half of my empirical analysis, I still implement one of the potential solutions for this issue. Following Holtz-Eakin et al. (1988) and Arellano and Bond (1991), I introduce a standard GMM estimator for dynamic panel models. In this context, two possibilities for removing fixed effects arise: first differencing or forward orthogonal deviations. I prefer the latter, because it preserves the sample size in panels with gaps. This chosen transformation assumes the following shape:
𝑤𝑖𝑡𝑓𝑜𝑑 = √ 𝑇𝑖𝑡 𝑇𝑖𝑡+1(𝑤𝑖𝑡 − 1 𝑇∑ 𝑤𝑖𝑠 𝑠>𝑡 ) (11)
, where, for all variables, the mean of future observations for each country is subtracted from each observation. Also, 𝑇𝑖𝑡 denotes the number of times 𝑤𝑖𝑠 appears in the sample for 𝑠 > 𝑡. This strategy, first proposed by Arellano and Bover (1995), naturally removes all time invariant factors, as intended. Yet, an endogeneity issue remains, as the lagged dependent variable is still correlated with the error term, given that both encode information from future observations. In this case, however, the problem can be solved by using lagged values of the dependent variable in levels as instruments (Arellano and Bond, 1991). Indeed, second and further lags could be used as instruments for the lagged dependent variable, but, since the number of instruments is quadratic in 𝑇, such a strategy would probably induce a “too many instruments” bias (Newey and Windmeijer, 2009). For that reason, I collapse the instruments set and take a GMM estimator of my dynamic panel model.
So far, few considerations have been made regarding the hypothesis that democracy might be endogenous, under which the above condition would not be satisfied and my estimator would be inconsistent, even after controlling for the bias that results from the fixed effects operation in a dynamic panel model. Taking lags of democracy rather than contemporaneous information partially tackles this issue. However, it is not a sufficiently credible solution, given the persistence of government consumption and, therefore, the likeliness that even lagged levels of democracy might be correlated with the error term. Indeed, endogeneity could arise for several reasons. There could be a reverse mechanism, by which government consumption would influence the probability a country becomes democratic. Levels of democracy could also be correlated with time-varying omitted factors that the fixed effects transformation does not control for. In addition, measurement errors in the measures of democracy could trigger endogeneity concerns as well. Therefore, I also implement an instrumental variables strategy,
19
by taking a widely used instrument from the relevant literature. To this end, I exploit the fact that democratizations tend to occur in regional waves (Huntington, 1991) and my instrumental variable 𝑍𝑖𝑡 for each country/year, taken from Acemoglu et al. (2019), is given by
𝑍𝑖𝑡 = 1 𝑁𝑟𝑖𝑛𝑖𝑡 − 1 ∑ 𝐷𝑖′𝑡 𝑖′∈𝑟,𝐷 𝑖′𝑖𝑛𝑖𝑡=𝐷𝑖𝑖𝑛𝑖𝑡,𝑖′≠𝑖 (12)
, where 𝑟 denotes each of the seven considered regions, 𝐷𝑖𝑖𝑛𝑖𝑡 is a dummy variable indicating
whether a country was democratic (𝐷𝑖𝑖𝑛𝑖𝑡 = 1) or nondemocratic (𝐷𝑖𝑖𝑛𝑖𝑡 = 0) at the beginning of my sample and 𝑁𝑖𝑖𝑛𝑖𝑡 is the number of countries in that region sharing the same initial regime type with country 𝑖. This construction conditions on regional democratic capital among countries sharing the same initial regime type because a rising demand for democracy is expected to spread to other nondemocracies in the region and, conversely, a rising demand for autocracy is assumed to spread to other democracies.
This measure is, as predicted, positively correlated with national levels of democracy but the instrument’s validity is still dependent on the extent to which regional democracy is not correlated with each country’s public consumption via other factors. In other words, regional democracy should affect government consumption only through its effect on each country’s level of democracy, such that the instrument’s exogeneity condition is satisfied. Two lags, rather than just one lag, of this variable are used, so that tests for overidentifying restrictions can be performed. The necessary condition becomes
𝐸[𝜀𝑖𝑡|𝑌𝑖𝑡−1, 𝑍𝑖𝑡−1, 𝑍𝑖𝑡−2𝑋′𝑖𝑡−1, 𝜑𝑖, 𝜇𝑡] = 0 (13)
Finally, throughout the implementation of my empirical strategy, I relax the assumption of no serial correlation of the error term within each country by taking standard errors clustered at the country level.
Data
I construct a panel comprising 191 countries for the 1960-2017 period. However, this panel dataset is unbalanced, as there are missing observations for some variables. To capture the level of democracy, I use two different measures: the continuous 𝑝𝑜𝑙𝑖𝑡𝑦2 indicator, retrieved from the POLITY IV dataset, and a binary variable developed by Acemoglu et al. (2019), in an extension of Papaioannou and Siorounis’ (2008) indicator. The former, ranging from -10 (full autocracy) to 10 (full democracy) takes a set of political institutions into account
20
in the definition of each nation’s level of democracy: the presence of mechanisms through which citizens can express preferences about alternative policies and leaders; the openness of executive recruitment; the existence of institutionalized executive constraints on the exercise of power and the guarantee of civil liberties to all citizens in their daily lives and in acts of political participation. It is therefore an account of the features most commonly attributed to well-functioning democracies.
The binary variable, henceforth denoted 𝑑𝑒𝑚𝑜𝑐, scores 1 for democracies and 0 for autocracies, by combining the 𝑝𝑜𝑙𝑖𝑡𝑦2 score with the Freedom House’s trichotomous indicator, to reduce measurement error. Freedom House codes countries as “Free”, “Partially Free” or “Not free” and my binary measure assigns a democratic coding to each country when they are considered “Free” or “Partially Free” and their 𝑝𝑜𝑙𝑖𝑡𝑦2 score is positive. In addition, two different binary measures, from Cheibub, Ghandi and Vreeland (2010) and Boix, Miller and Rosato (2012), are also employed in this variable’s construction whenever the 𝑝𝑜𝑙𝑖𝑡𝑦2 or the Freedom House scores are missing. These supplementary indicators are particularly important for the period prior to 1972, for which there are no Freedom House observations. A full description of the used algorithm can be consulted in the Appendix.
The motivation behind the implementation of Acemoglu et al.’s (2019) extended measure lies on their consideration of reversals from democracy. Indeed, Papaioannou and Siorounis (2008) only code permanent transitions to democracy. This approach has the drawback of potentially triggering endogeneity issues in the sense that the return of a recently democratized nation back to autocracy might be related to other outcomes present in my empirical analysis. In particular, the stability of a democracy in that context might be dependent on pursued public policies. Thus, only accounting for permanent transitions would probably exacerbate issues of reverse causality and aggravate the risk of biased estimation.
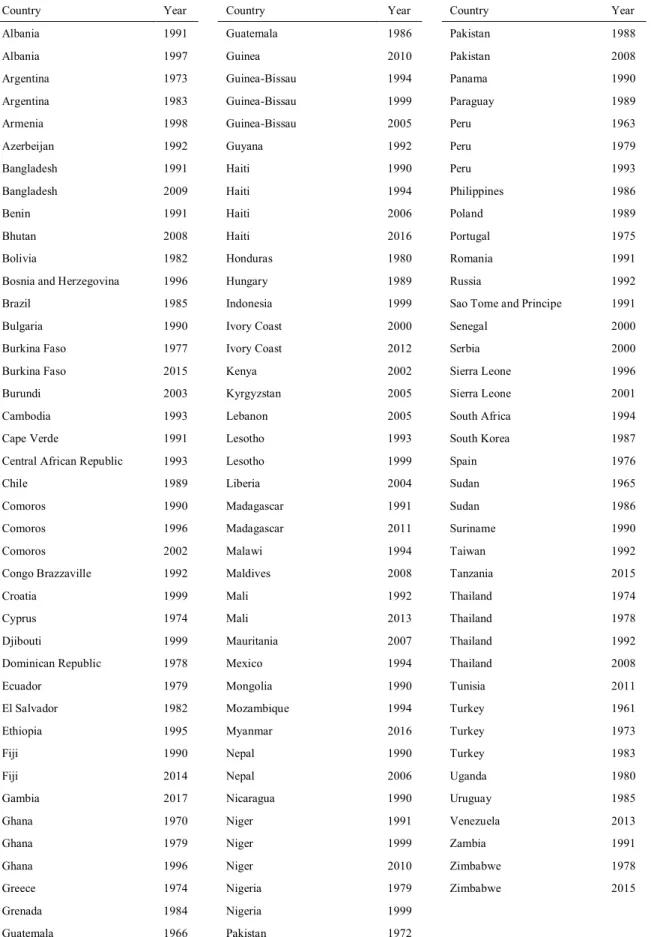
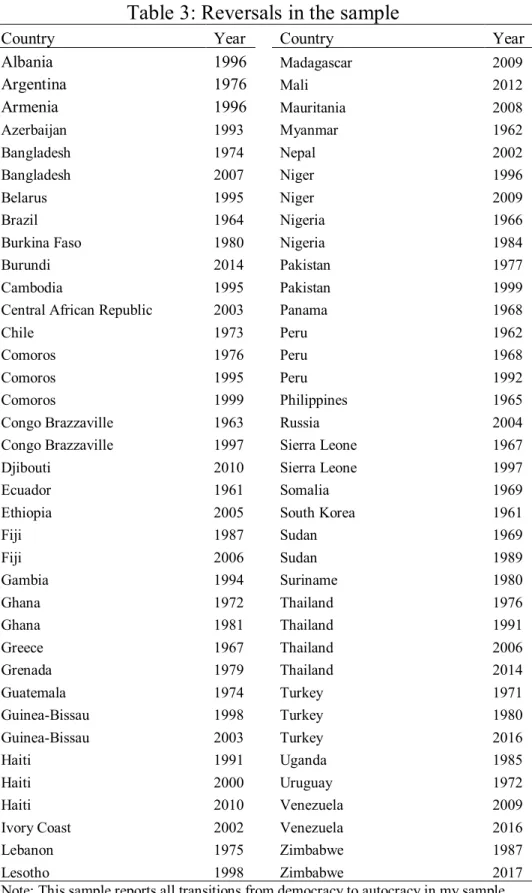
In brief, the binary 𝑑𝑒𝑚𝑜𝑐 indicator of democracy is present for 191 countries and the continuous 𝑝𝑜𝑙𝑖𝑡𝑦2 measure is available for 164. There are 9406 country/year observations in the sample for the former measure, whereas the latter is observed 8273 times. The binary construct, specifically, codes countries as democratic for 4889 observations and nondemocratic for 4517, with 121 observed transitions to and 74 reversals from democracy. All these transition processes are recorded in Tables 2 and 3. Additional descriptive statistics for the binary variable of democracy are also shown, including over time variation of average democracy in the world or by region (Figures 1 and 2).
21
All other variables included in my analysis were retrieved from the World Development Indicators dataset, which collects its figures from a wide list of sources. All those original sources are reported, for each variable, in the Appendix (Table A1).
Government final consumption, which will be the outcome variable in my regression analyses, includes all government current expenditures for purchases of goods and services (including compensation of employees). It also includes most expenditures on national defence and security but excludes military expenditures that are part of capital formation.
Control variables include GDP per capita at constant 2010 US$, total population, share of the population aged 14 or less, share of the population aged 65 or above, share of the population living in urban areas and a measure of trade openness, given by the sum of exports and imports (% GDP). Urban areas in the corresponding variable are defined by national statistics offices, but the collection process conducted by the United Nations Population Division, which is the original source, guarantees comparability of results.
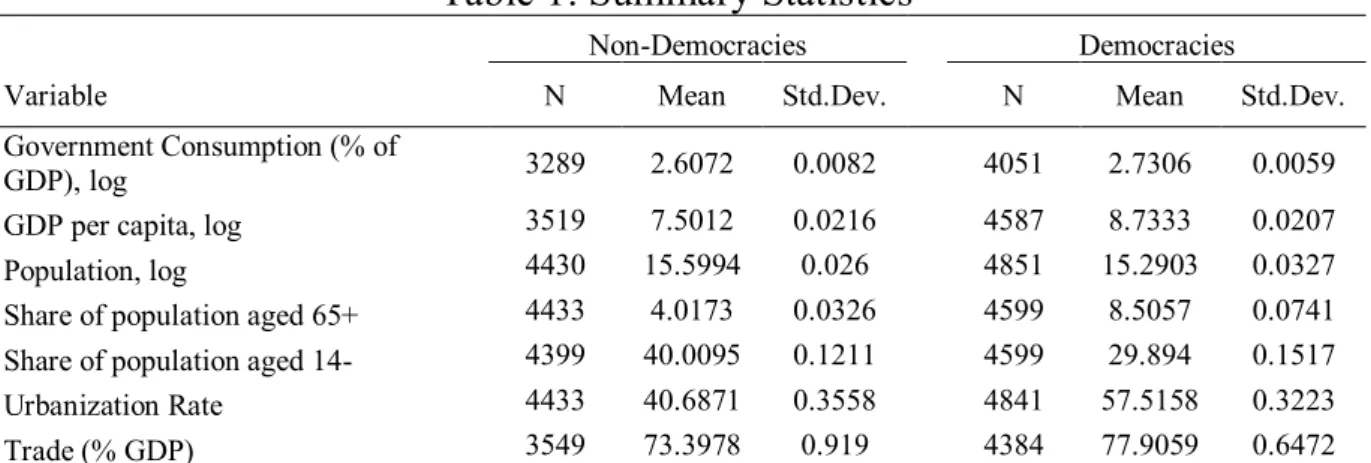
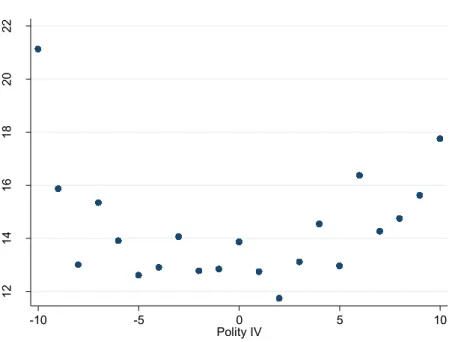
Descriptive statistics for all considered variables are shown in Table 1, separated for democracies and nondemocracies, so that patterns can be examined. In addition, I also plot the relationship between government consumption and levels of democracy for both the binary and the continuous measures, in Figures 3 and 4. Interestingly, though a clear pattern is not found for the binary indicator, a U shaped relationship arises once the continuous measure is plotted against government consumption. It must be noted that the highest average levels of government consumption are reported for the two extreme scenarios of political freedom. In particular, and counterintuitively considering my benchmark model, extreme dictatorships record the highest level. This could imply that political stability might be an important determinant of government consumption.
Results
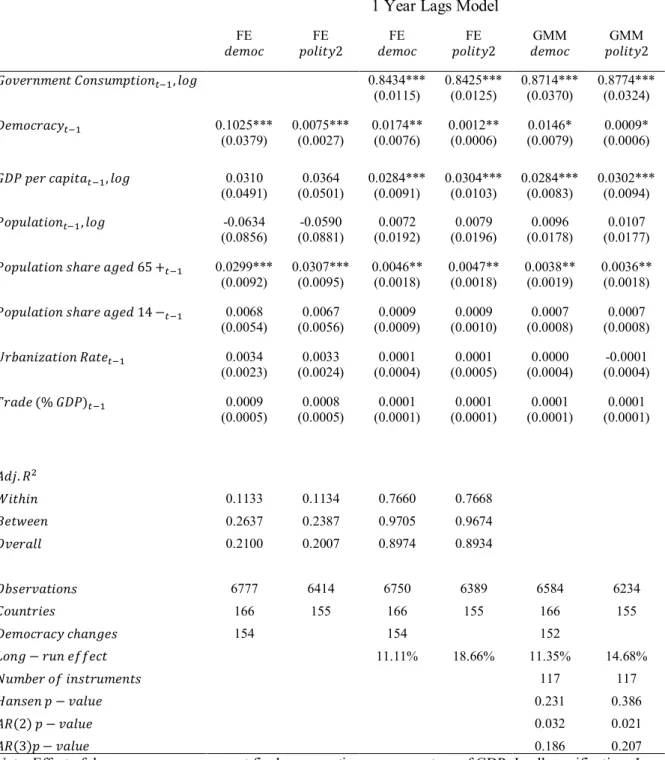
Baseline results are reported in Table 4 and Table 5, which contain the estimates of my partial adjustment model for, respectively, the 1-year and 5-years lags specifications. In the first two columns of each table, the model is estimated by imposing the coefficient on the lagged dependent variable to be equal to zero (𝜌 = 0). Even though this represents a departure from the assumed existence of dynamics in the evolution of public consumption, it is still a good starting point to assess the effect of democracy. These first estimates seem to validate the hypothesis that transitions to democracy induce increases in the share of government
22
consumption on GDP. Indeed, the coefficients associated with both the binary 𝑑𝑒𝑚𝑜𝑐 and the continuous 𝑝𝑜𝑙𝑖𝑡𝑦2 variables are positive and significant at the 1% level, regardless of whether 1-year or 5-years lags are considered. Once the persistence of the dependent variable is controlled for by relaxing the assumption that 𝜌 = 0, as in columns 3 and 4 of each table, democracy retains its significance, though only at the 5% level. Also, the estimate of 𝜌 is always significantly different from zero, confirming the assumption of a strong persistence on government consumption. This specification allows for the effect of the independent variables on the outcome variable to be spread out over time and, in addition, guarantees the quantification of the long-run effect by setting 𝑌𝑖𝑡 = 𝑌𝑖𝑡−1, i.e. by imposing that the outcome variable reaches a steady state level. The long-run impact of a democratization is thus given by
𝛽
1 − 𝜌. (14)
Under the 1-year lags specification, democracy is estimated to generate a 11.11% increase in the share of government consumption on GDP over the long-run. Although the dependent variable is always denoted as a percentage, this effect is still given in relative terms rather than percentage points, since logs were taken. The long-term impact of democracy is estimated to be slightly lower, of 9.32%, in the alternative 5-years lags specification. Long-run effects for the continuous variable of democracy are calculated by assuming drastic changes to democracy, from -10 to 10. Hence, estimated coefficients for the 𝑝𝑜𝑙𝑖𝑡𝑦2 variable are multiplied by 20 before entering the long-run expression presented above. Switches from 0 to 1 in the 𝑑𝑒𝑚𝑜𝑐 measure do not necessarily describe democratic transitions as radical as those associated with a move from one extreme to the other in the 𝑝𝑜𝑙𝑖𝑡𝑦2 indicator. As a result, the potential long-run positive impact on public consumption should not be as strong either. My reports confirm this intuition, as all estimated long-run effects for the continuous variable are higher than those for the binary one in the corresponding specification. In the 1-year lag model, this impact is estimated to be of 18.66%, whereas in the 5-years lags one, the estimate amounts to 13.11%.
These first estimates provide some evidence for the hypothesis I test. However, dynamic panel models tend to be biased when fixed effects are used, as discussed before. Indeed, for panels with finite 𝑇, the time demeaning transformation generates a mechanical negative bias on the estimate of the coefficient associated with the lagged dependent variable. This bias is larger for lower 𝑇. Hence, it becomes a major concern in the 5 years lags model, where only 12 periods are considered, but it may also be non-negligible in the other specification. For that reason, columns 5 and 6 of each table report results of a GMM estimator where the variables
23
are transformed by taking forward orthogonal deviations. Second and further lags of the dependent variable in levels are used as instruments for the endogenous variable, which is the transformed first lag on the right-hand side. As mentioned earlier, this estimator is biased and consistent, as long as the used instruments are valid, that is, as long as the instruments are guaranteed not to be correlated with the transformed error term. Since second and further lags in levels could be taken as instruments, the satisfaction of that condition requires no second order serial correlation of the error term in differences. That seems to be the case for the 5-years lags model but not for the 1-year lag one. Yet, the 𝐴𝑅(3) test in Table 4 suggests that there is no third order serial correlation in the differenced residuals in the latter and therefore third and further lags are used in that model. Besides, the Hansen p-value of the test for overidentifying restrictions passes comfortably for all cases, ensuring a higher confidence on the exogeneity of my instruments.
The estimates for the coefficients of the lagged dependent variable that result from this GMM estimator are, as anticipated given the negative bias, higher than those from the standard OLS estimator using country and year fixed effects. It should also be noted that the difference between estimates is considerably larger in the 5-years lags model, where the number of time periods was lower and therefore the expected bias was more pronounced. The estimated coefficients for democracy, on the other hand, are smaller and less significant. Even though these estimates retain significance, albeit at the 10% level, the results suggest that earlier evidence for the hypothesized positive effect of democracy on government consumption could be, to some extent, driven by the failure to model the dynamics of the latter and by the Nickel bias arising from the inclusion of a lag.
Moreover, among the set of control variables, only per capita GDP and the share of the population aged 65+ tend to show a positive and significant effect, as predicted, though not consistently across specifications. The latter, particularly, seems not to be significant in the 5-years lags specification once dynamics and the Nickel bias are controlled for.
The fit of the model is not very strong either. Total adjusted 𝑅2𝑠 tend to be considerable
in the dynamic specifications, standing at around 90% and 55% in the 1-year and 5-years lags models, respectively. However, these values are artificially boosted by the inclusion of the lagged dependent variable. Once the lag is removed, the set of regressors tends to explain roughly 20% of the variation in government final consumption.
24
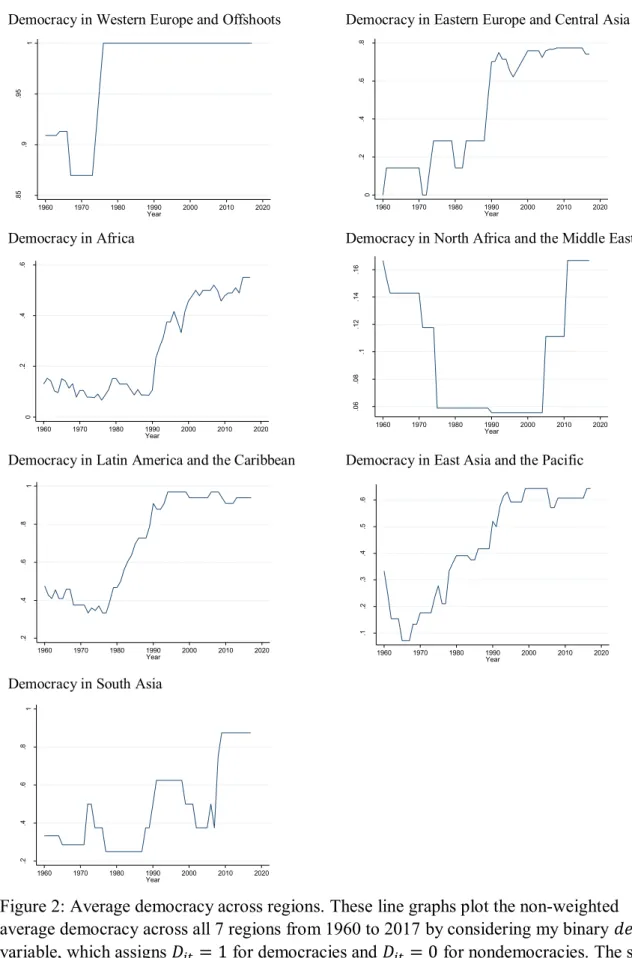
The fact that the outcome variable is to great extent explained by variables not included in my regressions raises the concern that, if lagged democracy is correlated with some of those variables, my estimators will be biased and inconsistent. Indeed, although time-invariant determinants of government consumption are ruled out once fixed effects are controlled for, other time-varying factors captured by the error term might be correlated with my variable of interest. Furthermore, as noted earlier, there may also be a reverse mechanism of causality whereby public consumption impacts on the stability of a democratic regime or on the probability that democratization processes take place. Under this scenario, my democracy variable would also be correlated with the error term, undermining the consistency of my estimators. Results reported in Table 6 and Table 7 are derived by implementing my instrumental variables strategy aimed at tackling this issue.
This strategy is carried out without the implementation of a GMM estimator correcting for the Nickel bias. As stressed out before, an inclusion of lags of the dependent variable when controlling for fixed effects induces a mechanical bias on the estimates. However, if in addition to the lagged levels of the dependent variable necessary to render the GMM estimator unbiased and consistent, new instruments for my variable of interest were also considered, the resulting estimates would be too sensitive to specification choices. Conclusions based on such an estimator would hardly be reliable. Therefore, I implement my two-stage least squares strategy, taking both the one and the two periods lags of the level of regional democracy as instruments, and compare the results with those earlier derived from the standard OLS within-estimator. This procedure allows for testing whether the initially estimated positive effect of democracy on government consumption was mainly due to the existence of endogeneity on the former.
In Tables 6 and 7, it is possible to check that all estimated coefficients on democracy but those for the 1-year lags model with no lagged dependent variable are higher than the coefficients estimated without an instrument. Significance levels are generally retained, with a just mentioned exception. Also, the estimated long-run effects of a switch to democracy are substantially higher, at around 30% and 48% for, respectively, the 𝑑𝑒𝑚𝑜𝑐 and 𝑝𝑜𝑙𝑖𝑡𝑦2 variables. Even though not entirely robust, these results suggest that there was a downward bias on the OLS estimation of the impact of a transition to democracy on public consumption, which means that democracy might have been negatively correlated with the error term. A plausible explanation for this relationship could be the aforementioned issue of reverse causality. Indeed, if lower levels of government consumption generate popular discontent towards an autocratic regime, the probability of a coup and therefore of a transition to democracy could increase.
25
Given the potential existence of within-country serial correlation, those past low levels of the error term might persist even after the democratization process, such that the sequential exogeneity assumption does not hold. It could be argued that a similar pattern of low government consumption might generate discontent towards democratic regimes, increasing the chances of a change to nondemocracy. If that was the case, the final effect on the correlation between democracy and the error term could be null. Yet, my sample has more switches to democracy than the converse. In the OLS regression with a lagged dependent variable, there are, for instance, 95 observed democratizations and 59 observed reversals to nondemocracy. Thus, this bias is likely to be more pronounced for the former cases10.
These results must still be interpreted with caution as they rely on the assumption that regional democratic trends are not correlated with national levels of public consumption. Democracy waves could, however, be related to region-wide trends in the public provision of goods and services. At any rate, my 2SLS results suggest that should not be the case. All tests for overidentifying restrictions fail to reject the null hypothesis by a large margin. There also seems not to be an issue of weak instruments, which could jeopardize my instrumental variables strategy, as all F statistics for the excluded instruments on the first stage regressions pass the commonly used threshold of 10.
Throughout my empirical analysis, heteroskedasticity and serial correlation should not be a problem either. As mentioned before, the assumption that the errors are 𝑖. 𝑖. 𝑑. is relaxed to allow for serial correlation at the country level, by using clustered standard errors. Correlations among observations for the same time period could be confidently ruled out as well, because year fixed effects were applied in all my regressions and any time specific factors weighing on government consumption should be captured by the year dummies. Finally, the number of observations and considered countries are reported in all cases. The number of observed changes, either from autocracy to democracy or conversely, is also reported for all regressions where the 𝑑𝑒𝑚𝑜𝑐 measure is used.
Though not robust, these results depart from those of Mulligan et al. (2004) and provide some evidence for the positive relationship between democracy and government consumption, as posited by Meltzer and Richard. This discrepancy can best be explained by the different used
10 Given the time demeaning operation, all countries which remain democratic or nondemocratic throughout the
whole sample period will be assigned a value of zero for all observations of their democracy variable. Thus, for those countries, there will not be a distinction between democracies and nondemocracies in their correlations with the error term.
26
specifications. By controlling for country and year fixed effects, I rule out potential determinants of government consumption which could be confounding the tested mechanism. Besides, I take the dynamics of government consumption into account, while Mulligan et al. (2004) do not. In the Appendix (Table A2) I report a replication of my estimations taking sample averages for each variable and running cross-sectional OLS regressions. My results become highly ambiguous. In addition, I also run regressions similar to those from Tables 4 and 5, but using a pooled OLS specification instead. In these cases, whose results are reported in Tables A3 and A4, democracy is estimated to have a negative and significant effect on government consumption.
However, the positive impact of democracy on public consumption that I estimate is not as robust as, for instance, the results derived by Acemoglu et al. (2013) in their estimation of the effect of democracy on measures of taxation revenue or total government revenue. Indeed, not all my estimated coefficients are significant at the 1% level. Also, results become less significant once the Nickel bias is controlled for using a GMM estimator. In chapter 3, I outlined the main features underlying Meltzer and Richard’s argument. In the next section, I point out some of the reasons why this model might not display a perfect description of the actual relationship between democratization processes and government consumption.
Theoretical Considerations
The results generated by the benchmark model of Meltzer and Richard are dependent on a set of assumptions on the political process, the scheme of redistribution and individual preferences. Thus, if some of these assumptions fail do hold, democratization processes might not lead to increases in the size of government. My estimates of the effect of democracy on redistribution through government consumption are not entirely robust, which could be explained precisely by the failure of some of those conditions to be met. Throughout this section I draw on the relevant literature to expose some of the reasons why that could be the case.
The starting point in the theoretical argument lies on the conceptualization of democracy as opposed to nondemocracy. Indeed, one of the basic premises of the model is that autocratic leaders only respond to a small minority which stands at the extreme right of the income distribution, i.e. to a wealthy elite. Democratic leaders, on the other hand, would have to respond to the whole population. While this depiction seems to conform to the general aspects associated with voting rules under both regime types, it also fails to set the distinction between
27
de jure and de facto political power. In the benchmark model, the political processes under both voting rules are such that in democracies political power is more widespread. This sort of power, derived from existing political institutions, is defined as de jure political power. However, in a more primitive sense, political power comes from “what a group can do to other groups and the society at large by using force” (Acemoglu and Robinson, 2006). This is commonly referred to as de facto political power. In the considered framework, it is not as clear which groups de facto political power truly belongs to under each voting rule. Although the wealthy minority, which is against redistribution, is assumed to hold political power under nondemocracies, dictators may still answer the political demands of the poor majority out of fear of a coup. If the majority has the power to expropriate resources or even set the path for a revolution and therefore replace the existing regime and its leader, it may indeed hold political power.11 In this scenario, there might not be actual voting rule differences between both types
of regimes and politically determined levels of redistribution could be similar under both democracy and nondemocracy.
Conversely, the assumption that the voting rule in a democratic context allows for a more widespread distribution of political power is based on the existence of elections, which indirectly determine policy decisions, whereby all individuals in the income distribution are only assigned one vote. Simply put, everyone holds the same de jure political power. Yet, de facto political power in these circumstances might not be as equally distributed as the model presumes. In fact, democracy may be “captured” or “constrained” by an organized minority which, according to Acemoglu and Robinson (2008), has an incentive to invest in order to retain its de facto power when relative de jure power is lost. This stronger incentive accruing to the elite arises from its small number of members and higher expected returns from controlling policy making. In other words, following this underlying argument, the distribution of de facto political power is an equilibrium outcome. Under these circumstances, there are many ways through which the elite could keep holding a disproportionate share of de facto political power. Lobbying and bribery are examples of means by which the party system can be controlled by the elite. Capital flight or tax evasion are other forms of de facto power. The aforementioned threat of a coup could also exist in this case, as long as the elite is able to determine military interventions. Hence, though democratizations may enfranchise poorer segments of the population, stronger incentives for the investment in de facto political power may imply that
28
policy decisions will remain subject to the preferences of the elite. As a result, democratizations constrained by such phenomena may not necessarily induce increases of redistribution.
Another potential divergence between the model and the actual political process under democracies lies on the existence of voting costs, which are not accounted for in Meltzer and Richard’s framework. If, as assumed, agents do not incur in any costs by exercising their right to vote, all eligible voters will participate in elections and thus the median voter is also the agent with the median income. However, voter turnout rates are never equal to 100%. For that reason, it is plausible that voting is costly or that some agents are indifferent to election outcomes. In addition, empirical studies in political participation have shown that the probability an agent votes is positively correlated with his income (see Verba et al. 1995). This implies that the median voter may be wealthier than the agent with the median income, leading to levels of redistribution lower than those arising in a context where there are no voting costs.
The arguments presented so far have dealt with the assumptions regarding the distribution of political power and the incentives to exercise it. Yet, even in the absence of a departure from these conditions, other aspects of the political process in the model may not be consistent with reality. One of the most important assumptions is that the policy decision under vote is unidimensional: each agent only chooses the tax rate which will be imposed on labor income in order to finance a lump sum transfer. This is clearly a large stretch from the complex and multidimensional set of policies that are politically determined in a democracy. In fact, each vote should capture preferences regarding multiple policy choices (eg spending on education, spending on healthcare, existence of a minimum wage, legal abortion, legal same-sex marriage). Once a set of choices of this kind is considered, the median voter model becomes no longer applicable. Thus, the higher the relative importance of political decisions related to policy choices other than the level of redistribution, the less likely are democratizations to generate increases in government consumption.
Also, the configuration of the redistribution scheme can have implications for the benchmark model’s results. In the considered framework, a lump sum transfer is equally distributed throughout the population. However, redistribution can be targeted such that not all agents receive the same amount. This issue is particularly relevant for redistribution through the provision of goods and services, which is at the core of my empirical analysis. Certain types of public spending might be regressive in the sense that richer segments of the population tend to be disproportionately benefitted (eg expenditure on the provision of cultural activities or
29
higher education). Given the potential regressive nature of these “Sheriff of Nottingham” types of redistribution, poor agents might prefer lower levels of government consumption. If, on the other hand, democracy is “captured” by the elite, the effect of the regime transition on overall government consumption could become less clear.
Finally, the assumptions on individual preferences may also significantly diverge from how voters make political decisions. In particular, the model ignores the role of ideology in the preferences for certain policies. Alesina, Glaeser and Sacerdote (2001), for instance, show that racial heterogeneity and animosity play a key role in explaining the differences in the size of the welfare state in the US when compared to European countries.
Expectations about future income, which are also ignored by the static benchmark model, may determine individual preferences as well, in very different ways. Alesina and Ferrara (2005) provide evidence that expectations of upward mobility are associated with less support for redistribution. In addition, social mobility is closely connected to the just mentioned role of ideology, as it tends to intensify the belief that poorness is the result of laziness. Hence, preferences for redistribution should be lower in societies where income is highly perceived to result from individual merit. Nevertheless, income uncertainty might also impact on preferences in the opposite way. If the perceived risk of future income shocks and risk aversion are high, agents may want to rely on redistribution as an insurance mechanism, an idea which can be interpreted as a variation of Rawls’ (1971) argument. In brief, policy preferences are certainly guided by expectations about future outcomes, but the relationship between those expectations and desired levels of redistribution is not theoretically clear. At any rate, the failure of the benchmark model to take forward looking behaviour into account is another reason why it may not perfectly describe the political process.
Some of the limitations of Meltzer and Richard’s (1981) model to depict the effect of democracy on redistribution, in general, and government consumption, in particular, have been put forth throughout this section, but other issues have been left out. A more comprehensive examination of the caveats underlying the equilibrium choices for redistribution can be consulted, for instance, in Putterman (1996). Dynamic models of policy choices have not been considered either. In that regard, Krusell, Ríos-Rull and Quadrini (1997), Krusell and Ríos-Rull (1999), Hassler et al. (2003), Battaglini and Coate (2008) are examples of a growing literature on the topic.