1
Expenditure Policy in Angola: Impact on
Economic Development and Inequality
Albertina da Rosa Delgado
152211011 Advisor:
Professor Isabel Horta Correia Professor Pedro Rapouso
Dissertation submitted in partial fulfillment of requirements for the degree of MSc in Economics, at the Universidade Católica Portuguesa
i
Acknowledgements
I would like to express my gratitude to everyone that has directly or indirectly contributed for this master thesis, firstly I thank God for giving me strength and courage to be able to finish this master especially in the most difficult moments of my life. Secondly my appreciation and thanks to my Professor Isabel Horta Correia for being my advisor, and giving me support and courage. My heartfelt gratitude also goes to my family (brothers and parents) for believing in me, for the trust and for being with me in all moments of my life.
I also cannot forget, Nadia Couto and Patricio Neto for providing me with some data, Elsa Shichilenge for correcting the text; Professor Pedro Raposo for the support with the first difference model and panel model, Professor Alves da Rocha; Professor Filipe Rafael and Professor Teresa Lloyd Braga for kindly providing their support, all members of the Catholic University of Angola for conceding me the scholarship to do the master; Francisco Paulo for all support, for believing in me, even when I had doubts of myself; to my colleagues at Fundação Open Society, for the support, especially Sizaltina Cutaia, Elias Isaac, for the hard work of doing my duties while I was in Lisbon and Katila Pinto de Andrade for correcting the executive summary in Portuguese.
I cannot forget the help that I get from Vera Daves, Mara Almeida, Bruno Grilo, Vanessa Grilo, Marco Paulo, Maria Raimundo, Rosa Guerra, Dorivaldo Pedro, Dilson Gaspar, Abel Canivete, Eliana Matondo, Emilio Londa, Amália Quintão Barbosa, Victor Chia, Precioso Domingos, Berta Cahango, Dalvin Pipa, Martinho Bangula, many others that I did not cite but are in my heart, thank you for everything.
ii
Abstract
Government Expenditure (GE) is an instrument by which the State distributes resources with efficiency and responsibility. Several studies have analysed the relationship between GE and economic growth, as well as the relationship between inequality and GE by region. Studies in Africa have found a positive relationship between education and health spending with respect to economic growth, which means that the greater public investment in education and health, the greater the economic growth.
In order to investigate these relationships for the Angolan case, we used the data available of the period from 1991 to 2011. This dissertation analysed the impact of different types of GE on economic growth. It was found the GE is not moving towards equilibrium of economic growth, therefore we do not have causality between different types of GE and economic growth.
After this analysis of the effects of aggregate sectorial GE on the GDP growth rate of Angola we tried to understand the regional impact of GE. We concluded that the distribution policy across provincial GE is a vector that does not help to solve the inequality of income and consumption in the country. It happens that, in per capita terms, 17 of the 18 provinces receive 66% of the total funds allocated, while Luanda receives 34% of these funds. The relationship between inequality, poverty and GE is negative, which shows that the higher the per capita GE, the lower is inequality and poverty. The major challenge for the country is going through a better allocation of GE resources, in order to increase economic growth and to reduce poverty and inequality.
iii
Sumário Executivo
Tema da Dissertação: Política Orçamental em Angola: Impacto no Crescimento Económico e
na Desigualdade
O Orçamento Geral do Estado (OGE) é o instrumento pelo qual o Estado distribui os recursos com eficiência e responsabilidade. Diversos trabalhos têm vindo a analisar a relação entre a despesa orçamental e o crescimento económico, bem como a relação entre a desigualdade e as despesas do orçamentais por região. Estudos realizados em África encontraram uma relação positiva entre as despesas de educação e saúde no crescimento económico, o que quer dizer que quanto maior for o investimento público em educação e saúde, maior é o crescimento económico.
A fim de investigar estas relações, para o caso de Angola, foi utilizado dados disponíveis de 1991-2011. Nesta dissertação analisou-se o impacto de diferentes despesas orçamentais sobre o crescimento económico. Constatou-se que as despesas orçamentais não se movem em direção ao equilíbrio do crescimento económico, logo não encontramos causa efeito entre os diferentes tipos de despesas orçamentais e o crescimento económico.
Esta dissertação concluiu que a política de distribuição do orçamento das províncias é um vector que não ajuda a resolver a desigualdade de rendimento e consumo no país. Sucede que, em termos per capita, 17 das 18 províncias recebem apenas 30% do total dos fundos alocados, enquanto Luanda recebe 70% destes fundos. A relação entre a desigualdade, pobreza e as despesas per capita do orçamento é negativa, o que demonstra que quanto maior for a despesa per capita menor é a desigualdade e a pobreza. O grande desafio para o país passa por uma melhor distribuição dos recursos do Orçamento Geral do Estado, a fim para se aumentar o crescimento económico e reduzir a pobreza e a desigualdade.
iv
Index
Contents
Acknowledgements ... i
Abstract ... ii
Sumário Executivo ... iii
1. Introduction ... 1
2. Literature Review ... 3
2.1 Importance of Government Expenditure on Growth ... 3
Effect of Public Spending in Economic Development ... 4
Effect of Public Spending on Education, Health and Agriculture ... 5
Impact of Defense and Security Expenditures on Economic Growth ... 6
2.2 Effects of Corruption in Public Spending ... 7
2.3 Inequality and Government Expenditure ... 8
3. The Angolan Economy ... 9
3.1 Briefing of the Angolan Economy ... 9
3.2 Expenditure Policy in Angola ... 12
4. Composition of Expenditure ... 14
4.1 Revenues ... 14
4.2 Expenditure: The sectorial decomposition ... 15
Social Expenditure ... 17
Non Social Expenditure ... 20
4.3- SADC Social Expenditure ... 20
5. Did government expenditure composition affect growth in Angola? ... 22
5.1 Methodology ... 22
5.2 Data Report ... 23
5.3 Estimation of Model 1: Angola Loto Specification ... 24
5.4 Estimation of Model 2: Some Sub Saharan Africa (SSA) Countries ... 25
5.5 Estimation of Model 3: Panel for Some SSA countries ... 27
5.6- Results interpretation ... 28
6. How important were government expenditure to inequality and poverty in Angola? ... 29
6.1 Spatial distribution of Expenditure and inequality ... 30
v
6.3 Government expenditure and poverty per region ... 38
7. Conclusion ... 42 8. Bibliography ... 44 9. Appendix ... 49 Acronyms ... 49 Figure Index ... 49 Table Index ... 50
Section A: Expenditure decomposition ... 51
Sectorial expenditure during financial crisis ... 54
SADC health expenditure ... 55
Section B: Explanation of tests and indicators ... 56
a) Lag selection criteria test ... 56
b) Augmented Dickey-Fuller test ... 56
c) Johansen test for cointegration ... 57
d) Gini index ... 58
Section C: Pre-estimation tests ... 58
a) Lag selection criteria test ... 58
b) Augmented Dickey-Fuller test ... 59
c) Test for cointegration ... 60
d) Multicollinearity test ... 60
Section D: Post-estimation tests ... 61
a) Test if residuals are normally distributed ... 61
b) Test if residuals heteroskedasticity ... 61
1
1. Introduction
The Government Expenditure (GE) is the main policy instrument with which resources gathered by the State from the economy, in an adequate and suitable way, should be distributed with responsibility, proficiently and successfully. Due to its importance, many studies and several papers have analysed the impact of GE in economic growth, as well as its impact on poverty and inequality. For example Loto, 2011; Muinelo and Roca-Sagalés, 2011; Ohwofasa, Obeh and Atumah, 2012; Maitra and Mukhopadhyay, 2012; Musaba and Matchaya, 2013 have exposed the importance of GE in the economic growth and in the reduction of income inequality. Some of those studies have established that there is a positive relationship between e GE in education and health in economic growth and that better distribution of public funds can help diminishing income inequality and poverty. In this work we intend to see whether we can answer the following research questions: does productive GE such as, education, health, transport and agriculture any impact on economic growth? What is the relation of regional GE distribution with poverty and inequality? This is two separated questions and we will develop them separately.
The way tacked to answer to the first question was done first by using a methodology following Loto’s model for Nigeria, and after expanding this analysis to different ways of using available data. The main difference of this study is that it follows a case study on Angola, and also that the main data is related with GE execution and not with the GE plan. Since there is no built database with those variables, part of the work was to construct a database of executed GE which was therefore used for the all analysis. The study analyses also data from IBEP, which has the most updated data on social economic conditions of Angola.
In context of Africa, countries that are very dependent on mineral resources (oil and diamonds) are highly exposed to shocks of international market prices that have impact on total revenue with consequences amount of resources which can be used for public investment or for others type of GE.
2 When compared to other SADC countries, Angola’s GE on education and health is lower in average in the SADC region, measured as a percentage of GDP. The country still has a lot of social problems mainly derived by lack of transparency of management of public goods, and also because it still gives a lot of importance to military and security spending than investing more in the sectors of education and health.
Because I have working with economic justice and GE transparency in the services delivery area for over the past 6 years, a study worked on in 2010 about socio inequalities in Southern Africa has been the greatest motivation for this work, therefore inspiring the main cause of this thesis which is analysing the impact of GE in economic growth, inequality and poverty in Angola.
We found that the GE is not moving towards equilibrium of economic growth, therefore we do not have causality between different types of GE and economic growth. The relationship between inequality, poverty and GE is negative, which shows that the higher the per capita GE, the lower inequality and poverty.
3
2. Literature Review
The analyses of appropriate theoretical and empirical literature will offer better understanding of a specific causal effect on the GEdynamics and, therefore will contribute for building of theoretical support for the empirical evidence in this study.
A large debate in economics have been endured over the past decade, about the relationship between GE and economic development, there are many studies that measure economic development as economic growth, and execute the causal effect analysis using disaggregate GE and its impact on economic growth. The existing literature is well-documented thus it will be not discussed too long.
2.1 Importance of Government Expenditure on Growth
GE Policy is one of the greatest strategies in control market economy one reason is the correction of market imperfections. GE as a whole, or items like health and education, can increase people’s productivity and therefore could have an impact on their income, and future development. Sometimes, GE seems to be a good tool to inspire investment in a determinant industry, for example by giving fiscal incentives for companies that make investments in the determined area, (see Rocha), (2012).
Governments should aim to make the best use of GE in order to achieve social benefits for society. This best use is in order to increase the welfare in the society by increasing efficiency, decreasing poverty and income inequality. Through GE it is possible implement the redistribution of income in order to improve the social condition of the poor people; these programs may include free basic services such as housing, community services and health care, which for sure can expand the living condition of poor people, (see Muchena and Jauch), (2011).
For productive sectors such as agriculture, transport, industry energy, exports, can have a great impact on economic growth, (see Daves, Delgado, Rocha),(2012).Given the importance of GE in promoting sustainable development, it’s extremely important that governments create effective GE polices, in order to promote positive impact on income, employment and sustainable growth.
4
Effect of Public Spending in Economic Development
Adam Smith defends that the GEGE should be applied in life security, infrastructure, preservation of law and others. Alternatively, other economists argue that GEGE in some sectors of the economy is necessary to stimulate economic development. This issue has been critical in many developing economies that need to finance different areas in order to achieve regional and rural development. GE on education and infrastructure are important to increase the speed of development,(see Uma, Eboh and Nwaka),(2013).
The economic theory in the correlation between GE and economic growth diverges. Keynes theory states that increasing GEGE has a direct impact on aggregate demand, and this impact can lead to recovering fast economic growth, while Wagner’s has an alternative vision to explain positive correlation between growth and GE, by assuming that if national income increases, it will cause an increase in GE (Bataineh, 2012). Barro’s theory emphasizes that GE on industrious activities and investments can have a positive impact on economic growth, but government consumption GE can lead to negative impact on growth see reference in (Loto, 2011).
In the past years, several empirical studies to measure the impact of GEGE on economic growth have taken place. Lim (1983) analyzed the impact of government recurrent GE on economic growth. He used a group of 54 less developed countries, from 1965 up to 1973. The result was that the GE ratios had negative and significant relations with the government recurrent spending, but this only applied to a smaller number of Less Developed Countries, therefore there is strong evidence of high instability in recurrent spending in that period. However, there is no evidence that economic growth depending on recurrent GE.
Cooray (2009) applied an econometric model that examines the impact of GE in economic growth, by using a neoclassical production function, in a cross-sectorial study of association among economic growth and GEin 71 countries; the final results demonstrated that collectively, size and government quality positively influence economic growth in the observed countries.
The effect of GE on economic growth in Jordan has been analyzed by Al Bataineh (2012). He used a period from 1990 to 2010. The output of this study was that GE at collective level has a direct and positive effect on the growth of GDP.
5
Effect of Public Spending on Education, Health and Agriculture
GE is frequently classified into productive and unproductive spending. This classification means that productive spending has a positive impact on economic growth whereas unproductive spending has no effect on economic growth. GEon health and education is seen as a productive expending which plays a role in the economy, because the social returns might produce an outcome in the reconstruction with strong human capital see for details (Maitra and Mukhopadhyay, 2012).
Overall, the impact of GE on economic growth is diversifying. Fan and Rao, (2003) develop an empirical evidence in Africa on the GEon agriculture and health, was strong to promote economic growth, in Asia the spending on education, military and agriculture had direct impact on growth effects. Yet, the investment in health of all types in Latin America was insignificant. In Asia and America the program of structural adjustment has stimulated growth while in Africa, it did not.
A study done by Haouas and Yagoubi (2005) to analyze the impact of openness and human capital as sources of productivity growth in the Middle East and North Africa economies by using the fixed effect and a panel data for 16 countries and a period of 1965 to 2000, concludes that human capital has significant impact on economic growth. Maitra and Mukhopadhyay (2012) study the impact of GEon education and health sectors in gross domestic product of 12 countries in Asia and Pacific, by analysing data from 1981-2011. The result was that education GE has increased the GDP in nine countries1, while health spending only has a positive impact in five countries2. Therefore, the main conclusion is that the influence of education and health GE in economic growth is not the same in all countries of Asia and Pacific. Loening (2002) analyses the effect of human capital on economic growth in Guatemala, by applying an error correction methodology, resulting in two diverse channels where human capital is predicable to have a positive effect on growth, the main outcome is that educated labour force seems to have a direct and significant effect on economic growth considering evolution of productivity factor as per accumulation factor.
1 Namely: Bangladesh, Fiji, Kiribati, Maldives, Nepal, Singapore, Sri Lanka, Tonga and Vanuatu. 2 Bangladesh, Nepal, the Philippines, Singapore and Sri Lanka
6 Bose, Hanque and Osbon (2003), have examined the growth impact of GE for a panel data of 30 development countries, during the years of 1970 to 1980, with special emphasis on sectorial spending. The results powerfully defend the predominant view of the modern growth model, that education has influence on economic development. Additionally, the study proposes that collective current spending has no impact on growth while capital spending has a direct impact. Ohwofasa, Obeh and Atumah, (2012) also studied Nigeria, but only analyzing the education spending in economic growth, with a data from 1986 to 2011. The study also uses the econometric technique and tests. The main result points to a positive effect on economic growth in Nigeria. Musaba and Matchaya, (2013) investigated the effect of sectorial GE in Malawi during 1980 to 2007. By applying cointegration analysis, the results present that in the short-term there is no substantial link among sectorial spending and economic growth, while in the long run, outcomes present that there is a significant and direct relation between agriculture spending and economic growth, but that education has a negative impact on growth in Malawi.
Impact of Defense and Security Expenditures on Economic Growth
Military expenses may have a negative effect on economic growth by reducing investment spending, due to the fact that higher military GE may result in inaccurate resource distribution and the change of resources from industrial activities which are productive in the increase of private munitions and preservation of large military services (Khilji and Mahmood, 1997). Collier (2006) studied the impact of military spending on development. He concluded that military GE has a negative effect on development therefore he strongly suggests that it is necessary to reduce this GE in order to use this part of resources to increase growth.
Abu-Bader and Abu-Quar (2003) support Wagner’s Law. They used multivariate cointegration and variance disintegration methods to analyze the impact of GEon economic growth for 3 countries3 , in different periods. The outcome was a negative long-term relationship among the two variables. This study has concluded that military GE has a negative impact on GDP, while civilian spending GE has a positive effect on economic growth in Egypt and Israel.
7 Loto (2011), wich is the staudy thet we will use as benchmark for our first research question studied the consequence of GEon economic growth in Nigeria from 1980 to 2008, through a specific emphasis on function spending, which includes health, agriculture, transport and communication, education and security. She performed tests for stationarity and cointegration. The main results show that in the short-term the GE in agriculture and education has a negative influence on growth, while the GE on health seems to have a positive relationship with economic growth. Another conclusion was that it is possible that education and agriculture expenses have a positive impact in the long-term.
2.2 Effects of Corruption in Public Spending
Ehrlich and Lui (1999) defends that corruption can affect the way that GE affect growth and can lead to a negative impact on human source investment, such as education, and a positive impact of military GE . Other authors like Tanzi and Davoodi (1997) argue that when corruption is very high it may lead to a misrepresented GE structure, due to the fact that corrupt public employees are more ready to approve new investments in construction of projects instead of keeping the existing ones.
In some empirical studies the phenomenon of corruption has also been added as a factor that also influences the impact of GEGE on economic growth. Tanzi and Davoodi (1997) investigated the impact of corruption on economic growth and public investment. The main conclusion was that corruption can reduce growth by increasing public investment that is not complemented with an increase in recurrent current GE, by reducing the quality of existing infrastructure and by lowering government revenues that are important to fund productive sectors.
Wu, Tang and Lin (2010) performed a study of the casual effect of GEGE and economic growth, by doing the panel Granger causality test, by dividing between OECD and non-OECD countries and also by high and low corruption level. The outcome was that after disaggregation of countries by income rank and level of corruption, the results endorsed the bi-direction effect among public activities and economic growth for all diverse countries with expectation to the low income countries. This study has as well advised that different results for the low income countries are probably due to their ineffective government and poor public institutions.
8
2.3 Inequality and Government Expenditure
Inequality is a difficult word, and it is often used in association with a quantity of obstinate social and economic difficulties.
The causes for social inequality can diverge. It can arise over accepting suitable gender roles, or through unfair legislation. This kind of inequality happens among cultural or spiritual clusters, classes and countries creating the notion of social inequality, a worldwide phenomenon.
Even if economic inequality cause diverse from social inequality, the two are related. Economic inequality denotes to differences in the delivery of economic resources and income; social inequality occurs due to the absence of wealth in determinates zones that in certain areas excludes individuals to get the same opportunity of housing, health care, education, basic services, as the rich, in societies wherever the access to these social goods depends on fortune.
Rodriguez (1999) studied the purpose of the reallocation polices in a political economy model through rent-seeking and political impact. In his study, higher inequality explains an increased portion of public funds accumulating to persons who are in a situation to influence politicians. Therefore, if rent-seeking is the key limitation to growth, the model can justify for the experimental opposite correlation among growth and inequality.
Benabou (2000) run a stochastic model to investigate if more income is linked with less relocation on GE. He concludes that, with affirmative externalities to better distribution, reallocation polices drop with inequality and the inferior rate of reallocation increases inequality of upcoming income due to wealth constraints on investment in development capital.
On the empirical evidence, Fan, Zahang and Zhang (2002) shows that the effect of GEon agriculture growth, rural poverty and regional inequality is influenced by the type of GE. They apply provincial level of data from a period of 1970 to 1997 through an econometric model that tracks down the impacts of GE by different channels. The main conclusion was that, to influence the rural poverty in order to promote rural growth to the government needs to invest not only on agriculture but also on infrastructure and education. Another
9 conclusion was also that the GE in education has a huge effect on decreasing rural poverty and regional inequality.
Mello and Tiongson (2003) developed a work about the relation of income inequality and public GE. They did a cross-country analysis and discovered that countries that spend less on redistribution of GE are the ones with a high level of income inequalities.
Muinelo and Roca-Sagalés (2011) have analysed diverse tools of GE policies on economic growth along with income inequality, by doing a panel data of 43 countries and organizing it by high, middle and low income during 1972 up to 2006. The outcome proposes that an increase of GEby current spending and direct taxes reduces economic growth, as well as inequality. This study supports the possibility of having fiscal policies that grow according to the size of government intervention by indirect taxes in order to fund public investments, which can increase growth while promoting the reduction of inequality in the economy.
3. The Angolan Economy
3.1 Briefing of the Angolan EconomyAngola is a country with a large reserve of oil and diamonds; however the fragile governance and the consequences of the war harshly obstructed the sustainable development of the country (USAID, 2008).
Like other countries in Africa, Angola has an economy highly dependent on mineral resources. It is the second oil producer country in Africa after Nigeria, with a production of 1.9 million barrels per day. The high economic growth in the past six years was mainly due to high international oil prices and to the discovery of oil fields. There are expectations that the GDP growth achieves the rate of 7.1% in 2013, s driven by the beginning of the production of liquefied Natural Gas, Africa Economic Outlook (2012).
10
Figure 1: Growth of GDP
Source: World Bank data
As can be seen in the figure 1, the boom of economic growth stared in 2002, with the end of civil war. In 2007 Angola had the highest growth in the world, been 23%. But the country is failing to transform this economic boom in a sustainable development. It is possible that one reason for that is the bad distribution of the oil revenue, and also the corruption around the country (Global Witness and Open Society, 2011).
As shown in figure 2, the economic growth in Angola has almost the same trend as the evolution of the oil prices. Being oil dependent, the additional economic activities have an insignificant share of general economic growth and export profits, although other economic sectors call for job creation.
-25 -20 -15 -10 -5 0 5 10 15 20 25 19 91 19 92 19 93 19 94 19 95 19 96 19 97 19 98 19 99 20 00 20 01 20 02 20 03 20 04 20 05 20 06 20 07 20 08 20 09 20 10 20 11 -1.2 -6.90 -24.70 3.50 10.40 11.20 7.90 6.80 3.24 3.01 3.14 14.49 3.31 11.18 18.26 20.74 22.59 13.82 2.41 3.41 3.92 GDP Growth (%)
11
Figure 2: Relation between growth and oil prices
Source: World Bank data, http://www.ioga.com/Special/crudeoil_Hist.htm
Inflation rate has been declining; in 2010 it was 15.3 %, and in 2012 it dropped to 9%. The general trend of inflation is descending because the high percentage of imported food in the consumer basket motivates the National Bank to control nominal exchange rate in order to diminish trend inflation (World Bank, 2013).
Fiscal sustainability and economic growth are both very dependent on the oil revenue, constraining the diversification of the economy and the need for job creation. While poverty is around 36% of the population, GE to social services was around 30% of the total GE in 2011 (Africa Economic Outlook, 2012).
The unemployment rate has been declining since 2002 due to different factors, which include the definitive resettlement of people who were displaced in the coastal cities, the positive behavior of the private sector and the rehabilitation and modernization of the physical infrastructure of the country. The unemployment rate was around 40% in 2000, and in 2012 was 26.5% (CEIC, 2013). -40 -20 0 20 40 60 80 100 120 19 91 19 92 19 93 19 94 19 95 19 96 19 97 19 98 19 99 20 00 20 01 20 02 20 03 20 04 20 05 20 06 20 07 20 08 20 09 20 10 20 11 Prices in USD GDP Growth (%)
12
3.2 Expenditure Policy in Angola History and Legal Framework
The Ministry of Finance was only structured in 1991 with the commencement of the organization of the GE using a system of management which has been improved since 1991. The first step for the improvement of organization of the public finances started with the law 9/97 of October 1997, which was the GE Framework Law, and has since undergone improvements. Because of the late organization of the Angolan GE, there is no data available before 1991 (see Ministry of Finance), (2006).
The country continues to have the same outline of a country that lived many years of war, because the percentage of GE to defense and security is still very high. The amount spent on those sectors hurt other sectors such as health and education (see Amundsen, Isaken and Wiig), (2007).
From 1991 until 2000 more than 10 macroeconomic programs were announced altogether with very weak results. The explanations for these poor implementation policies were various, including an enduring lack of fiscal discipline, weakness of the exchange rate, as well as the disposition of excessive concentration in the planning system. In the year 1990, the high fiscal deficits similarly had negative impacts on the process of reducing the inflation rate. Later in 2002, with the end of war, the public finance modernization program was implemented, by the Ministry of Finance. Only in 2003 was there a breakthrough characterized through the first effort by the Government to legalize its additional‐GE and quasi‐fiscal GE, and include it as a part of national GE (see World Bank), (2006).
The new GE framework has changed with the implementation of the new Constitutional Law in 2010. This new Constitutional Law reinforces the GE policy as a very important tool for the government to the application of public policies. In the past, the GE was decided together with the National Plan, (see Jensen and Paulo), (2011).
Now GE is part of the national plan and a tool of the central government and grounded in the economic policies. This is a significant change, because before the GE was undermining the economic policies.
13
Expenditure Process
The Angolan GE plan represents only the government proposal which is not the amount of that has really been implemented. The GE structure has been a reflection of the Angolan history, civil war and main economic oscillations. Recurrent and capital spending is shared between the Planning and Finance Ministries. Those Ministries are extremely political and therefore have a direct impact on income and health distribution to the society (see Amundsen, Isaken and Wiig), (2007).
The GE decision process has six stages namely; the creation of an overall macroeconomic context which includes the macroeconomic forecasts and overall announcements of government policy; the distribution of total incomes through Ministries, local governments and independent institutions by a certain criteria; the circulation of directives to all the structures of public sector that will be executing the National GE; the demonstration of suggestions by the Ministries, Local Governments and other executing units of the GE GEs essential to execute the economic, defence, and social, government aims; the discussion around modifications of the GE distributions among the Finance Ministry and the units. At this stage, the political heaviness of the departments and other liable GE units may be significant for the alteration of the portions primarily distributed by the Finance Ministry. However, it would be great if alterations are defensible based on the commitment with county social needs. The last stage is building of GE suggestion to be submitted to the Presidency of Republic and later on to the National assemble for approval (see Daves, Delgado and Rocha), _(2012).
14
4. Composition of Expenditure
In this section, before beginning to describe the composition of GE we give a small briefing regarding the revenue side of the budget, because the main objective of this thesis is the impact of GE analysis especially the sectorial GEE. GE
4.1 Revenues
The main faintness in the administration of public financial policies is the weak macroeconomic background and particularly the problems of the Executive in exactly forecasting for oil revenues, which represents more than 80% of total revenues.
The major revenue came from taxes especially the tax revenue from the oil sector, because the price of oil has been increasing and the production in the country also increased significantly after 2002. The fiscal structure in Angola is dominated by oil tax in about 77% on average in 15 years from 1997 to 2011. Fluctuations in international oil markets are directly and indirectly felt in the national GE, pledging to carry out certain public investment GEs structural economic growth. This unhealthy dependence on GE price and global demand for oil complicates the financial programming and the country's economy, (see Daves, Delgado & Rocha), (2013).
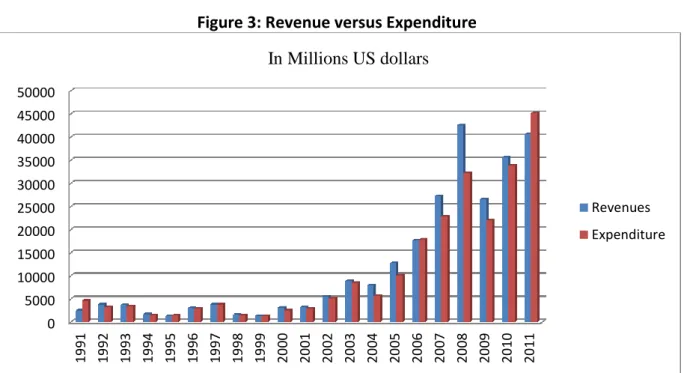
Figure 3: Revenue versus Expenditure
Source: Finance Ministry, 2006; Daves, Delgado & Rocha 2013
0 5000 10000 15000 20000 25000 30000 35000 40000 45000 50000 19 91 19 92 19 93 19 94 19 95 19 96 19 97 19 98 19 99 20 00 20 01 20 02 20 03 20 04 20 05 20 06 20 07 20 08 20 09 20 10 20 11 In Millions US dollars Revenues Expenditure
15 As shown in figure 3, between 1993 and 2003 the revenue was almost equal to the total GE. After 2003, the total revenue exceeds the total GE and it remains in the same situation until 2010. Only in 2011 does the total GE exceed the revenue, one justification for that can be the preparation of the 2012 elections making it necessary to implement public investment in order to secure the public’s votes.
4.2 Expenditure: The sectorial decomposition4
One can distinguish two phases of analysis of GE in Angola: before April 2002, period ending in the end of civil war, and after this date. Before, the rule of war was imposed on the organization of the national GE, not just in terms of options as to thread the satisfaction of collective needs and in relation to political interference in its execution reflected in the traffic of influence exercised on the staff from the Ministry of Finance. After 2002, as a consequence of being much more difficult to justify the disruption by major disorder and military conflict, also as a result of improved management and technical capacity of greater political acceptance of a normal GE, GEGE began to behave in a different way, for example it was reduced to an acceptable limit, calling extra- GE, (see Daves, Delgado & Rocha), (2013). In 1991 the share of education and health represents 25% of the total GE, while defence and national security had 36.9% of the total GE5, by this period; it was justified because the country was in civil war, and it was necessary to allocate such an amount of the GE. Even after the end of the war, education still has less GE than military expenses, and it can be seen in the same table. It is clear that defence still has a lot of importance for the government, while education and health continues to have a smaller share than military expenses.
We could divide GE into two types: social and non-social. This division makes sense since we think that social GE has productive components like education and health that could contribute positively to GDP growth and at the same time reducing inequality and poverty, while the contribution of non-social GE with includes also non productive sector like
4
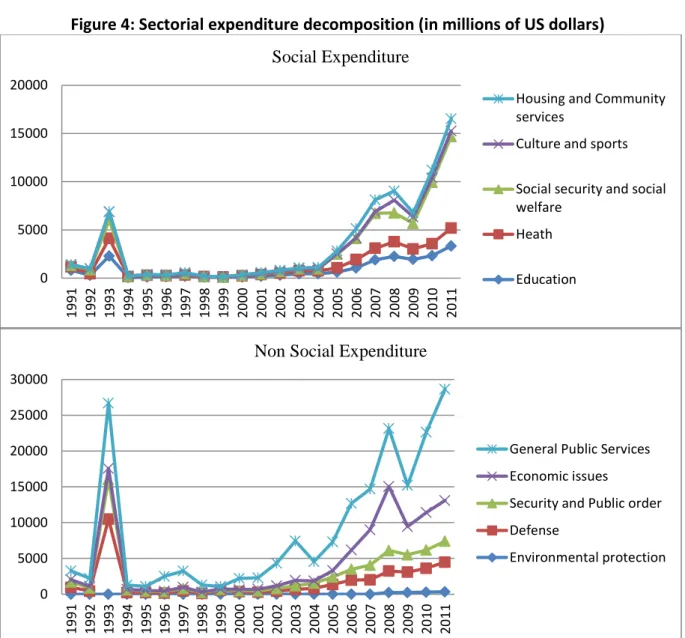
The Angolan sectorial expenditure accounts for 10 sectors namely; education, health, social security and social welfare, culture and sports, housing and community services, environmental protection, defence, national security, economic issues and general public services.
16 defence, and some productive sector that can promote economic growth is but for inequality is more ambiguous.
Figure 4: Sectorial expenditure decomposition (in millions of US dollars)
Source: Own calculation with data from Finance Ministry
It’s interesting to see that the trend of both the social GE and the non-social GE are almost the same; the general public services have the high amount of the GE, followed by the economic issues GE. Analysing the GE after the end of the war in 2003, the total GE was 8 billion US dollars, this amount was distributed around in the following manner: 9% for GEs regarding economic issues, followed by the general public sector which accounted for 65%, education accounted for 5%, health 3%; defence 8%; 6% for public security; 3% for social protection and 1% for housing and community services.
0 5000 10000 15000 20000 19 91 19 92 19 93 19 94 19 95 19 96 19 97 19 98 19 99 20 00 20 01 20 02 20 03 20 04 20 05 20 06 20 07 20 08 20 09 20 10 20 11 Social Expenditure
Housing and Community services
Culture and sports Social security and social welfare Heath Education 0 5000 10000 15000 20000 25000 30000 19 91 19 92 19 93 19 94 19 95 19 96 19 97 19 98 19 99 20 00 20 01 20 02 20 03 20 04 20 05 20 06 20 07 20 08 20 09 20 10 20 11
Non Social Expenditure
General Public Services Economic issues
Security and Public order Defense
17
Table 1: Variation of Sectorial Expenditure (in millions of US dollars)
Expenditure Categories 1991-1997 1997-2003 2003-2009 Total expenditure -837.94 4694.51 13464.96
Education -622.39 270.3 1479.55
Health -211.79 152.22 800.29
Social security and social welfare -18.7 78.22 2432.01
Culture and sports -52.96 6.16 639.78
Housing and Community services 90.95 -12.61 329.99
Environmental protection 0 0 233.66
Defence -503.61 205.55 2195.38
Security and Public order -430.2 184.95 1902.35
Economic issues -121.12 556.1 3186.72
General Public Services 1031.86 3253.62 265.24
Source: Own calculation with data from Finance Ministry
From 2003 to 2009 the total reduction was more than 4 billion US dollars. During the same period, the highest increase was in GE on general public services which was more than 3 billion US dollars, defence and security and public order collectively increased by 390 million US dollars, while education and health increased by approximately 2 billion. Something that should also be noted is that social protection and welfare had an increase of 2 billion US dollars.
Social Expenditure6
The social sectors in Angola are education, health, social protection and housing and community services. The social sectors are an important measurement of strategies for the reallocation of wealth and can be a substitute tool for the allocation of incomes and consequently, for community and regional interrelation and consistency. The State is the player that must perform the leadership role in dealing with these sectors, together as a straight service provider and as manager and main sponsor, ensuring that these services are delivered in an adequate amount and quality to all citizens, (UNDP, IOM, UNICEF and WHO ,2002).
6
Education and health, have capital importance in human capital development, these two variables will be used to measure the impact on the economic growth.
18
Figure 5: Social services as percentage of GDP and expenditure
Source: Own calculation with data from Finance Ministry
From 1991 to 2005 the social GE as a percentage of GDP was below 10%, but from 2005 to 2011, it was above 10%, with it being at 33% of the total GDP in 2011. The GE on social protection and welfare also consumed a significant amount of social GE being between 11 and 57 per cent, but the majority of this amount is reported as unknown social services7, meaning that there is no way to know here this money was spend and even if it was really used for social services. For an example, in 2010 and 2011 the amount for unknown social services is 83 and 84 per cent of the social protection and social welfare GE respectively.
a) Education
There was a reform of the education structure from 2001 to 2015. The principal objective was updating the sector and preparing it with what is required to encounter the training needs, to realize the main proposal which is ‘education for all’, Ministry of Education8, (2001). From 1991 to 2000, the education GE was not detailed, allowing for mismanagement of the public funds. All amounts of education were reported the category of non- specify education services, which means that is not possible ensure that it was really a GE in education issues, only in 2001 this issue begun to be more clear. From 2002 and 2007
7
Vide appendix section A. 8
The primary and pre-primary level includes kindergarten, initiation class and class from 1º to 6º year of education. The secondary education spans two cycles, one cycle is from 7ºto 9º year and 2º cycle, from 10º to 13º years. Higher education is divided into undergraduate and graduate encompassing undergraduate and post-graduate comprising the master and doctoral.
0% 10% 20% 30% 40% 50% 60% 70% 19 91 19 92 19 93 19 94 19 95 19 96 19 97 19 98 19 99 20 00 20 01 20 02 20 03 20 04 20 05 20 06 20 07 20 08 20 09 20 10 20 11 % GDP % Expenditure
19 unspecified education services was absorbing the amount between 44 to 72 per cent of the total education GE.
The priority of the education sector changed drastically from 2008 to 2011, by clearly giving importance of the education at primary level. In 2011, education execution GE was almost 63% of education spending whereas for primary and pre-primary level. An important thing is that the unspecified education services were reduced from the high amount explained above to zero per cent of the total education GE from 2008 to 2011. Being so recent transformation would be natural to get a very small effect of this change on GDP growth.
b) Health
Health delivery services in Angola are still very bad9, and this contributes to being among the poorest country in the world. The high rates of proneness to disease and death can be seen as a result of lack of access to the health services, hunger, bad nutrition, poverty, access to good water, basic sanitation, etc. The most predominant sickness is malaria with is also the principal of death (UNDP, IOM, UNICEF and WHO, 2002). This is characterized by the deficiency of infrastructure, which is completely degraded. The shortage of doctors, nurses and health technicians (as analysts, radiologists, therapists, physiotherapists) complete a picture of health very weak; see for example (Oliveira, 2012).
Health spending from 1991 to 2000 was only allocated to public health services. There were no allocations for maternity care or ambulatory services which is very similar to the education issue discussed above. The period from2008 to 2011 the high expenses regarding health were for hospital services, and absorbed between 43 to 60 per cent of total health GE. Only from 2008 to 2011 were maternity services and medical centres seen to have a percentage of health GE and this varied from 5 to 21 per cent of the total GE for health. Only after 2001, did the GE for health begin to be planned in a more balance way.
9
20
Non Social Expenditure
In this section we will only concentrated the analyses in two categories, national security and economic issues. We are putting out items like environmental protection, because only have data from 2008 to 2011. General public service is also not described since is more relative to the administrative part of the government activities, and debt payment and therefore was not part of the study.
a) National Security
This service is regarding police services, fire department and prison, the amount of this category in total GE was 758 million in 1991, and in 2011 was about 2.9 billion dollars, during 1991 to 2000, all GE for security and public order was for unspecified services, and the period after 2001 to 2005 the value was less well distributed, however from 2006 to 2011 more than 77% of the total service GE was for unspecified services.
b) Economic issues
The economic issues has a lot of categories such as general economic affairs, trade and employment; Agriculture, fishing and hunting; fuel and energy; extractive industries, manufacturing and construction; transport; communication; research and unspecified economic services. Between all elements of the economic issues category, the variable of Agriculture was taken into consideration which represents an average of 16% per year of the economic issues GE from 1991 to 2011, transport and communication, represents an of 20% a year the economic issues GE from 1991 to 2011.
4.3- SADC Social Expenditure
The Southern Africa Development Community has 15 state members10. To compare the SADC health GE data from 2005 to 2010 was used for all SADC countries except Zimbabwe, because it is the only data available.
10
Angola, Botswana, Democratic Republic of Congo, Lesotho, Madagascar, Malawi, Mauritius, Mozambique, Namibia, Seychelles, South Africa, Swaziland, Tanzania, Zambia and Zimbabwe, (SADC website).
21 As can be seem in figure 9, the SADC average on health GE is in 2005 was 3.49% of the GDP, by this year Angola only allocated 1.90% of GDP to this services, Angola was below SADC average, in this year the country of SADC, which had the best position in Human development indicators was Seychelles, ranking the position 51 of HDI and with a health GE of 3.9% of its GDP. The SADC country with a higher GE in 2005 was Botswana with a percentage of 5.7% of GDP. Botswana was at position 131 of HDI, while Angola was at position 160 in 2005.
During 2006, 2007, 2008 and 2009 the SADC GE was 3.53%, 3.56% , 3.71% and 4.24% respectively, Angola was below SADC average for all the years except in 2009 which was 4.40%, meaning it was 0.16% above the SADC level11.
Figure 6: Health GE as percentage of GDP
Source: http://hdrstats.undp.org/en/indicators/default.html
In 2010, Lesotho had the highest GE on health compared to the rest of SADC countries, being at 8.5% of the GDP. Angola once again was below the SADC level with only 2.4% while the SADC average was 3.97%.
To compare the education GE across countries of SADC data from 2005 to 2009 is used, because it is the only data available. As can be seen below from 2005 to 2009, Angola had the lower education GE in relation with other SADC countries. While some SADC countries were expending more than 4 % of GDP on education, Angola only had 3%.
11 Appendix section A. 0.00 1.00 2.00 3.00 4.00 5.00 6.00 7.00 8.00 9.00 2005 2006 2007 2008 2009 2010
22
Figure 7: Education expenditure as percentage of GDP
Source: World Bank, 2012; Angola Finance Ministry and http://hdrstats.undp.org/en/indicators/default.html
5. Did government expenditure composition affect growth in Angola?
5.1 MethodologyTo analyse the impact of GEon economic development in Angola we will use GDP as an approximation for the development. This thesis use the methodology applied by Loto (2011) in Nigeria. In that study it was measured the impact of GE on economic growth, with specific concentration on sectorial spending decomposition.
Loto (2011) analysed the impact of GEon economic growth which can bring sustainable growth, an alternative economic development. It is used an annual time series data from 1980 to 2008. This main question was which sectorial GEhad positive and significant effects on economic growth in Nigeria. In the experiential investigation, an OLS regression model was used. The variables considered in his study were annual GDP (GDP); education spending (E); health spending (H); agriculture spending (Ag); security spending (Sec) and Transport and communication spending (TC).
It was applied log in all variables; the series were tested for unit roots for all variables by using the standard Dickey-Fuller test. After performing the test for unit roots, it was also performed the cointegration error–correction analysis by applying Johansen test for cointegration, to confirm the presence of the condition that retains the variables in proportion to each other in the long-run., Therefore, the final model outcome was performed by using OLS at first difference operators, with the inclusion of the error
0.00 2.00 4.00 6.00 8.00 10.00
Mauritius South Africa Swaziland Angola Madagascar
2005 2006 2007 2008 2009
23 correction variable in the model. We will use this paper as a benchmark for the first part of the work. We think it is interesting comparing Angola to Nigeria, because they are both from Sub-Saharan Africa and Nigeria like Angola is strongly dependent on Oil.
5.2 Data Report
Database is always a problem in this type of work in Africa. Nigeria and Malawi had data for the past 29 and 28 years respectively. However in Angola, it was impossible to have data starting from 1980, due to the fact that as said above the account system of GEwas not organized until 1990. Thus the data in this analysis is only from the period of 1991 until 2011, only 21 years. It is a small sample and it is possible that the model may have problems that are associated with a small sample and also regarding the quality of the data. Nevertheless, we think that we should try to use the available data and see what the dataset tells us about the research question.
In Angola, the process of data collection was not easy, because the information available on the Ministry of Finance website on the budget execution was only in PDF files. The data used in this thesis is taken from the information available on this site. We use constant prices of 2005, in order to avoid the problem of inflation. Table 2 presents the variables that will be used in following regressions.
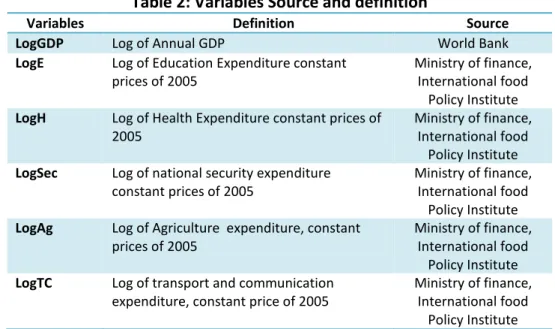
Table 2: Variables Source and definition
Variables Definition Source LogGDP Log of Annual GDP World Bank
LogE Log of Education Expenditure constant prices of 2005
Ministry of finance, International food
Policy Institute
LogH Log of Health Expenditure constant prices of 2005
Ministry of finance, International food
Policy Institute
LogSec Log of national security expenditure constant prices of 2005
Ministry of finance, International food
Policy Institute
LogAg Log of Agriculture expenditure, constant prices of 2005
Ministry of finance, International food
Policy Institute
LogTC Log of transport and communication expenditure, constant price of 2005
Ministry of finance, International food
24
5.3 Estimation of Model 1: Angola Loto Specification
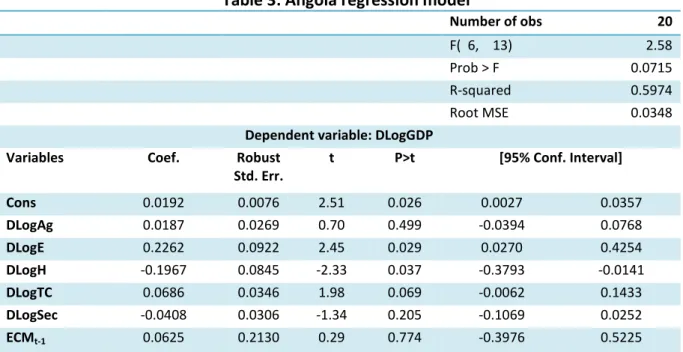
According to all tests performed12, especially the unit roots and co-integration, they have confirmed the presence of conditions for cointegration at the first difference, it is possible to estimate the model outcome, using the OLS methodology. The results from the estimators which exactly replicate the Loto’s one are reported in table 3. So the model can be written as:
Table 3: Angola regression model
Number of obs 20
F( 6, 13) 2.58
Prob > F 0.0715
R-squared 0.5974
Root MSE 0.0348
Dependent variable: DLogGDP Variables Coef. Robust
Std. Err. t P>t [95% Conf. Interval] Cons 0.0192 0.0076 2.51 0.026 0.0027 0.0357 DLogAg 0.0187 0.0269 0.70 0.499 -0.0394 0.0768 DLogE 0.2262 0.0922 2.45 0.029 0.0270 0.4254 DLogH -0.1967 0.0845 -2.33 0.037 -0.3793 -0.0141 DLogTC 0.0686 0.0346 1.98 0.069 -0.0062 0.1433 DLogSec -0.0408 0.0306 -1.34 0.205 -0.1069 0.0252 ECMt-1 0.0625 0.2130 0.29 0.774 -0.3976 0.5225
Source: Own calculation using stata
Because the error correction term tells us the speed with which our model returns to equilibrium following an exogenous shock, we should expect a negative sign of ECM coefficient, indicating a move back towards equilibrium.
The coefficient ECM does not have the correct sign and it is insignificant, meaning that the speed adjustment is moving away from equilibrium, contrary to what was reported to the Nigeria case. So for Angola did not occurred cointegration between GE and economic growth.
25 The short run coefficient of education, agriculture and transport-communication positive correlation with economic growth, education it is significant at 5% and transport-communication only at 10%, while agriculture is insignificant at any level. Therefore education, agriculture and transport-communication can promote economic growth if funds are well managed and sectors are proper funded. Health and national security had a negative sign. The health coefficient is significant at 5%, meaning that at the moment it is not promoting economic growth. If health is correctly financed, it might convey economic growth, if not it can delay growth. In the Nigerian case, health had a positive sign, while education had a negative one. National security in Angola and Nigeria was not significant; this illustrated that spending on national security does not contribute to economic growth in both countries.
The model globally is significant at 10%, but no causality is identified due the fact that cointegration did not happen.
5.4 Estimation of Model 2: Some Sub Saharan Africa (SSA) Countries
Given the results obtained in last section, which could be driven by small sample and trying to extend the dataset by building a panel. We wanted to compare for one side with countries that are mainly dependent on agriculture and on another side with countries that are dependent on minerals such as gold, diamonds etc. Mauritius and Malawi are very dependent on agriculture, while Lesotho and Botswana are dependent on mineral resources different from oil.
Let us began in this section to apply the same estimation to each one of the four countries; the results are shown in table 4.
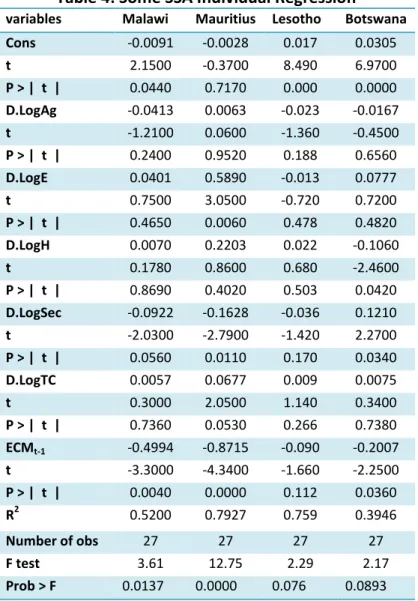
Testing for unit roots and multicollinearity we found out that the main difference with Angola is that those 4 countries have lower collinearity among the variables. Results in table 4, shows that for all countries the coefficient ECM is with the correct sign and it is significant, except for Lesotho, meaning that it is supporting cointegration result, for those there countries, that results are similar to Nigeria case. Tacking now for the effects of the different types of the GE, we can say that in the short run Agriculture GEs in all countries expected Mauritius have a negative sign, but are not significant even at 10%. The negative sign is identical to the one founded for Nigeria, meaning that it can retard economic growth.
26 GE in education has positive sign in all countries expect Lesotho, but only in Mauritius it is significant.
GE in health in the short run has a positive sign with growth in Malawi, Mauritius and Lesotho and a negative one for Botswana, but only in Botswana is significant and similar to the Angolan case.
Table 4: Some SSA Individual Regression
variables Malawi Mauritius Lesotho Botswana Cons -0.0091 -0.0028 0.017 0.0305 t 2.1500 -0.3700 8.490 6.9700 P > | t | 0.0440 0.7170 0.000 0.0000 D.LogAg -0.0413 0.0063 -0.023 -0.0167 t -1.2100 0.0600 -1.360 -0.4500 P > | t | 0.2400 0.9520 0.188 0.6560 D.LogE 0.0401 0.5890 -0.013 0.0777 t 0.7500 3.0500 -0.720 0.7200 P > | t | 0.4650 0.0060 0.478 0.4820 D.LogH 0.0070 0.2203 0.022 -0.1060 t 0.1780 0.8600 0.680 -2.4600 P > | t | 0.8690 0.4020 0.503 0.0420 D.LogSec -0.0922 -0.1628 -0.036 0.1210 t -2.0300 -2.7900 -1.420 2.2700 P > | t | 0.0560 0.0110 0.170 0.0340 D.LogTC 0.0057 0.0677 0.009 0.0075 t 0.3000 2.0500 1.140 0.3400 P > | t | 0.7360 0.0530 0.266 0.7380 ECMt-1 -0.4994 -0.8715 -0.090 -0.2007 t -3.3000 -4.3400 -1.660 -2.2500 P > | t | 0.0040 0.0000 0.112 0.0360 R2 0.5200 0.7927 0.759 0.3946 Number of obs 27 27 27 27 F test 3.61 12.75 2.29 2.17 Prob > F 0.0137 0.0000 0.076 0.0893
Source: Own calculation using stata
For national security and except Botswana, in the short run the same conclusion founded for Angola and Nigeria is there: national security is not promoting economic growth.
27
5.5 Estimation of Model 3: Panel for Some SSA countries
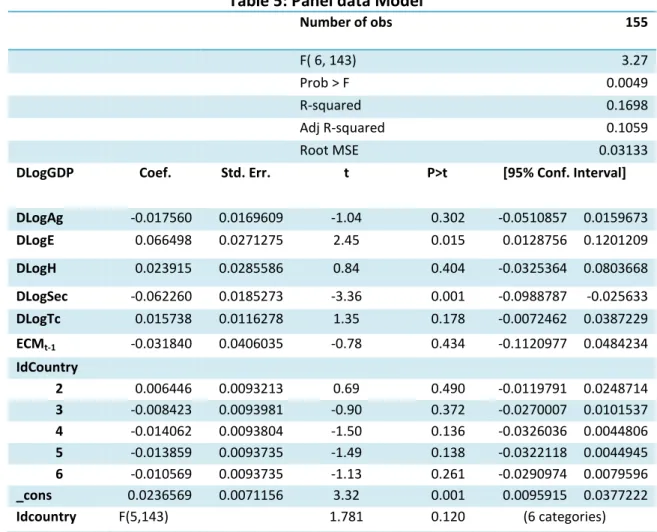
As said before because of the small dataset for every country analysed, in order to check it results can different, with a big sample we have decided construct a panel model. To account for specificity of each country we will used the least square dummy model, with is OLS with dummy variables for each country. The results obtained from that estimation are reported in table 5.
Table 5: Panel data Model13
Number of obs 155 F( 6, 143) 3.27 Prob > F 0.0049 R-squared 0.1698 Adj R-squared 0.1059 Root MSE 0.03133
DLogGDP Coef. Std. Err. t P>t [95% Conf. Interval] DLogAg -0.017560 0.0169609 -1.04 0.302 -0.0510857 0.0159673 DLogE 0.066498 0.0271275 2.45 0.015 0.0128756 0.1201209 DLogH 0.023915 0.0285586 0.84 0.404 -0.0325364 0.0803668 DLogSec -0.062260 0.0185273 -3.36 0.001 -0.0988787 -0.025633 DLogTc 0.015738 0.0116278 1.35 0.178 -0.0072462 0.0387229 ECMt-1 -0.031840 0.0406035 -0.78 0.434 -0.1120977 0.0484234 IdCountry 2 0.006446 0.0093213 0.69 0.490 -0.0119791 0.0248714 3 -0.008423 0.0093981 -0.90 0.372 -0.0270007 0.0101537 4 -0.014062 0.0093804 -1.50 0.136 -0.0326036 0.0044806 5 -0.013859 0.0093735 -1.49 0.138 -0.0322118 0.0044945 6 -0.010569 0.0093735 -1.13 0.261 -0.0290974 0.0079596 _cons 0.0236569 0.0071156 3.32 0.001 0.0095915 0.0377222 Idcountry F(5,143) 1.781 0.120 (6 categories)
Source: Own calculation using stata
Dummy variables for countries specifications do not have significant impact in the economic growth in the model, because are not significant even at 10%.
As said before we would expect that the sign of ECM coefficient was negative, indicating a move back towards equilibrium.
28 Results shows that for the SSA countries the coefficient ECM is with a correct sign and it is insignificant, meaning that ECM is not affecting GDP growth in SSA countries.
In the short run Agriculture GE has a negative sign with GDP, and it is not significant. Education has positive sign with GDP, and it is significant, while national security has negative correlation and it is significant even at 1%, meaning that security GE is not contributing for economic growth in some SSA countries.
5.6- Results interpretation
In model 1, because ECM did not comes out with the correct sign, there is not support that cointegration occur, therefore we could not have causality between GE and economic growth.
In Model 2, ECM comes with correct sign for the four countries, all are significant expect for Lesotho, there is evidence that cointegration occur in the tree countries with is Malawi, Mauritius and Botswana, for those countries we do have causality effects. In Malawi the results did not found short run relation between education, health, agriculture and transport and communication GE and economic growth, because short run coefficients are not significant, while national security has a negative impact on economic growth in Malawi.So we can say that if national security GE increase by 1%, GDP growth rate will increase by 0.09% can maintaining others variables constant.
Education in Mauritius has a positive impact on economic growth, if education GE increase by 1%, GDP growth rate will increase by 0.58%, maintaining others variables constant.
Model 3, the panel data did not change the results that it was given in the model 1. The ECM estimator comes with the correct sing but it is not significant, therefore there is no evidence that cointegration occur. But the sign of education GE and national security still show a correlation in the between economic growth and those GEs and the sign is the same that was founded for Angola model.
29 In summary our results are different from Loto, does not allows us to arrive in the same conclusions, therefore the Angola model do not have speed of convergence to equilibrio, between GE and economic growth.
6. How important were government expenditure to inequality and
poverty in Angola?
Analysing social inequality in Angola is a difficult mission and it is not because the inequality is impossible to see, in fact it is very obvious to see, especially when one drives from Luanda to other provinces. The main problem is the lack of updated data which generates a lot of constrains for government, civil society and academics, in order to define policies to address the principal problems of social inequality and to monitor the progress of polices implementation.
Only in 2011, the INE published the Inquerito de Bem Estar da População (IBEP), that provide important information on the levels of poverty and inequality across the country, as well as information to crucial questions related to geographical differences of gender, education and other factors of poverty and social inequality. IBEP was carried out during 2008, 6 years after the end of the civil war. The dataset used in this section comes from IBEP, with is organized per household in each provinces.
Contrary to section 5, where sectorial GE was used, here we will use the distribution of GEGE for the different provinces.
In order to answer to the question of this section the work uses the available data of the year of 2008; we think 2008 is a god year, because it follows the year of higher economic growth as it was shown in chapter 3. This high growth had some impact on GE in 2008, which was higher than in previous years.
As mentioned earlier, Angola is the second largest oil producing country in Africa after Nigeria, but at the same time has poor socio economic indicators. With a vast natural resources and endless potential for economic growth, we think that it should have the capacity to present better human development indicators. How important for this failure was distribution of GE across provinces?
30 Angola ranks at position 148 out of 186 countries with a HDI of 0.508, HDI (2012). This is what we can say on average for each Angolan? Let us began by understanding what do we know about distribution of income and consumption across people. Each person in Angola has an average monthly consumption of 6,449 kwanzas (approximately 67 US dollars), meaning that on average each Angolan citizen has a consumption of 2.23 US dollars a day. The poverty line is 50.45 US dollars a month and 37% of the population are living poorly with less than 1.6 US dollars per day.
Let’s now get some data on inequality, by using the distribution of consumption shows that 20% of the richest population concentrated almost half of the total consumption and the poorest 20% corresponds only 5% of consumption. Inequality in consumption is also among the residential areas, and the urban population has a double of rural population, the Gini coefficient is 0.43.
We can also look for distribution understanding of other types of development indicators. In terms of access to basic services, only 8.5% of population has water at home connected to national Water Distribution Company. However, in urban area this numbers is 14.7% while in rural area is only 1%. Only 36.3% of the population has electricity from the national company and the urban area number of 62.5% compare with the one in rural area of 7.3%.
The rate of primary school attendance is 76.3%, in urban area 84.9% and in rural is 66.8%, the net rate for secondary level is 18.9%, in urban area 29.7% and in rural area is only 4.2%, about 65.6% of population with more than 15 years can read and write, however in rural areas it is only 44.8% of population.
With this numbers we can conclude that in global context there are very low indicators for Angola, but when we look for individuals it is much worse.
6.1 Spatial distribution of Expenditure and inequality
Given the results that were presented we want now to understand the special distribution and how it is with polices like GE. The total GE in Angola is not only within the 18 provinces, because it includes another line with is central structure of government and also GE outside of the country. For the proposal of this chapter the GE outside of the country is not going to be taken in consideration.
31
Table 6: Expenditure per province in 2008 as per budget information
Provinces Amount in millions of US dollars Percentage My calculation Amount in millions of US dollars Bengo 121.55 0.38 199.48 Benguela 466.23 1.45 783.41 Bié 230.78 0.72 390.10 Cabinda 358.11 1.11 578.90 Central Structure 27,538.99 85.59 0.00 Outside country 75.62 0.24 0.00 Huambo 452.41 1.41 201.67 Huíla 300.01 0.93 724.60 Kuando Kubango 174.03 0.54 491.41 Kunene 113.73 0.35 248.14 Kwanza Norte 110.74 0.34 195.89 Kwanza Sul 194.58 0.60 317.04 Luanda 942.47 2.93 25,904.47 Lunda Norte 130.50 0.41 218.85 Lunda Sul 94.00 0.29 166.14 Malanje 146.34 0.45 244.75 Moxico 316.06 0.98 450.28 Namibe 104.80 0.33 179.19 Uíge 206.69 0.64 599.77 Zaire 97.02 0.30 204.94 Total 32,174.66 100.00 32,099.05 Source: Own calculation with data from Finance Ministry
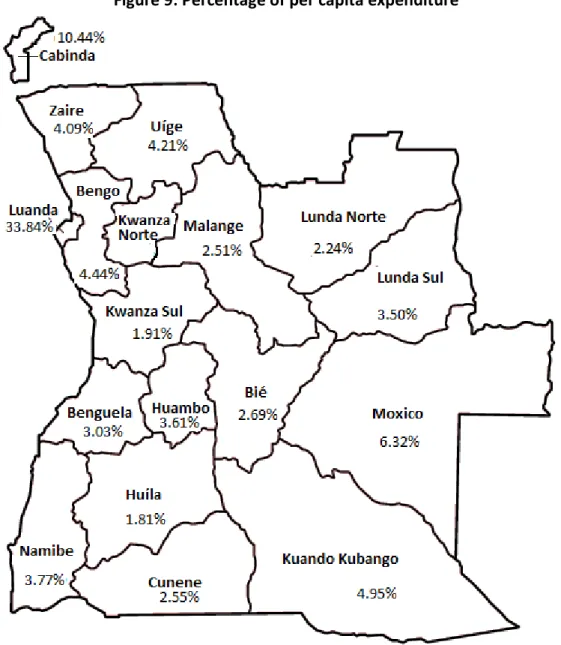
Angola province GE is not the right number to look, because inside of central structure we have some expenses that go to the provinces. Since this is a very high value, it is necessary to allocated it in the respective provinces. Once there is GE per institution among the country, we have used this information to know the share of central budget in each province. With this share per province, we took the amount of central budget per province and add it to previous allocation of GE per province; this allows us to construct a different table from this official GE distribution across provinces, we have it in US dollar, in order to allow work with less digits compare with the values in Kwanzas.
Using the information of population estimation for 2008 of World Bank data, and the percentage of population per provinces from the IBEP dataset, it was possible to calculate the population per each province. Therefore the per capita distribution of GEGE per province was calculated. This is presented in figure 8 and 9.