*Corresponding author. E-mail: [email protected]
Copyright © 2019 The Author(s). Published by VGTU Press
This is an Open Access article distributed under the terms of the Creative Commons Attribution License (http://creativecommons.org/licenses/by/4.0/), which permits unre-stricted use, distribution, and reproduction in any medium, provided the original author and source are credited.
2019 Volume 34 Issue 2: 225–236 https://doi.org/10.3846/transport.2019.8946
CYCLING AT INTERSECTIONS: A MULTI-OBJECTIVE ASSESSMENT
FOR TRAFFIC, EMISSIONS AND SAFETY
Behnam BAHMANKHAH*, Paulo FERNANDES, Margarida C. COELHO
Dept of Mechanical Engineering, Centre for Mechanical Technology and Automation, University of Aveiro, Portugal
Received 2 February 2017; revised 17 May 2017; accepted 24 September 2017
Abstract. This paper evaluated in an integrated manner the traffic performance, pollutant emissions and road conflicts
between bicycles and motor vehicles at a signalized intersection. Two alternative scenarios were examined: (1) bicycles increment and motor vehicles replacement within the cycle-fixed traffic signal; (2) replacing the existing traffic control by a conventional two-lane roundabout and evaluating the impacts of bicycles increment. For each scenario, bicycle demand was varied from 9 to 270 bicycles per hour (bph). Traffic flow and vehicle dynamic data were collected from a three-leg signalized intersection in Aveiro (Portugal). The microscopic traffic model (VISSIM) paired with an emission (Vehicle Spe-cific Power – VSP) methodology and safety (Surrogate Safety Assessment Methodology – SSAM) model were used to as-sess intersection-specific operations. The fast Non-Dominated Sorting Genetic Algorithm (NSGA-II) was used to find the optimal bicycle demands. The results showed that two-lane roundabout outperformed the existing traffic control, namely in highest bicycle demand scenario (number of stops and travel time reduced in 78 and 14%, respectively; CO2, NOx, and HC decreased 9, 7, and 12%, respectively). It was also found that the number of conflicts was significantly reduced (–49%) with this latter layout even in maximum bicycle demand scenario (270 bph). However, roundabout layout lead to more severe conflicts and potential crashes. The analysis showed that bicycle demands of 75, 95 and 110 bph delivered good en-vironmental and safety outcomes for the intersection.
Keywords: bicycle, microscale modelling, multi-objective optimization, traffic, emissions, safety. Introduction and objectives
Cycling demand is increasing every day, notably in high-density areas (Pucher, Buehler 2008). Cycling offers some important financial, health and social benefits to the us-ers and environment. Bicycle is one of the most impor-tant alternatives to motor vehicle, and for short distances might be the best alternative to go easy and fast when the vehicles must stop because of traffic congestion. They are often quicker than motor vehicles over short distances of up to 5 km (DTMR 2018). These facts can explain why the rate of cycling in European small cities is higher than that observed in big cities (Pucher et al. 2011).
Signalized intersections are essential traffic control treatments that provide safe and efficient control of traffic congestion (Nguyen et al. 2016). Due to the complexity of intersections, high traffic volumes and densities, the interactions of vehicle-to-vehicle and bicycle-to-vehicle are steadily increased. This means that there is a higher risk for motor vehicles and bicycles crashes at
intersec-tions, compared to other urban network areas (Götschi et al. 2016).
Based on the current released data by National High-way Traffic Safety Administration (NHTSA 2017) 45000 cyclists were injured in the United States (57% of them at intersections) in 2015. Among 818 killed cyclists, which represents a 12% increase from 2014, 27% of fatalities oc-curred at intersections as well.
According to a research that was conducted by Ha-worth and Debnath (2013) in the State of Queensland of Australia from 2005 to 2009, almost half of the bicycle and motorcycle crashes occurred at intersections. Moreover, most Australian on-road bicycle fatalities (80%) involv-ing motor vehicles in dry road conditions. Haworth and Debnath (2013) showed that drivers performed illegal ma-noeuvres in crashes at intersections with no traffic control (74.4% of these crashes involved bicycles) and operating traffic lights (18.6% of these involved bicycles).
About European countries, a total of 2112 cyclists were killed in 2014, which represents 8% of total number of road accident fatalities. Moreover, 55% of cyclist fatalities occurred in urban areas and almost half of them (27%) were at junctions. Although, there was a significant varia-tion among European countries, but in total bicycles had the third highest fatality rate at junctions.
Frequently reviewing traffic operations at intersections to find a compatible signal operation is one of the ways of improving traffic performance, safety, energy consump-tion or pollutant emissions levels. A shorter cycle length may result in poor progress while a longer cycle length may result in excessive delays and queue blockage prob-lems (Ramadurai 2015). Kaplan et al. (2016) suggested a self-selection effect in which the intersection density is negatively correlated with the probability of cycling but is positively related to the distance cycled.
With respect to safety, number of conflicts between vehicles has significant relationship with the number of crashes in urban network. It is one of the main items that helps traffic engineers and managers to assess safety and to predict accidents before its occurrence (Van Hout 2008). Regarding the probable safety concerns associated with the number of conflicts between motor vehicles and cyclists, roundabouts and intersections with traffic lights and stop-controlled junctions are the critical traffic points (Kaplan et al. 2016). The frequency of conflicts between vehicles and cyclists at signalized intersections influence areas may increase under moderated or high cycling flows. For example, drivers typically wait to turn left to proceed even after the signal is red, cutting the path of vehicles processing on the green signal. In turn, cyclists filter through to the front of stopped queue and therefore they created conflicts with these drivers.
The study of conflicts between bicycle and motor vehi-cle might be more important than conflicts between mo-tor vehicles since cyclists are more vulnerable and poten-tial exposed to damage of a collision than motor vehicles’ drivers (Götschi et al. 2016).
The analysis of traffic signals impact on traffic perfor-mance and emissions is extensive. The first studies, which date back to the 1970s, focused on the traffic performance and emissions impacts at intersections and can be found in the Environmental Protection Agency (EPA) reports (EPA 2002). Since then a lot of related studies have been performed both in a macroscale and microscale levels. For instance, on a microscale level, there have been several studies about the impact of signal optimization (Zhang et al. 2009; Khaki, Haghighat Pour 2014), level of service (LOS) improvement (Hurley, Kalus 2007; Barth, Bori-boonsomsin 2008; Papson et al. 2012; Mok et al. 2013), and vehicular emissions at intersections (Coelho et al. 2005, 2006; Li et al. 2011; Zhou, Cai 2014).
There were several studies focused on impacts of cy-cling regarding safety concerns, traffic performance and emissions at intersections – about traffic performance-safety: (AlRaji 2015; Huang et al. 2013) and about
traf-fic performance-emissions: (Zhang et al. 2009; Khaki, Haghighat Pour 2014; Zhou, Cai 2014). However, there is a lack of research focused on the impacts of cycling at intersections in an integrated way. Stevanovic et al. (2015) used multi-objective analysis to evaluate the traffic signal operation integrated impacts on three dimensions; traffic performance, emissions and safety at signalized intersec-tions. However, the research did not include bicycle effects on intersection-specific operations.
The presence of bicycles may dictate a trade-off in the network. On one side, as the number of cyclists increases, the emissions generated by vehicles (assuming a same traf-fic demand) and the number of traftraf-fic conflicts increases. On the other side, the severity of conflicts tends to be high with low demand of bicycles because vehicles can attain high speeds. Since the existing trade-off between the re-sults are associated with different performance measures, the multi-objective analysis can be useful and informative (Bai et al. 2012).
Roundabouts have the potential to reduce both the fre-quency and severity of crashes compared to traditional in-tersections (signalized or stop-controlled). Several studies carried out show the safety benefits of replacing signalized intersections by roundabouts (Sakshaug et al. 2010; Gross et al. 2013; Jensen 2013; Brilon 2016).
For instance, Groos et al. (2013) used Empirical Bayes method in an observational before–after study to estimate total and injury crashes after replacing 28 signalized inter-sections by roundabouts in the United States. There was a significant reduction in both total and injury crashes. It was also found that safety benefits were more pronounced in suburban than for urban conversions and for intersec-tions with four approaches compared to those with three. Jensen (2013) carried out a before–after study to ana-lyse the safety results of converting 332 intersections to roundabouts in Denmark from 1995 to 2009. The total number of crashes and injuries decreased by 27 and 60%, respectively, while the total number of bicycles’ crashes and injuries have increased by 65 and 40% respectively af-ter conversions. However, the authors have mentioned that the safety results should not be generalized, since there were some significant differences among converted sites.
In contrast, the positive safety effects of converting in-tersections to roundabouts are not clear for bicycles. Some studies have been shown significant safety improvement (Schoon, Van Minnen 1994) while in other studies the ef-fect of converting intersections to roundabouts on cyclists’ safety was unclear or even negative (Sakshaug et al. 2010; Jensen 2013).
Since most of bicycle fatalities involve motor vehicles, studying the interaction between vehicles and specially bicycles–vehicles can help to a better accident prediction in urban areas. In addition, a deeper understanding of the bicycle impacts on road networks is essential to achieve a good balance among traffic performance, emissions and safety parameters. The novelty of this paper is the analysis of cyclists’ demand effects at intersection influence area
on traffic performance, emissions and conflicts between motor vehicles and cyclists. In addition, this research also identifies some trade-offs among these outputs. Next, sev-eral methods to improve intersection-specific operations are examined, namely: (1) replacement of the current intersection layout and (2) proper cyclist demand values according to the intersection-specific characteristics. This paper tests these methods in a real-world three-leg inter-section.
Thus, the main objectives of this paper are:
– to evaluate the impact of increasing bicycle demand on traffic performance, global and local pollutant emissions and safety;
– to improve site-specific operation by proposing a dif-ferent traffic control treatment (two-lane roundabout instead of traffic lights) for the intersection;
– to conduct a multi-objective analysis to find opti-mum bicycle demands to improve site specific emis-sions and safety.
1. Methodology
The present work uses a microscopic simulation platform of traffic (VISSIM) (PTV 2011) and emissions (Vehicle Specific Power – VSP) (EPA 2002) to analyse traffic op-erations, and to estimate carbon dioxide CO2, nitrogen
oxides NOx, carbon monoxide CO and hydrocarbons HC
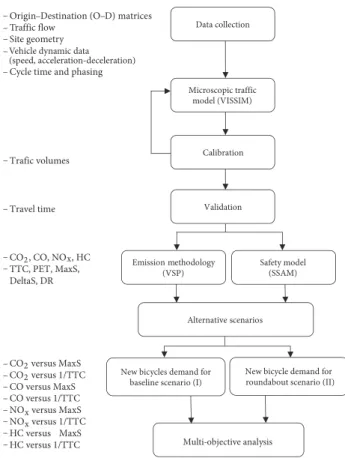
emissions, respectively. The Surrogate Safety Assessment Methodology (SSAM) model was applied to estimate con-flicts from vehicle-vehicle and vehicle-cyclist interactions and to compute surrogate safety measures. The Time-To-Collision (TTC) and the minimum Post-Encroachment Time (PET) were used to assess conflict severity, while the initial Deceleration Rate (DR), maximum speed (MaxS) and maximum relative speed difference (DeltaS) during the conflicts were used to represent the severity of the potential crashes. The intersection lanes operation was videotaped and necessary data were extracted from these tapes. In addition, a test-equipped vehicle with a Global Position System (GPS) collected second-by-second speed and acceleration/deceleration rates. Subsequently, data were input in the VISSIM model, which was calibrated and validated. Lastly, alternative scenarios were defined and then multi-objective optimization of bicycle demand was carried out. The flowchart of methodology is illus-trated in Figure 1.
1.1. Site selection and field data collection
The selected case study is a three-leg intersection con-trolled by traffic light located in the city of Aveiro (Portu-gal). It has potential traffic conflicts caused by left-turning vehicles from North to East directions. The segments that were considered to monitor traffic volumes included 300 m upstream the traffic light, as shown in Figure 2. Traf-fic signal is working based on fixed time operation with two-phases and the cycle time is 80 s. In Phase I, there are two protected turns, without opposing traffic, to right
and left for minor lanes (diverging conflicts). Concern-ing Phase II, there are three types of vehicular conflicts (diverging, merging and crossing conflicts) for the major lane of the intersection. In addition, sequential conflicts may occur between two vehicles travelling in sequences (one following the other) in both major and minor roads. Figure 3a identifies above-mentioned conflicts. The aver-age traffic volume was 1649 vehicles per hour (vph) and 9 bicycles per hour (bph). Furthermore, the operation of signal time represents 40 s green interval, 3 s yellow inter-val and 37 s red interinter-val for Phase I that is the cycle time related to the major lanes (North and South directions).
Figure 1. Methodological framework
Origin–Destination (O–D) matrices Traffic flow
Site geometry Cycle time and phasing
Trafic volumes Travel time CO2, CO, NOx, HC TTC, PET, MaxS, CO2 versus MaxS CO2 versus 1/TTC CO versus MaxS CO versus 1/TTC NOx versus MaxS NOx versus 1/TTC HC versus MaxS HC versus 1/TTC Data collection Microscopic traffic model (VISSIM) Calibration Validation Emission methodology
(VSP) Safety model (SSAM)
Alternative scenarios
New bicycles demand for baseline scenario (I)
Multi-objective analysis
New bicycle demand for roundabout scenario (II)
DeltaS, DR Vehicle dynamic data (speed, acceleration-deceleration) – – – – – – – – – – – – – – – – –
Figure 2. Layout of the case study with the identification of videotaping and traffic lights
(source: https://www.bing.com/maps)
Data were collected on three typical weekdays (Tuesday to Thursday) in April 2016, using one video camera (Fig-ure 2). Field meas(Fig-urements were conducted in the morn-ing peak hour, from 8:00 a.m. to 10:00 a.m. A camera was placed near the intersection, approximately 5 m above the ground, on the pedestrian bridge over the main road. The video tapes from the study site were used to acquire traffic and bicycle volumes and directional splits by approach, as well as to estimate the observed conflicts, as explained in the following sections. An equipped Light-Duty Vehicle (LDV) performed several trips at the major roads (mainly North-South and South-North movements). The-vehicle was equipped with a GPS data logger to record vehicle speed, distance travelled, and deceleration-acceleration rates in 1-second interval. Approximately 100 GPS travel runs were performed for this paper. GPS data were col-lected between 8:00 a.m. and 10:00 a.m. while traffic data were collected between 8:00 a.m. and 9:30 a.m.
1.2. Traffic modelling
VISSIM software package was selected to simulate traffic operations (PTV 2011). The capability of VISSIM model in reproducing accurately traffic and bicycle operations at microscale for intersections is one of the main advan-tages of this traffic model (Mok et al. 2013; AlRajie 2015). Simulation experiments was made for the analysis period between 8:20 p.m. and 9:30 p.m. with a 10-min “warm-up” period prior to 8:30 p.m. to load the road network adequately with corresponding traffic and bicycle flows.
VISSIM traffic model was initially calibrated to repro-duce intersection specific operations from the data
col-lected. Thus, driver behaviour parameters of the VISSIM traffic model were adjusted with the main purpose of as-sessing their impact on traffic volumes for each coded link. The calibrated driver behaviour measures included the car following – average standstill distance, additive and mul-tiple part safety distance; gap acceptance – visibility, front and rear gaps and safety distance; and lane change – wait-ing time before diffusion, min-headway, safety distance reduction factor and maximum distance for cooperative breaking. The modified chi-squared statistics Geoffrey E. Havers (GEH) that incorporates both absolute and rela-tive differences in comparison of estimated and observed volumes, was used as the calibration criteria (Buisson et al. 2014). More than 85% of the links must meet the GEH value lower than 4. In addition, the Mean Absolute Percent Error (MAPE) was used to measure the size of the error (deviation) for the observed and estimated data.
1.3. Emissions estimations
The selected methodology to estimate the emissions is based on the concept of VSP. The scope of analysis is fo-cused on vehicular emissions of CO2, NOx, CO and HC. VSP is estimated from a second-by-second speed profile based on emission factors from typical LDVs (EPA 2002). Furthermore, VSP is associated with any speed trajectory and has capability to estimate the footprint of emissions at intersections with traffic lights and roundabouts (Coelho et al. 2006; Anya et al. 2013; Salamati et al. 2013, 2015). Equation provides the generic VSP equation from typical LDVs (EPA 2002):
(
1.1VSP v= ⋅ ⋅ +a 9.81⋅ ⋅
(
a tan sin(
(
grade)
)
)
+)
30.123 0.000302 v+ ⋅ ,
where: VSP is vehicle specific power [kW/metric ton]; v is the instantaneous speed [m/s]; a is the acceleration/decel-eration rate [m/s2]; grade is road grade (decimal fraction).
Each VSP bin refers to one of 14 modes. Each VSP mode is defined by a range of VSP values, which are asso-ciated to an emission rate. Each calculation of VSP results in a unique classification to a VSP mode (Anya et al. 2013; Coelho et al. 2009).
The following fleet composition based on the Portu-guese car fleet distribution (ACAP 2014) was considered: 44.7% of light duty gasoline vehicles, 34.3% of light duty diesel vehicles and 21.0% of light commercial diesel ve-hicles. Transit buses, motorcycles and heavy-duty trucks represented only 1% of traffic composition and therefore were excluded from the emissions calculations. The effects of the grade were not included since terrain is flat.
1.4. Safety model
For the safety assessment approach the software developed by the Federal Highway Administration – FHWA (Surro-gate Safety Assessment Model – SSAM) was used (Gett-man et al. 2008).
Traditionally, traffic safety assessment heavily relies on crash data analysis, in which the number or consequences
Figure 3. Conflict types observed at three-leg signalized intersection (a) and relationship between observed
and simulated conflicts (b)
R² = 0.7436 40 140 Sim ulated total co nf licts
Observed total conflicts
45 55 65 75 85
b) a)
of crashes were used as measures of effectiveness to eval-uate the safety performance of traffic facilities (Huang et al. 2013). SSAM automates traffic conflict analysis by processing vehicles trajectories from a microscopic traf-fic model as VISSIM. For each simulation, SSAM stores the trajectories of vehicles and bicycles from the traffic model and determines whether an interaction between vehicle-to-vehicle or vehicle-to-bicycle satisfies the condi-tion to be deemed a traffic conflict (Fernandes et al. 2015). The authors used the TTC as a safety indicator to assess whether a vehicle-vehicle and vehicle-bicycle interaction can result in conflict. TTC is a measure of conflict severity (low values of TTC indicate high severe conflicts).
The threshold value of TTC was set 1.5 s, as suggest-ed for urban areas by Gettman et al. (2008). Moreover, TTC ≤ 1.5 s was defined as a being a serious conflict point for motor vehicles and bicycles at intersections by Widdel and Kaster (1981). However, other authors (Getman et al. 2008) divided TTC values in different severity ranges (e.g. TTC ≤ 0.5 s, TTC ≤ 1.0 s, and TTC ≤ 1.5 s). It must be noted that conflicts with TTC value of 0.5 s (more severe) have higher probability in resulting in a crash than con-flicts with a value of 1.0 s. Based on these facts, the authors also analysed the impact of conflicts with TTC lower than 0.5 s in the analysis of the alternative scenarios.
Also, the research team used the minimum PET to as-sess conflict severity, and the initial DR), MaxS and DeltaS during the conflict to represent the severity of the poten-tial crashes (Gettman et al. 2008).
1.5. Alternative scenarios
In order to improve traffic operation and safety levels, two alternative scenarios were defined based on the potential role of bicycles:
– Scenario I: Increasing number of bicycles from 9 to 270 with 30 bph increments for baseline scenario and replacing number of motor vehicles based on occu-pancy ratio of motor vehicles (1.2 person per 1 motor vehicle) for each volume of bicycle demand (Schultz et al. 2015). It should be noted that, increasing the number of bicycles and replacing the motor vehicles was done based on their distribution rate at each lane of the network. This range of values was justified by the new project implementation (PO SEUR 2016) that aims to encourage as many people as possible to use the bicycle as a regular transport mode, and as a result 240 new bicycles will be provided at campus area of the University of Aveiro. Furthermore, assum-ing 30 more active bicycles for current situation the impact of new situation was analysed up to 270 bph; – Scenario II: The existing traffic control was replaced
by a two-lane roundabout and evaluating the impacts of new bicycles increment as same as the first pro-posed scenario. The number of bicycles increased for proposed roundabout and the number of motor vehicles replaced based on occupancy ratio between bicycle and motor vehicle, as it was defined before,
for each volume of bicycle demand. The roundabout layout was built according the Portuguese Guidelines (Bastos Silva, Seco 2012): inscribed circle diameter = 43.8 m and circulating lane width = 7.9 m. The entries and exits of the northbound and southbound lanes have two lanes while eastbound road has one lane in both directions.
1.6. Multi-objective optimization
The fast Non-Dominated Sorting Genetic Algorithm (NSGA-II) was applied to conduct the multi-objective analysis (Moussouni et al. 2007). NSGA-II was reported as one of the effective algorithm in finding a good approxi-mation of an optimal Pareto front (Konak et al. 2006).
NSGA-II can be outlined in the following steps (Deb et al. 2002):
– the population (optimal bicycle demand) was initial-ized considering both objective variables range values and model constraints (in this case, bicycle demand); – a non-domination criteria was applied to sort the
population. Thus, a binary tournament selection based on the rank and crowding distance process was performed to select the parents (bicycle demand in the first generation) from the population that in this case is defined as bicycle optimal demand. An individual (bicycle demand) is selected in the rank if is smaller than the other individual or if crowding distance is greater than the other (this guarantees di-versity in the optimal solutions);
– the selected population generated offspring by apply-ing crossover and mutation rates, and further parents and offspring were merged to choose the best indi-viduals in the population (elitism).
After reaching stopping criteria (number of genera-tions) and optimal solutions found in the Pareto Approxi-mate Front, the procedure was finished.
Among the safety indicators, the TTC and MaxS were selected to represent the severity of conflicts and collision respectively. Moreover, the global and local emissions were selected to analyse against these safety indicators to find the existent differences between them.
The following tests were performed: (1) CO2 versus MaxS; (2) CO2 versus 1/TTC; (3) CO versus MaxS; (4)
CO versus 1/TTC; (5) NOx versus MaxS; (6) NOx versus
1/TTC; (7) HC versus MaxS; (8) HC versus 1/TTC. Three main reasons supported these tests: (1) to identify hypo-thetic differences in optimal bicycle demand differences between global (CO2) and local (CO, NOx and HC) pol-lutant emissions; (2) to examine the differences between severe conflicts (TTC) and potential crashes (MaxS); and (3) a two-dimensional (2D) front allows visualizing opti-mal bicycle demand data sets on an easy way, instead of considering all variables simultaneously.
Once these tests perform, the optimal bicycle data set values were obtained for each case. A set of 15 optimal solutions was considered for this analysis. In addition, the authors gave the same relevance (weight) to all objective variables during the optimization procedure.
2. Results and discussion
2.1. Traffic and safety model calibration and validation
Calibration of VISSIM parameters was made based on estimated and observed traffic volumes with 15 random seed runs (Hale 1997). A good fit between observed and estimated volumes was obtained (R2 = 0.99) using a linear
regression analysis. Also, all the 36 links recorded a GEH value lower than 4, which satisfied the calibration criteria proposed by Dowling et al. (2004), while MAPE values were lower than 4%.
Regarding model validation, a comparison of observed and simulated travel time at the two main lanes of inter-section, for North-South and South-North movements, was conducted using 100 floating car runs (Dowling et al. 2004). Observed travel time were obtained by vehicle dy-namic data collected from through movements (North-South and (North-South-North) at major lanes while simulated travel time were computed from vehicle recording tool of VISSIM (PTV 2011). The difference between observed and estimated average travel time was not statistically sig-nificant at a 5% significance level, which demonstrated the accuracy of the traffic model in representing traffic and bicycle operations along the study domain.
Lastly, a comparison of SSAM conflicts and observed was conducted. Thus, the videotapes recordings were reviewed for several times to obtain the traffic conflicts (Huang et al. 2013), as shown in Figure 3. The authors ran the VISSIM simulation model and the results classi-fied with 15 min time intervals. To be consistent with the conflict types computed by SSAM, the observed conflicts
were classified into three types: (1) rear-end conflicts, (2) lane-change conflicts, and (3) crossing conflicts.
Linear regression analysis was used to identify if the simulated traffic conflicts provided reasonable estimates for the observed traffic conflicts. It was found that the rela-tionships between the simulated and the observed conflicts were statistically significant and acceptable (Figure 3b).
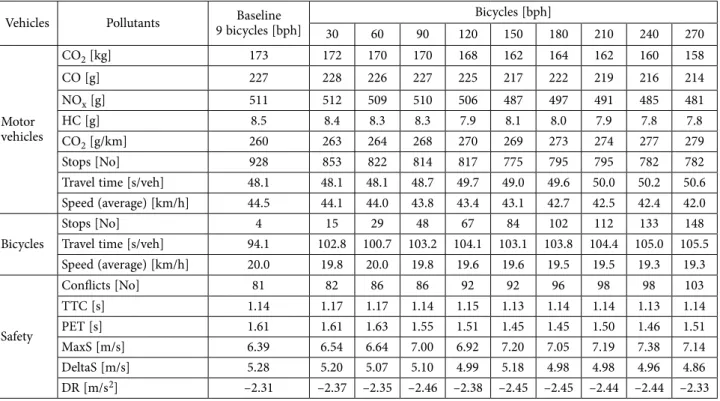
2.2. Baseline and alternative Scenario I
This section presents the main results for baseline and al-ternative Scenario I. Performance measures such as aver-age vehicle and bicycle travel time and number of stops were given from the vehicle recording tool of the VISSIM (PTV 2011) while TTC, PET, MaxS, DeltaS and DR were computed in SSAM (Gettman et al. 2008).
Table 1 lists traffic performance, emissions and safety outputs for above scenarios by bicycle demand scenario. As the number of bicycles increased from 9 to 270 bi-cycles, the emissions generated by vehicles decreased (on average 9, 6, 6 and 8% for CO2, CO, NOx and HC) and
concomitantly the travel time increased about 5% for the motor vehicles. This happens because motor vehicles in the network are more impacted by cyclists and so they spend more time, individually in the road.
The bicycles did not follow the same trend. Due to bi-cycles increment at the study domain, the number of stops increased from 4 (9 bph) to 148 (270 bph), and the travel time increased from 94.1 to 105.5 s respectively as well. The increase in the number of bicycles resulted in more conflicts (27% more in the 270 bph scenario compared to the existing conditions). The analysis results showed that there was no stable trend in TTC and PET values as bi-cycle demand increased (these measures were practically
Table 1. Summary results of baseline and alternative Scenario I
Vehicles Pollutants 9 bicycles [bph]Baseline Bicycles [bph]
30 60 90 120 150 180 210 240 270 Motor vehicles CO2 [kg] 173 172 170 170 168 162 164 162 160 158 CO [g] 227 228 226 227 225 217 222 219 216 214 NOx [g] 511 512 509 510 506 487 497 491 485 481 HC [g] 8.5 8.4 8.3 8.3 7.9 8.1 8.0 7.9 7.8 7.8 CO2 [g/km] 260 263 264 268 270 269 273 274 277 279 Stops [No] 928 853 822 814 817 775 795 795 782 782
Travel time [s/veh] 48.1 48.1 48.1 48.7 49.7 49.0 49.6 50.0 50.2 50.6
Speed (average) [km/h] 44.5 44.1 44.0 43.8 43.4 43.1 42.7 42.5 42.4 42.0
Bicycles
Stops [No] 4 15 29 48 67 84 102 112 133 148
Travel time [s/veh] 94.1 102.8 100.7 103.2 104.1 103.1 103.8 104.4 105.0 105.5
Speed (average) [km/h] 20.0 19.8 20.0 19.8 19.6 19.6 19.5 19.5 19.3 19.3 Safety Conflicts [No] 81 82 86 86 92 92 96 98 98 103 TTC [s] 1.14 1.17 1.17 1.14 1.15 1.13 1.14 1.14 1.13 1.14 PET [s] 1.61 1.61 1.63 1.55 1.51 1.45 1.45 1.50 1.46 1.51 MaxS [m/s] 6.39 6.54 6.64 7.00 6.92 7.20 7.05 7.19 7.38 7.14 DeltaS [m/s] 5.28 5.20 5.07 5.10 4.99 5.18 4.98 4.98 4.96 4.86 DR [m/s2] –2.31 –2.37 –2.35 –2.46 –2.38 –2.45 –2.45 –2.44 –2.44 –2.33
constant). However, the rate of severe serious conflicts (TTC ≤ 0.5 s) slightly increased from 2% (9 bph) to 5% (270 bph). The severity of potential collisions increased as MaxS point of view (more than 10%), but DR (in absolute terms) and DeltaS did not vary among bicycle demand scenarios.
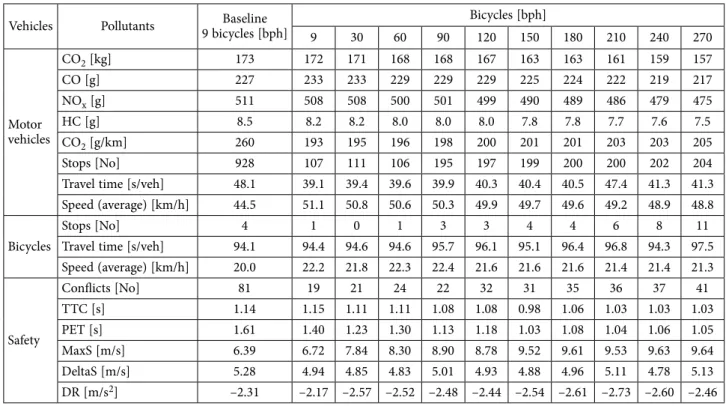
2.3. Alternative roundabout Scenario II
The findings confirmed some improvements on traffic performance and emissions using two-lane roundabout, as presented in Table 2. The results showed that in the first demand (30 bph) the emissions in CO2, NOx and HC, reduced 1.2, 0.6 and 3.5% respectively, compared to traf-fic light solution (baseline). However, CO emissions were higher in roundabout scenario (2.6%), which may be due to the acceleration episodes that vehicles experienced both in the downstream and circulating areas (before exiting) of the roundabout. Continuing to increase the number of bicycles, and replacing more motor vehicles as well, the re-duction in emissions was more pronounced. For instance, in last demand scenario (270 bph) CO2, NOx, and HC ve-hicular emissions decreased 9.0, 7.0 and 12% respectively replacing traffic light by two-lane roundabout. Rounda-bout solution was also very effective in terms of traffic per-formance measures (its implementation allowed the num-ber of stops and travel time to be reduced in more than 78 and 14%, respectively in the last demand). Concerning the bicycles, the traffic performance measures dictated notable reduction in the number of stops while travel time did not vary after implementing roundabout.
The findings confirmed significant improvements on safety regarding the number of conflicts. The results
showed that in the first demand (30 bph) and last demand (270 bph), the number of conflicts reduced 74 and 49%, respectively, compared to traffic light solution (baseline). However, there was not a consensus about safety variables. Both TTC and PET decreased, which means more severe conflicts. For instance, the total number of severe con-flicts (TTC ≤ 0.5 s) increased from 7% (9 bph) to 16% (270 bph). Notably, roundabout scenario recorded high MaxS values, especially under high-bicycle demand sce-narios (30% higher than those obtained in the signalized solution). This is caused by weaving manoeuvres of vehi-cles at the circulating area of the roundabout.
In summary, the benefits of roundabout layout in traf-fic performance and emissions measures were pronounced while the safety benefits were unclear. Roundabout caused more severe conflicts as the number of bicycle users in-creased, as well as more severe potential crashes (as MaxS criteria) compared to baseline scenario. However, the difference in surrogate measures between scenarios was not statistically significant at a 5% significance level (p-value < 0.05). Several explanations support these re-sults. First, most of conflicts in the baseline occurred near the traffic light and during the left-turning movements (vehicles are waiting for a crossable gap of South approach vehicles), as depicted in Figure 4. In the roundabout, the severity of conflicts can increase due to circulating area of roundabout that drivers experience moderate speed and lane change (as a presence of other vehicles or bicycles), which does not occur in the baseline scenario.
The Figure 4 also shows that the extent of hotspot con-flicts locations is higher in Scenario I than in Scenario II. This is explained by the longer queues that vehicles experi-ence due to red signal both in main roads and minor roads.
Table 2. Summary results of alternative roundabout Scenario II
Vehicles Pollutants 9 bicycles [bph]Baseline Bicycles [bph]
9 30 60 90 120 150 180 210 240 270 Motor vehicles CO2 [kg] 173 172 171 168 168 167 163 163 161 159 157 CO [g] 227 233 233 229 229 229 225 224 222 219 217 NOx [g] 511 508 508 500 501 499 490 489 486 479 475 HC [g] 8.5 8.2 8.2 8.0 8.0 8.0 7.8 7.8 7.7 7.6 7.5 CO2 [g/km] 260 193 195 196 198 200 201 201 203 203 205 Stops [No] 928 107 111 106 195 197 199 200 200 202 204
Travel time [s/veh] 48.1 39.1 39.4 39.6 39.9 40.3 40.4 40.5 47.4 41.3 41.3
Speed (average) [km/h] 44.5 51.1 50.8 50.6 50.3 49.9 49.7 49.6 49.2 48.9 48.8
Bicycles
Stops [No] 4 1 0 1 3 3 4 4 6 8 11
Travel time [s/veh] 94.1 94.4 94.6 94.6 95.7 96.1 95.1 96.4 96.8 94.3 97.5
Speed (average) [km/h] 20.0 22.2 21.8 22.3 22.4 21.6 21.6 21.6 21.4 21.4 21.3 Safety Conflicts [No] 81 19 21 24 22 32 31 35 36 37 41 TTC [s] 1.14 1.15 1.11 1.11 1.08 1.08 0.98 1.06 1.03 1.03 1.03 PET [s] 1.61 1.40 1.23 1.30 1.13 1.18 1.03 1.08 1.04 1.06 1.05 MaxS [m/s] 6.39 6.72 7.84 8.30 8.90 8.78 9.52 9.61 9.53 9.63 9.64 DeltaS [m/s] 5.28 4.94 4.85 4.83 5.01 4.93 4.88 4.96 5.11 4.78 5.13 DR [m/s2] –2.31 –2.17 –2.57 –2.52 –2.48 –2.44 –2.54 –2.61 –2.73 –2.60 –2.46
The implementation of the roundabout also was effective in eliminating the traffic conflicts at the exits of the in-tersection.
Overall, three main conclusions can be drawn from above-mentioned results: (1) two-roundabout improved traffic performance and some pollutant emissions at the selected intersection regardless of the number of bicy-cle users; (2) safety benefits of this layout were less pro-nounced under high-bicycle demands; and (3) increasing the number of bicycle users resulted in a degradation of traffic and cyclist’s operations from a certain level of de-mand. With these concerns in mind, the research team decided to develop a multi-objective analysis to search the optimal number of bicycles to improve emissions and safety variables for the best intersection solution (two-lane roundabout).
2.4. Multi-objective optimization
The literature review has shown that, at least for bicycles, it is unclear if roundabouts represent better safety per-formance than intersections (Sakshaug et al. 2010; Jensen 2013). Specifically, this paper represented a multi-objec-tive perspecmulti-objec-tive to find the balance among traffic perfor-mance, emissions and safety outputs.
Thus, thus section presents the main multi-objective results for the alternative scenario. Preliminary analysis of genetic algorithm showed that 100 iterations were suffi-cient to reach convergence of the optimal bicycle demand solutions. In addition, the crossover and mutation were set at 90 and 15% respectively.
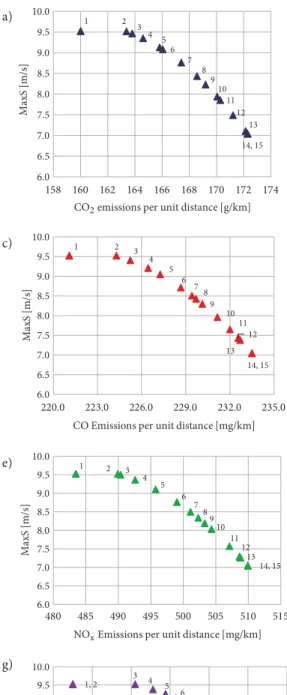
The multi-objective resulted solutions from this scenar-io are illustrated in Figure 5 that shows the Pareto fronts estimated from final population (after 100 generations).
For this Scenario II, two dimensions were CO2, CO, NOx,
and HC emissions (x-axis), and MaxS and the inverse of the TTC (y-axis) were drawn based on bicycles numbers. It is to be noted that the unit of TTC is defined in inverse second (s–1) because longer TTC represents less severe
conflicts. In Figure 5 for each level of bicycle demand, a two-dimensional Pareto frontier with two objective func-tions – emissions (x-axis), and safety measure (y-axis) – is defined. Data labels indicate the set of points that repre-sent optimal solutions as bicycle demand value. Clearly, the trade-off between outputs was observed. The optimal solutions, which minimized vehicular emissions were allo-cated to the upper-left, while the optimal bicycle demand values, which led to the minimal conflict severity and potential crashes were assigned lower-right. For instance, adopting a solution number 8 (bicycle demand of 74 bph), from Figure 5a, which is closest to the abscissa of the graph will conduct to 2.3% of CO2 decreases and 31.5% increase in MaxS, compared to traffic light solution (baseline with 9 bph). Moreover, adopting a solution number 8 (bicy-cle demand of 68 bph), from Figure 5f, will be conducted to 1.8% of NOx decreases and 4.9% increase in 1/TTC,
compared to traffic light solution (baseline with 9 bph). Other optimal solutions also suggested 90, 120 or 125 bph to achieve a good balance between emissions and safety. The results also confirmed that the differences in the optimal bicycle demands were very small between global (CO2) and local (CO, NOx and HC) pollutants, or between
safety parameters. Some solutions were found at 75, 95 and 110 bph that seems to represent the better compro-mise to assure good levels of comfort for bicycles and re-duce pollutant emissions.
Summary results of multi-objective solutions for alter-native roundabout Scenario II presented in Table 3.
Figure 4. Hot spot conflicts location for the baseline (a) and roundabout (b) scenarios: crossing conflicts – red colour; lane change – blue colour; rear end – yellow colour
Conclusions
This paper addressed the impact of bicycle demand at a three-leg signalized intersection on traffic performance, vehicular emissions and safety. In addition, the paper proposed a solution for the intersection by replacing
ex-isting traffic light for a two-lane roundabout and compare the results between layouts subjected to increments in the number of bicycle users (and decrease in the num-ber of motor vehicles based on occupancy ratio). Finally, a multi-objective genetic algorithm was used to improve site-specific emissions and safety outcomes.
Figure 5. The approximate final Pareto front for alternative Scenario II: a – CO2, MaxS; b – CO2, 1/TTC; c – CO, MaxS; d – CO, 1/TTC; e – NOx, MaxS; f – NOx, 1/TTC; g – HC, MaxS; h – HC, 1/TTC
14, 15 13 12 11 10 9 8 7 6 5 4 3 2 1 6.0 6.5 7.0 7.5 8.0 8.5 9.0 9.5 10.0 158 160 162 164 166 168 170 172 174 Ma xS [m/ s]
CO2emissions per unit distance [g/km]
14, 15 13 12 11 10 9 8 7 6 5 4 3 2 1 0.865 0.885 0.905 0.925 0.945 0.965 155 157 159 161 163 165 167 169 171 173 1/T TC [s ] –1 14, 15 13 12 11 10 9 8 7 6 5 4 3 2 1 6.0 6.5 7.0 7.5 8.0 8.5 9.0 9.5 10.0 220.0 223.0 226.0 229.0 232.0 235.0 Ma xS [m/ s] 14, 15 13 12 11 10 9 8 7 6 5 4 3 2 1 0.865 0.885 0.905 0.925 0.945 0.965 217 220 223 226 229 232 235
CO Emissions per unit distance [mg/km]
14, 15 13 12 11 10 9 8 7 6 5 4 3 2 1 6.0 6.5 7.0 7.5 8.0 8.5 9.0 9.5 10.0 480 485 490 495 500 505 510 515 Ma xS [m /s]
NOxEmissions per unit distance [mg/km]
13 14, 15 12 11 10 9 8 7 6 5 4 3 1, 2 0.865 0.885 0.905 0.925 0.945 0.965 475 480 485 490 495 500 505 510 14, 15 13 12 11 10 9 8 7 6 5 4 3 1, 2 6.0 6.5 7.0 7.5 8.0 8.5 9.0 9.5 10.0 7.6 7.7 7.8 7.9 8.0 8.1 8.2 Ma xS [m/ s]
HC Emissions per unit distance [mg/km]
14, 15 12, 13 11 10 9 8 7 6 5 4 3 2 1 0.865 0.885 0.905 0.925 0.945 0.965 7.5 7.6 7.7 7.8 7.9 8.0 8.1 8.2 CO2emissions per unit distance [g/km]
CO Emissions per unit distance [mg/km]
HC Emissions per unit distance [mg/km]
a) b) c) d) e) f) g) h) 1/T TC [s ] –1 1/T TC [s ] –1 1/T TC [s ] –1
Table 3. Summary results of multi-objective solutions for alternative roundabout Scenario II No demand Bicycle [bph] CO2 [g/km] MaxS [m/s] Bicycle demand [bph] CO [mg/km] MaxS [m/s] Bicycle demand [bph] NOx [mg/km] MaxS [m/s] Bicycle demand [bph] HC [mg/km] MaxS [m/s] 1 270 160 9.5 270 221.1 9.5 270 483 9.5 270 7.6 9.5 2 164 163 9.5 165 224.3 9.5 162 490 9.5 270 7.6 9.5 3 157 164 9.5 149 225.2 9.4 165 490 9.5 165 7.8 9.5 4 143 165 9.4 128 226.4 9.2 144 493 9.4 147 7.9 9.4 5 122 166 9.1 115 227.3 9.0 120 496 9.1 133 7.9 9.3 6 118 166 9.1 91 228.7 8.7 94 499 8.8 123 7.9 9.1 7 94 167 8.8 78 229.4 8.5 78 501 8.5 101 8.0 8.9 8 74 169 8.4 73 229.7 8.4 69 502 8.3 82 8.0 8.6 9 63 169 8.2 66 230.1 8.3 61 503 8.2 79 8.0 8.5 10 44 170 7.9 49 231.1 8.0 53 504 8.0 69 8.0 8.4 11 48 170 7.9 34 232.0 7.7 31 507 7.6 51 8.1 8.0 12 28 171 7.5 25 232.6 7.4 19 509 7.3 18 8.2 7.3 13 12 172 7.1 23 232.7 7.4 18 509 7.3 20 8.2 7.3 14 9 172 7.0 9 233.7 7.0 9 510 7.0 9 8.2 7.0 15 9 172 7.0 9 233.7 7.0 9 510 7.0 9 8.2 7.0 No demand Bicycle [bph] CO2 [g/km] 1/TTC [s–1] Bicycle demand [bph] CO [mg/km] 1/TTC [s–1] Bicycle demand [bph] NOx [mg/km] 1/TTC [s–1] Bicycle demand [bph] HC [mg/km] 1/TTC [s–1] 1 270 157 0.967 270 218.1 0.967 270 476 0.967 270 7.5 0.967 2 165 163 0.967 165 224.3 0.967 270 476 0.967 165 7.8 0.967 3 151 164 0.963 161 224.5 0.966 165 490 0.967 149 7.9 0.962 4 141 165 0.956 130 226.3 0.955 140 493 0.959 120 7.9 0.950 5 131 165 0.955 104 227.9 0.942 127 495 0.954 103 8.0 0.942 6 114 166 0.948 97 228.3 0.939 112 497 0.947 83 8.0 0.930 7 97 167 0.938 89 228.8 0.934 95 499 0.938 72 8.0 0.923 8 90 168 0.935 83 229.6 0.942 68 502 0.920 58 8.1 0.913 9 73 169 0.923 75 229.1 0.930 54 504 0.909 42 8.1 0.900 10 69 169 0.920 53 230.9 0.908 31 507 0.890 31 8.1 0.890 11 56 170 0.911 43 231.5 0.901 25 508 0.884 29 8.1 0.888 12 47 170 0.903 22 232.7 0.881 20 508 0.880 18 8.2 0.878 13 26 171 0.886 15 233.1 0.875 10 510 0.870 18 8.2 0.878 14 9 172 0.869 9 233.5 0.869 9 510 0.869 9 8.2 0.869 15 9 172 0.869 9 233.5 0.869 9 510 0.869 9 8.2 0.869
The findings showed a reduction in emissions (from 6 to 9%, depending on the pollutant) by increasing the number of bicycle users from 9 to 270 for signalized intersection, while bicycle travel time increased from 94.1 to 105.5 s. The conversion of traffic lights by a two-lane roundabout lead to a significant reduction in CO2, NOx and HC criteria
regardless of the bicycle demand scenario. The proposed layout also reduces the number of vehicle stops and traf-fic conflicts, but this was not hold for surrogate measures (more severe conflicts and potential crashes in roundabout solution). The multi-objective analysis suggested that opti-mal bicycle demand solutions of 75, 95 and 110 bph dic-tated a good compromise between global and local pollut-ants, and the inverse of TTC and MaxS safety variables to
assure comfort levels for all road users in the roundabout. The main contributions of this paper were the following: – to understand suitable bicycle demand values at in-tersections to assure a good balance among traffic performance, emissions and safety outputs;
– to include conflict and potential crash severities cri-teria to account site specific safety concerns; – to identify the trade-off among environmental, delay
and bicycle safety outcomes;
– to provide some design principles for transportation planners and local governments (e.g., intersection layout, bicycle demand, traffic demand or speed) to mitigate the mutual effect of drivers and cyclists on intersection operations.
Although this study provides a multi-objective tool to assess the safety of cyclists, traffic performance and emis-sions with varied levels of bicycles demand at intersec-tions, there are some limitations that must be highlighted. Different traffic volumes, speed limits, type of intersection or roundabout design features may result in different safe-ty outcomes. The paper did not include illegal manoeu-vres of drivers or cyclists, and pedestrians’ presence that can decrease the performance of roundabout. Lastly, the simulation has some limitations in representing cycling and shared space situations. For example, VISSIM allows modelling cyclists using a similar behaviour models as for motor vehicle traffic, simply adapting the parameters of the vehicle behaviour models to reflect the lower speeds of bicycles; this may be not work for all conditions, since cyclists have unique characteristics that are difficult or impossible to represent with model car following models. This should be improved in future work.
Acknowledgements
This work was supported by FEDER Funds and by Na-tional Funds through FCT – Portuguese Science and Technology Foundation within the Strategic Project UID-EMS-00481-2013.
The authors also acknowledge to the project PTDC/ EMS-TRA/0383/2014, that was funded within the project 9471-Reinforcement of DI and co-founded by FEDER founds.
Paulo Fernandes acknowledges the support of the Portuguese Science and Technology Foundation (FCT) – Scholarship SFRH/BD/87402/2012.
References
ACAP. 2014. Estatísticas do Sector Automóvel: edição 2011. As-sociação Automóvel De Portugal (ACAP), Lisboa, Portugal. Available from Internet: http://www.acap.pt (in Portugese). AlRajie, H. 2015. Investigation of Using Microscopic Traffic
Simu-lation Tools to Predict Traffic Conflicts Between Right-Turning Vehicles and Through Cyclists at Signalized Intersections: MSc Thesis. Carleton University, Ottawa, Ontario, Canada. 85 p.
https://doi.org/10.22215/etd/2015-11179
Anya, A. R.; Rouphail, N. M.; Frey, H. C.; Liu, B. 2013. Method and case study for quantifying local emissions impacts of a transportation improvement project involving road re-align-ment and conversion to a multi-lane roundabout, in Trans-portation Research Board 92nd Annual Meeting, 13–17 Janu-ary 2013, Washington, DC, US, 1–22.
Bai, Q.; Labi, S.; Sinha, K. C. 2012. Trade-off analysis for mul-tiobjective optimization in transportation asset management by generating Pareto frontiers using extreme points nondom-inated sorting genetic algorithm II, Journal of Transportation Engineering 138(6): 798–808.
https://doi.org/10.1061/(ASCE)TE.1943-5436.0000369
Barth, M.; Boriboonsomsin, K. 2008. Real-world carbon dioxide impacts of traffic congestion, Transportation Research Record: Journal of the Transportation Research Board 2058: 163–171.
https://doi.org/10.3141/2058-20
Bastos Silva, A. M. C.; Seco, Á. J. 2012. Dimensionamento de Ro-tundas – Documento Síntese. INIR – Instituto de Infraestru-turas Rodoviárias, Portugal. 50 p. (in Portuguese).
Brilon, W. 2016. Safety of roundabouts: international overview, in Transportation Research Board 95th Annual Meeting, 10–14 January 2016, Washington, DC, US, 1–17.
Buisson, C.; Daamen, W.; Punzo, V.; Wagner, P.; Montanino, M.; Ciuffo, B. 2014. Calibration and validation principles, in W. Daamen, C. Buisson, S. P. Hoogendoorn (Eds.), Traffic Simu-lation and Data: Validation Methods and Applications, 89–118. Coelho, M. C.; Farias, T. L.; Rouphail, N. M. 2006. Effect of roundabout operations on pollutant emissions, Transporta-tion Research Part D: Transport and Environment 11(5): 333– 343. https://doi.org/10.1016/j.trd.2006.06.005
Coelho, M. C.; Farias, T. L.; Rouphail, N. M. 2005. Impact of speed control traffic signals on pollutant emissions, Trans-portation Research Part D: Transport and Environment 10(4): 323–340. https://doi.org/10.1016/j.trd.2005.04.005
Coelho, M. C.; Frey, H. C.; Rouphail, N. M.; Zhai, H.; Pelk-mans, L. 2009. Assessing methods for comparing emissions from gasoline and diesel light-duty vehicles based on micro-scale measurements, Transportation Research Part D: Trans-port and Environment 14(2): 91–99.
https://doi.org/10.1016/j.trd.2008.11.005
Deb, K.; Pratap, A.; Agarwal, S.; Meyarivan, T. 2002. A fast and elitist multiobjective genetic algorithm: NSGA-II, IEEE Transactions on Evolutionary Computation 6(2): 182–197.
https://doi.org/10.1109/4235.996017
Dowling, R.; Skabardonis, A.; Alexiadis, V. 2004. Traffic Analysis Toolbox Volume III: Guidelines for Applying Traffic Microsimu-lation Modeling Software. Publication No FHWA-HRT-04-040. US Department of Transportation, Federal Highway Admin-istration, Washington, DC, US. 146 p. Available from Inter-net: https://ops.fhwa.dot.gov/trafficanalysistools/tat_vol3
DTMR. 2018. Cycling Benefits. Department of Transport and Main Roads (DTMR), Queensland Government, State of Queensland. Available from Internet: http://www.tmr.qld.gov. au/Travel-and-transport/Cycling/Benefits.aspx
EPA. 2002. Methodology for Developing Modal Emission Rates for EPA’s Multi-Scale Motor Vehicle and Equipment Emis-sion System. EPA420-R-02-027. United States Environ-mental Protection Agency (EPA). 286 p. Available from
Internet: https://nepis.epa.gov/Exe/ZyPDF.cgi/P10022SD.
PDF?Dockey=P10022SD.PDF
Fernandes, P.; Fontes, T.; Pereira, S. R.; Rouphail, N. M.; Coe-lho, M. C. 2015. Multicriteria assessment of crosswalk loca-tion in urban roundabout corridors, Transportaloca-tion Research Record: Journal of the Transportation Research Board 2517: 37–47. https://doi.org/10.3141/2517-05
Gettman, D.; Pu, L.; Sayed, T.; Shelby, S. 2008. Surrogate Safety Assessment Model and Validation: Final Report. Publication No FHWA-HRT-08-051. US Department of Transporta-tion, Federal Highway AdministraTransporta-tion, Washington, DC, US. 324 p. Available from Internet: https://www.fhwa.dot.gov/ publications/research/safety/08051
Götschi, T.; Garrard, J.; Giles-Corti, B. 2016. Cycling as a part of daily life: a review of health perspectives, Transport Reviews 36(1): 45–71. https://doi.org/10.1080/01441647.2015.1057877
Gross, F.; Lyon, C.; Persaud, B.; Srinivasan, R. 2013. Safety ef-fectiveness of converting signalized intersections to rounda-bouts, Accident Analysis & Prevention 50: 234–241.
https://doi.org/10.1016/j.aap.2012.04.012
Hale, D. 1997. How many NETSIM runs are enough?, McTrans Newsletter 11(3): 4–5.
Haworth, N.; Debnath, A. K. 2013. How similar are two-unit bi-cycle and motorbi-cycle crashes?, Accident Analysis & Prevention 58: 15–25. https://doi.org/10.1016/j.aap.2013.04.014
Huang, F.; Liu, P.; Yu, H.; Wang, W. 2013. Identifying if VISSIM simulation model and SSAM provide reasonable estimates for field measured traffic conflicts at signalized intersections, Ac-cident Analysis & Prevention 50: 1014–1024.
https://doi.org/10.1016/j.aap.2012.08.018
Hurley, T. J.; Kalus, B. 2007. Timely solutions for reducing con-gestion and improving air quality, in Managing Concon-gestion – Can We Do Better? ITE 2007 Technical Conference and Ex-hibit, 25–28 March 2007, San Diego, CA, US, 1–12.
Jensen, S. U. 2013. Safety effects of converting intersections to roundabouts, Transportation Research Record: Journal of the Transportation Research Board 2389: 22–29.
https://doi.org/10.3141/2389-03
Kaplan, S.; Nielsen, T. A. S.; Prato, C. G. 2016. Youth walking and cycling: the relationship between active travel and urban form, in Transportation Research Board 95th Annual Meeting, 10–14 January 2016, Washington, DC, US, 1–18.
Khaki, A. M.; Haghighat Pour, P. J. 2014. The impacts of traffic signal timings optimization on reducing vehicle emissions and fuel consumption by Aimsun and Synchro software’s (case study: Tehran intersections), International Journal of Civil and Structural Engineering 5(2): 144–154.
Konak, A.; Coit, D. W.; Smith, A. E. 2006. Multi-objective opti-mization using genetic algorithms: a tutorial, Reliability En-gineering & System Safety 91(9): 992–1007.
https://doi.org/10.1016/j.ress.2005.11.018
Li, J.-Q.; Wu, G.; Zou, N. 2011. Investigation of the impacts of signal timing on vehicle emissions at an isolated intersection, Transportation Research Part D: Transport and Environment 16(5): 409–414. https://doi.org/10.1016/j.trd.2011.03.004
Mok, S. J.; Kim, E. C.; Heo, H. B. 2013. A study on efficient man-agement of bicycle traffic flow at four-legged intersections, International Journal of Highway Engineering 15(3): 177–189 (in Korean). https://doi.org/10.7855/ijhe.2013.15.3.177
Moussouni, F.; Brisset, S.; Brochet, P. 2007. Some results on the design of brushless DC wheel motor using SQP and GA, In-ternational Journal of Applied Electromagnetics and Mechanics 26(3–4): 233–241. https://doi.org/10.3233/JAE-2007-913
Nguyen, P. T. M.; Passow, B. N.; Yang, Y. 2016. Improving any-time behavior for traffic signal control optimization based on NSGA-II and local search, in 2016 International Joint Confer-ence on Neural Networks (IJCNN), 24–29 July 2016, Vancou-ver, BC, Canada, 4611–4618.
https://doi.org/10.1109/ijcnn.2016.7727804
NHTSA. 2017. Traffic Safety Facts 2015: a Compilation of Motor Vehicle Crash Data from the Fatality Analysis Reporting Sys-tem and the General Estimates SysSys-tem. DOT HS 812 384. Na-tional Highway Traffic Safety Administration (NHTSA), US Department of Transportation, Washington, DC, US. 238 p. Available from Internet: https://crashstats.nhtsa.dot.gov/Api/ Public/ViewPublication/812384
Papson, A.; Hartley, S.; Kuo, K.-L. 2012. Analysis of emissions at congested and uncongested intersections with motor vehicle emission simulation 2010, Transportation Research Record: Journal of the Transportation Research Board 2270: 124–131.
https://doi.org/10.3141/2270-15
PO SEUR. 2016. U-Bike Project Portugal: Promotion of Elec-tric and Regular Bikes in Academic Communities. PO-SEUR-07-2015-31. PO SEUR – Operational Programme for Sustainability and Efficient Use of Resources. Available from Internet: https://poseur.portugal2020.pt/en/applications/calls-for-applications/poseur-07-2015-31-u-bike-project-portugal
PTV. 2011. VISSIM 5.30-05 User Manual. Planung Transport Verkehr (PTV) AG, Karlsruhe, Germany. 680 p.
Pucher, J.; Buehler, R. 2008. Making cycling irresistible: lessons from the Netherlands, Denmark and Germany, Transport Re-views 28(4): 495–528.
https://doi.org/10.1080/01441640701806612
Pucher, J.; Buehler, R.; Seinen, M. 2011. Bicycling renaissance in North America? An update and re-appraisal of cycling trends and policies, Transportation Research Part A: Policy and
Prac-tice 45(6): 451–475. https://doi.org/10.1016/j.tra.2011.03.001
Ramadurai, G. 2015. Strategies for traffic signal control in Indian cities, in 2015 7th International Conference on Communica-tion Systems and Networks (COMSNETS), 6–10 January 2015, Bangalore, India, 1–4.
https://doi.org/10.1109/comsnets.2015.7098735
Salamati, K.; Coelho, M. C.; Fernandes, P. J.; Rouphail, N. M.; Frey, H. C.; Bandeira, J. 2013. Emissions estimation at mul-tilane roundabouts: effects of movement and approach lane, Transportation Research Record: Journal of the Transportation
Research Board 2389: 12–21. https://doi.org/10.3141/2389-02
Salamati, K.; Rouphail, N. M.; Frey, H. C.; Liu, B.; Schroeder, B. J. 2015. Simplified method for comparing emissions in rounda-bouts and at signalized intersections, Transportation Research Record: Journal of the Transportation Research Board 2517: 48–60. https://doi.org/10.3141/2517-06
Sakshaug, L.; Laureshyn, A.; Svensson, Å.; Hydén, C. 2010. Cy-clists in roundabouts – different design solutions, Accident Analysis & Prevention 42(4): 1338–1351.
https://doi.org/10.1016/j.aap.2010.02.015
Schoon, C.; Van Minnen, J. 1994. The safety of roundabouts in the Netherlands, Traffic Engineering & Control 35(3): 142– 148.
Schultz, G. G.; Mineer, S. T.; Eggett, D. L. 2015. Carousel meth-od: reliable method for collecting average vehicle occupancy data for multilane freeways, Transportation Research Record: Journal of the Transportation Research Board 2484: 165–172.
https://doi.org/10.3141/2484-18
Stevanovic, A.; Stevanovic, J.; So, J.; Ostojic, M. 2015. Multi-criteria optimization of traffic signals: mobility, safety, and environment, Transportation Research Part C: Emerging
Tech-nologies 55: 46–68. https://doi.org/10.1016/j.trc.2015.03.013
Van Hout, K. 2008. Annex I: Literature Search Bicycle Use and Influencing Factors in Europe. EIE-Programme 05/016 Intel-ligent Energy Europe. BYPAD Consortium. 31 p. Available
from Internet: http://bypad.org/docs/Annex_I_literature_
search_bicycle_use_and_influencing_factors.pdf
Widdel, H.; Kaster, J. 1981. Eye movement measurement in the assessment and training of visual performance, in J. Moraal, K.-F. Kraiss (Eds.). Manned Systems Design: Methods, Equip-ment, and Applications, 251–270.
https://doi.org/10.1007/978-1-4613-3306-7_11
Zhang, Y.; Chen, X.; Zhang, X.; Song, G.; Hao, Y.; Yu, L. 2009. Assessing effect of traffic signal control strategies on vehicle emissions, Journal of Transportation Systems Engineering and Information Technology 9(1): 150–155.
https://doi.org/10.1016/s1570-6672(08)60050-1
Zhou, Z.; Cai, M. 2014. Intersection signal control multi-ob-jective optimization based on genetic algorithm, Journal of Traffic and Transportation Engineering (English Edition) 1(2): 153–158. https://doi.org/10.1016/S2095-7564(15)30100-8
![Table 3. Summary results of multi-objective solutions for alternative roundabout Scenario II No Bicycle demand [bph] CO 2 [g/km] MaxS [m/s] Bicycle demand [bph] [mg/km]CO MaxS [m/s] Bicycle demand [bph] NO x [mg/km] MaxS [m/s] Bicycle demand [](https://thumb-eu.123doks.com/thumbv2/123dok_br/16037633.1104981/10.871.69.787.115.844/summary-objective-solutions-alternative-roundabout-scenario-bicycle-bicycle.webp)