Model and Scenario Variations in Predicted
Number of Generations of
Spodoptera litura
Fab. on Peanut during Future Climate
Change Scenario
Mathukumalli Srinivasa Rao*, Pettem Swathi, Chitiprolu Anantha Rama Rao,
K. V. Rao, B. M. K. Raju, Karlapudi Srinivas, Dammu Manimanjari, Mandapaka Maheswari
Central Research Institute for Dryland Agriculture (CRIDA), Hyderabad, India
Abstract
The present study features the estimation of number of generations of tobacco caterpillar, Spodoptera litura. Fab. on peanut crop at six locations in India using MarkSim, which pro-vides General Circulation Model (GCM) of future data on daily maximum (T.max), minimum (T.min) air temperatures from six models viz., BCCR-BCM2.0, CNRM-CM3, CSIRO-Mk3.5, ECHams5, INCM-CM3.0 and MIROC3.2 along with an ensemble of the six from three emis-sion scenarios (A2, A1B and B1). This data was used to predict the future pest scenarios fol-lowing the growing degree days approach in four different climate periods viz., Baseline-1975, Near future (NF) -2020, Distant future (DF)-2050 and Very Distant future (VDF)— 2080. It is predicted that more generations would occur during the three future climate peri-ods with significant variation among scenarios and models. Among the seven models, 1–2 additional generations were predicted during DF and VDF due to higher future temperatures in CNRM-CM3, ECHams5 & CSIRO-Mk3.5 models. The temperature projections of these models indicated that the generation time would decrease by 18–22% over baseline. Analy-sis of variance (ANOVA) was used to partition the variation in the predicted number of gen-erations and generation time ofS. lituraon peanut during crop season. Geographical location explained 34% of the total variation in number of generations, followed by time peri-od (26%), mperi-odel (1.74%) and scenario (0.74%). The remaining 14% of the variation was ex-plained by interactions. Increased number of generations and reduction of generation time across the six peanut growing locations of India suggest that the incidence ofS. lituramay increase due to projected increase in temperatures in future climate change periods.
Introduction
The recent report of the Intergovernmental Panel on Climate Change (IPCC) reconfirmed that earth’s surface temperature has increased by 0.78°C (0.72°C to 0.85°C) between the average of OPEN ACCESS
Citation:Srinivasa Rao M, Swathi P, Rama Rao CA, Rao KV, Raju BMK, Srinivas K, et al. (2015) Model and Scenario Variations in Predicted Number of Generations ofSpodoptera lituraFab. on Peanut during Future Climate Change Scenario. PLoS ONE 10(2): e0116762. doi:10.1371/journal.pone.0116762
Academic Editor:Robert B. Srygley, USDA-Agricultural Research Service, UNITED STATES
Received:April 26, 2014
Accepted:December 12, 2014
Published:February 11, 2015
Copyright:© 2015 Srinivasa Rao et al. This is an open access article distributed under the terms of the
Creative Commons Attribution License, which permits unrestricted use, distribution, and reproduction in any medium, provided the original author and source are credited.
Data Availability Statement:All relevant data are available as Supporting Information. Large numbers of software output files (504) were generated during the analysis of 7 models, 3 emission scenarios, 6 locations and 4 periods. Six summary data files and all output files / data sheets (504) are available as Supporting Information files.
the 1850–1990 period and the 2003–2012 period and the amount CO2in the atmosphere has
grown by about 40% over pre-industrial levels. The projected increase in temperature by 2100 was set at 1.8–4°C [1]. The predictions of temperatures vary with models and emission scenari-os [2]. Agriculture is one of the sectors most vulnerable to anticipated climate change. The im-pact of climate change on agricultural production is unlikely to be evenly distributed across regions. However, in low-latitude regions, moderate temperature increases (1–2°C) are likely to have negative yield impacts for major cereals. Warming of more than 3°C would have nega-tive impacts in all regions [3]. The changes in temperature will be uneven during a year and thus will have implications for crop growth and productivity. Increased temperatures can po-tentially affect insect survival, development and population size. Temperature can impact in-sect physiology and development directly or indirectly through the physiology or existence of hosts. Increased temperatures will accelerate the development of insects—possibly resulting in more generations. Low latitude and developing countries are likely to suffer more from agricul-tural effects of global warming, due to their disadvantaged geographical location, greater agri-cultural share in their economies, and limited ability to adapt to climate change. In contrast, crop production in high latitude regions will generally benefit from climate change. Recent global comprehensive estimate for over 100 countries, [4] predicted that global agricultural productivity would fall by 15.9% in the 2080s if global warming continues unabated, with de-veloping countries experiencing a disproportionately larger decline of 19.7% [5]. Several global studies have indicated a loss of 10–40% in crop production in India by the end of the century [6]. Within India, dryland or rainfed agriculture is likely to suffer more because of the projected changes in rainfall and temperature.
Temperature is an important weather variable affecting dryland crops. The last three de-cades have seen a sharp rise mean annual temperature throughout India. Although most dry-land crops tolerate high temperatures, rainfed crops grown duringrabiare vulnerable to changes in minimum temperatures. Analysis of data for the period 1901–2005 by India Meteo-rological Department (IMD) suggests that annual mean temperature for the country as a whole has risen by 0.51°C over the period. Annual mean temperature has been consistently above normal (normal based on period 1961–1990) since 1993. This warming is primarily due to rise in maximum temperature across the country. However, since 1990, minimum temperature is steadily rising and rate of its rise is slightly more than that of maximum temperature [7]. Pro-jections indicate the possibility of loss of 4–5 million tonnes in wheat production with every 1°C rise in temperature throughout the growing period with current land use [8].
Climate change resulting in increased temperature could impact insect pest populations in several complex ways. Temperature can impact insect physiology and development directly or indirectly through the physiology or existence of hosts. Increased temperatures will accelerate the development of many types of insects, possibly resulting in more generations (and crop damage) per year. The rate at which most pests develop is dependent on temperature and every species has a particular‘threshold temperature’above which development can occur, and below which development ceases. As temperature rises, some pest species may be able to com-plete more generations in a year. This effect may be most noticeable in insects with short life-cycles such as aphids and the diamond-back moth [9]. On the other hand, the temporary expo-sure of populations to extremely high temperatures may delay the development of surviving in-dividuals and thus delay the subsequent generation.
Peanut (Arachis hypogaeaL.), also known as groundnut, earthnut and ground bean, is the world’s fourth most important source of edible vegetable oil and the third most important source of vegetable protein. Peanut production is concentrated in Asia (50% of global area and 64% of global production) and Africa (46% of global area and 28% of global production), where the crop is grown mostly by smallholder farmers under rainfed conditions with limited analysis, decision to publish, or preparation of the
manuscript.
inputs. China, India, Nigeria, USA and Myanmar are the major peanut growing countries. India is the second largest producer of peanut in the world with an average annual production of 5.51 million tons (http://faostat.fao.org) from an area of 5.47 million ha. Productivity of pea-nut in India is 1007 kg/ha as against 1522 kg/ha for the world and 3356 kg/ha for China. Elevat-ed carbon dioxide (CO2) was reported to cause significant increase in total biomass at final
harvest of peanut crop but decreased final seed yield in selected cultivars [10]. The crop is at-tacked by many species of insects which cause damage ranging from incidental feeding to near total plant destruction and yield loss [11]. Amongst them, the tobacco armyworm,Spodoptera litura(Fab.) is a major pest which can cause yield losses of 35–55%. Larvae feed gregariously on leaves causing severe defoliation, leaving only midrib veins.
The three emission scenarios viz., A2 (high emissions), A1 (medium emission-normally written A1B) and B1 (low emissions) are based on Green House Gases (GHG) emissions at three magnitudes [12]. Numerous weather generators such as Climate weather generator (Climgen), Weather Generator (WGEN), Long Aston Research Station (LARS-WG), Mark-Sim) are available for synthetic generation of data on weather variables such as temperature and precipitation. Utilization of weather generators has become essential for climate change studies as the GCM output is often given in terms of anomalies at monthly interval. In order to make use of the datasets for crop and pest modelling or prediction studies, it is essential that the information be temporally downscaled using weather generators. MarkSim GCM was de-veloped to simulate weather from known sources of monthly climate data. It combines the spa-tial downscaling of weather data of selected GCMs to the point of interest and temporal downscaling to daily level. It provides six GCM Model results and an ensemble of the six mod-els for three different emission scenarios.
The objective of the present study was to understand the impact of climate change on the number of generations ofS. lituraduring future climate periods across major peanut growing locations in different states across India. In doing so, the study considered projections made using seven GCM model outputs and three different scenarios in order to get an insight in to the uncertainty or variation associated with climate change projections.
Materials and Methods
Future climate data
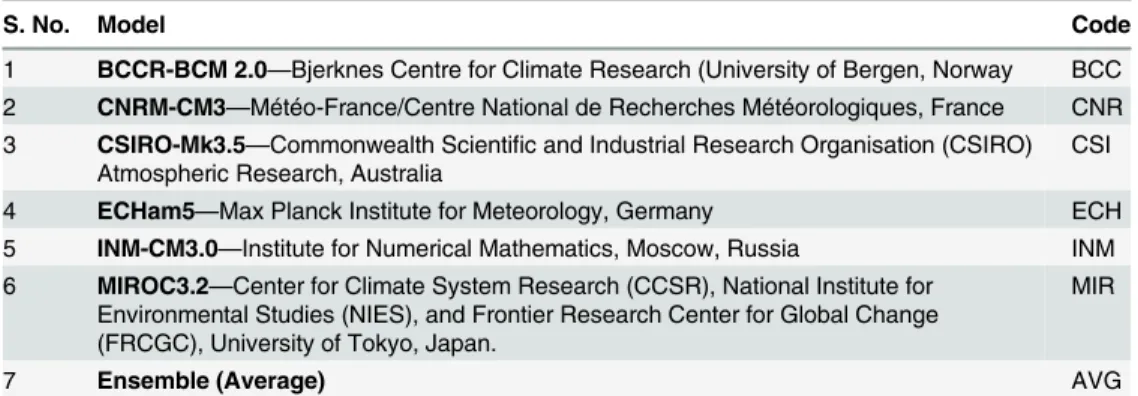
The future data on daily maximum (Tmax), minimum (Tmin) air temperatures, precipitation and radiation was obtained using MarkSim GSM (http://gismap.ciat.cgiar.org/MarkSimGCM). MarkSim typically calculates daily precipitation first and uses this information to guide the other weather variables such as daily solar radiation and maximum and minimum tempera-tures. MarkSim is a spatially explicit daily weather generator that was developed at Internation-al Centre for TropicInternation-al Agriculture (CIAT) and was released in 2004. It uses data from 10,000 stations in Latin America, 7000 in Africa and 4500 in Asia. MarkSim relies on climatic data surface interpolated from weather stations and generates long-term weather records on a grid basis of 18 km × 18 km. Each set of surfaces consists of monthly rainfall totals, monthly average temperature and monthly average diurnal temperature range. Thus the data from six models viz., BCCR-BCM2.0, CNRM-CM3, CSIRO-Mk3.5, ECHams5, INCM-CM3.0 and MIROC3.2 of three, A2, A1B and B1 was obtained. The main features of the six models along with the en-semble (AVG) can be found in another publication [13]. The details of these models and their abbreviations are given in theTable 1.
range of GCMs and scenarios. In this study, we used the projections obtained at a resolution of 0.5 degrees from the original model resolution. The year of simulation was selected and simu-lated data was produced which would simulate the daily weather data representative of average of five years to either side of the year selected (10 year slice) [12]. The temperature data thus obtained were classified into four categoriesviz., Baseline-1975, Near future (NF)- 2020, Dis-tant future (DF)- 2050 and Very DisDis-tant future (VDF)- 2080. The daily data during the crop duration of 133 days from 26thto 44thStandard Weeks were considered for predicting the number of generations and generation time ofS. litura. MarkSim runs on interpolated climate grids to estimate the parameters of the model which produces simulated data files in .WTG for-mat. The output of MarkSim does not represent series of years but replicate of the target year. The climate under particular situation of GCM/ scenario/year was obtained from 20 replicates. The .WTG file consists of data on four weather parameters viz., solar radiation, T.max, T.min and rainfall on daily basis in each replicate. These downloaded .WTG files were post processed to convert into .CSV files using Visual Basic based software‘INGEN’developed at CRIDA. After running the program, .WTG files are converted into 20 separate .CSV (Comma delim-ited) files along with two independent T.max and T.min files with compiled and arranged data of 20 replicates in primary phase. Later, these extracted T.max and T.min files were further processed by using INGEN for estimating the number of generations [14].
Estimation of number of generations of
S. litura
on Peanut
Growing Degree Days (GDD) approach is used to predict the life cycle of insects in the form of number of generations during the season by measuring the growth in terms of temperature over time considering average daily temperatures which influence insect development. Ex-pected number of generations were estimated using‘INGEN’, wherein accumulated thermal degree days were calculated by horizontal cut-off (degree-day accumulations above the upper threshold do not count) method. The software provides data on GT (Generation Time) in days as given above, mean GDD (Mean Growing Degree Days—accumulated degree days to com-plete one generation after reaching cut-off GDD) and Total Degree Days (TDD—total summa-tion of the degree days in a calendar year or crop season).
The standard GDD approach was followed to estimate the number of generations ofS. litura
occurring on peanut during a crop season. The maximum and minimum temperatures were transformed to heat units using the lower threshold temperature (t0) of 10°C forS. lituraon
peanut and the standard method for estimation of the degree days (thermal requirements) for Table 1. Details and Abbreviations of Models.
S. No. Model Code
1 BCCR-BCM 2.0—Bjerknes Centre for Climate Research (University of Bergen, Norway BCC
2 CNRM-CM3—Météo-France/Centre National de Recherches Météorologiques, France CNR
3 CSIRO-Mk3.5—Commonwealth Scientific and Industrial Research Organisation (CSIRO) Atmospheric Research, Australia
CSI
4 ECHam5—Max Planck Institute for Meteorology, Germany ECH
5 INM-CM3.0—Institute for Numerical Mathematics, Moscow, Russia INM
6 MIROC3.2—Center for Climate System Research (CCSR), National Institute for Environmental Studies (NIES), and Frontier Research Center for Global Change (FRCGC), University of Tokyo, Japan.
MIR
7 Ensemble (Average) AVG
each day was calculated by using the formula [15].
H¼SD D
Where:
H¼Numberof heat unittoemergence
D D¼ ðT:maxþT:minÞ=2 t
0
t0¼threshold temperature ¼10
C
The minimum and maximum daily temperatures of different periods (BL, NF, DF and VDF) were used for estimating the accumulated thermal heat units. The number of degree days required for completing life cycle ofS. litura(egg to adult) on peanut was taken as 522.7 DD [16], (www.nappfast.org/databases/) and GT generation time (average development time) needed for completion of one cycle was estimated. The number of generations ofS. litura
was calculated using cumulative degree days (Degree Day Units) for each generation of insect. Number of generations ofS. lituraand its generation time was predicted during entire crop season ranging from 26th–44thstandard week (swk) comprising of 133 days of crop duration across various locations [17]. This computation of degree days is different from that reported earlier in Ziter et al., [18] who accumulated the degree days for the entire calendar year. We considered the crop growth to occur only during the weeks comprising the current growing season in these areas of India. We did not consider that climate change might extend the grow-ing season, as did Ziter et al., and so our results should be considered conservative estimates of the possible impacts of climate change on voltinism.
Statistical analysis
The data on variation in number of generations ofS. lituraacross six locations for the four pe-riodsviz., base, near, distant and very distant future periods were analyzed and the mean num-ber of generations were compared using two-sample t-test assuming equal variances. The variation in the number of generations and generation time was decomposed by subjecting the data to ANOVA to understand the contribution of location, model, scenario and period to the total variation [18]. The sum of squares attributable to each source was divided by the total sum of squares explained by the model to obtain the individual contribution of each source. However, no statistical inference was drawn as the analysis was deterministic in nature. All sta-tistical analyses were done using SPSS version 16.0.
Results
Variation in projected temperatures
is well known that the prediction of future temperature varies with different GCM models across various parts of the world. The documented information on variation of temperature from three emission scenarios among seven models indicated more variation with CNR & ECH models which predicted an increase of 2–2.5°C in the average daily T.max and less with CSI (1.5–2°C) & MIR (1–1.5°C) models at other parts of Africa [20].
Variation among models and scenarios
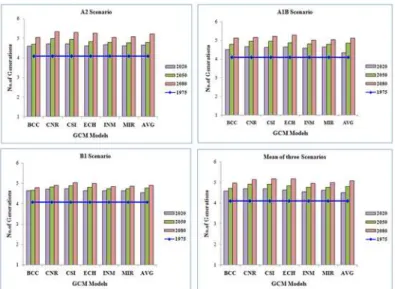
The results on predicted number of generations during three future climate change periods viz., Near, Distant and Very Distant future using seven MarkSim models of three emission sce-narios (A2, A1B & B1) are depicted inFig. 1. In A2 scenario more generations with shortened generation time (4.71 with 26.81 days) are predicted by CNR model relative to the fewer gener-ations and longer generation time predicted by the BCC model (4.59 with 28.02 days) in 2020.
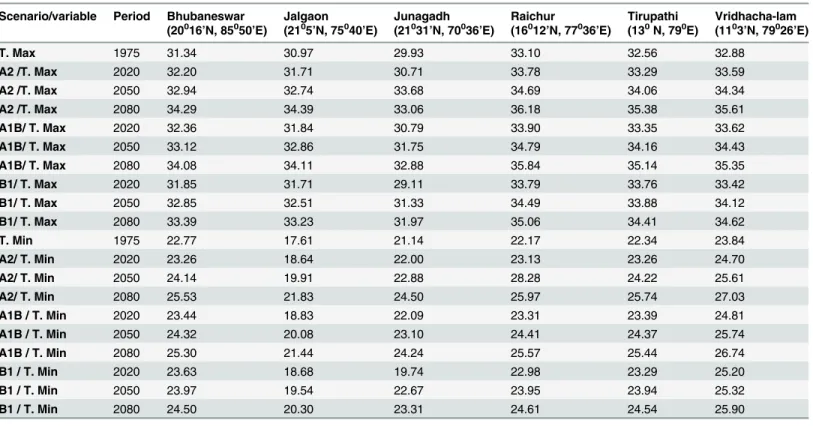
The number of generations significantly increased during DF and VDF periods with CNR model temperature projections. More number of generations with reduced generation time (5.33 with 25.02 days) during VDF periods was predicted by majority of the models. In A1B scenario, more number of generations in crop season are predicted in case of ECH model (5.27 with 25.22 days) as against fewer number of generations with longer duration of generation in INM model (5.01 with 26.73 days) for 2080. In B1 scenario, more number of generations is ex-pected when a temperature projection of CSI model is considered (5.03 with 26.42 days) over Table 2. Variation in annual mean of T.max and T.min of three emission scenarios across six peanut growing locations.
Scenario/variable Period Bhubaneswar
(20016
’N, 85050
’E)
Jalgaon (2105
’N, 75040
’E)
Junagadh (21031
’N, 70036
’E)
Raichur (16012
’N, 77036
’E)
Tirupathi (130N, 790E)
Vridhacha-lam (1103
’N, 79026
’E)
T. Max 1975 31.34 30.97 29.93 33.10 32.56 32.88
A2 /T. Max 2020 32.20 31.71 30.71 33.78 33.29 33.59
A2 /T. Max 2050 32.94 32.74 33.68 34.69 34.06 34.34
A2 /T. Max 2080 34.29 34.39 33.06 36.18 35.38 35.61
A1B/ T. Max 2020 32.36 31.84 30.79 33.90 33.35 33.62
A1B/ T. Max 2050 33.12 32.86 31.75 34.79 34.16 34.43
A1B/ T. Max 2080 34.08 34.11 32.88 35.84 35.14 35.35
B1/ T. Max 2020 31.85 31.71 29.11 33.79 33.76 33.42
B1/ T. Max 2050 32.85 32.51 31.33 34.49 33.88 34.12
B1/ T. Max 2080 33.39 33.23 31.97 35.06 34.41 34.62
T. Min 1975 22.77 17.61 21.14 22.17 22.34 23.84
A2/ T. Min 2020 23.26 18.64 22.00 23.13 23.26 24.70
A2/ T. Min 2050 24.14 19.91 22.88 28.28 24.22 25.61
A2/ T. Min 2080 25.53 21.83 24.50 25.97 25.74 27.03
A1B / T. Min 2020 23.44 18.83 22.09 23.31 23.39 24.81
A1B / T. Min 2050 24.32 20.08 23.10 24.41 24.37 25.74
A1B / T. Min 2080 25.30 21.44 24.24 25.57 25.44 26.74
B1 / T. Min 2020 23.63 18.68 19.74 22.98 23.29 25.20
B1 / T. Min 2050 23.97 19.54 22.67 23.95 23.94 25.32
B1 / T. Min 2080 24.50 20.30 23.31 24.61 24.54 25.90
Maximum Temperature (T. Max) Minimum Temperature (T. Min)
BCC model which predicted—fewer number of generations (4.79) with longer duration of gen-eration (27.91 days) (Figs.1and2).
Percent change in generation time
Our results indicate that the generation time ofS. liturawould decrease in future climate peri-ods over baseline in each emission scenario. The percent reduction of generation time was cal-culated and is depicted inFig. 3. The highest percent change in generation time is predicted during VDF (22.70) followed by DF (16.19) and NF (16.20) future climate change periods across three emission scenarios. Among seven models, the temperature projections of CNR Figure 1. Inter Model and Scenario variation in number of generations ofS. liturain future climate change scenarios.
doi:10.1371/journal.pone.0116762.g001
Figure 2. Inter model and Scenario variation in generation time ofS. liturain future climate change scenarios.
and CSI models indicate that the generation time would shorten by 22.70 and 18.36% respec-tively over baseline. Generation time is expected to be shortened by 5.68 to 22.70% with all seven models at three emission scenarios. Similar trend was reflected even with mean of three emission scenarios (Fig. 3). It is predicted that more generations would occur during all three future climate change periods due to the reduction of generation time.
Variation among scenarios across locations
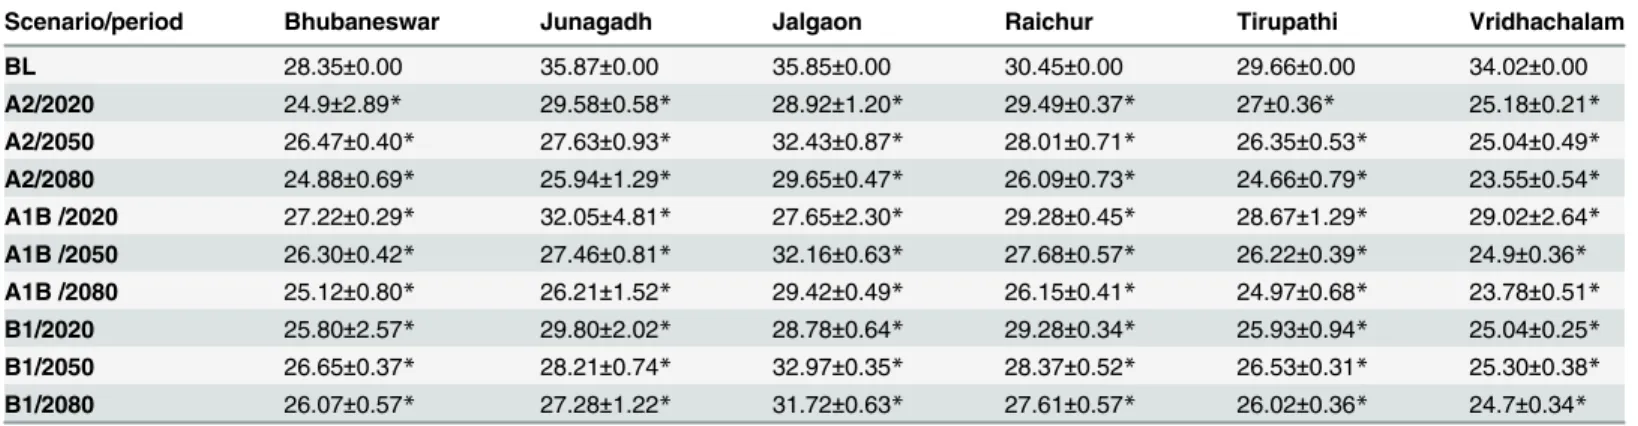
In order to summarize the variation of number of generations and generation time ofS. litura
across six peanut growing locations of the country, the ensemble model data were used and the results are presented in Tables3and4. In A2 scenario among six locations it is predicted that Vridhachalam location would experience higher number of generations ofS. litura(5.61) with reduced generation time (23.55 days) in a crop season during VDF period followed by 5.29 Figure 3. Per cent change in generation time ofS. lituraduring future climate change across 7 models and 3 scenarios.
doi:10.1371/journal.pone.0116762.g003
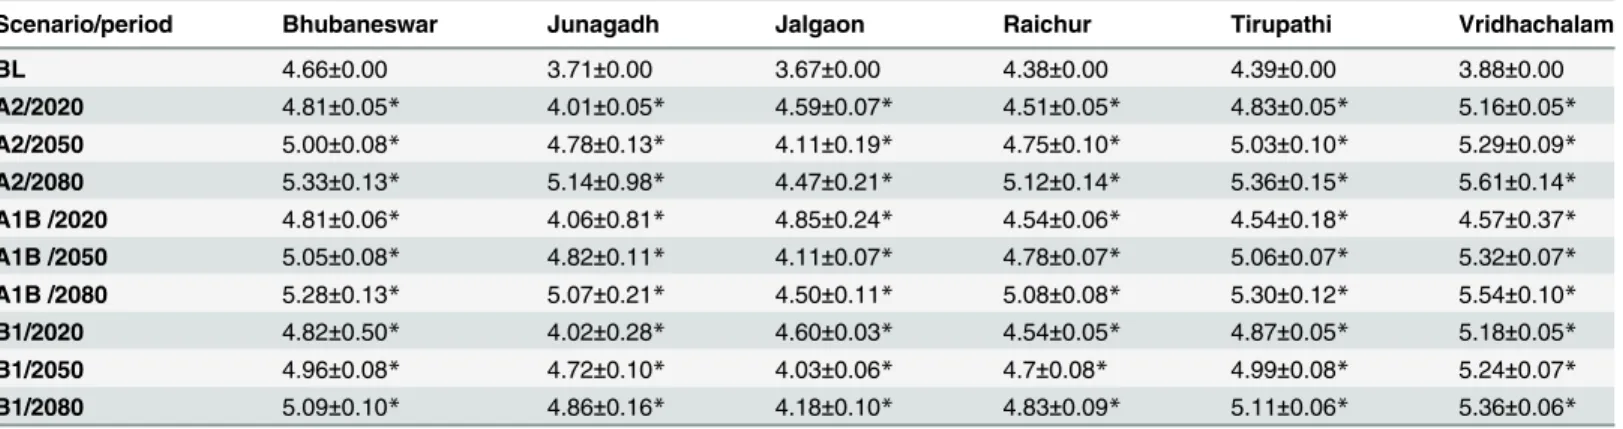
Table 3. Inter Scenario variation in number of generations ofS. liturain future climate change scenarios across peanut growing locations.
Scenario/period Bhubaneswar Junagadh Jalgaon Raichur Tirupathi Vridhachalam
BL 4.66±0.00 3.71±0.00 3.67±0.00 4.38±0.00 4.39±0.00 3.88±0.00
A2/2020 4.81±0.05* 4.01±0.05* 4.59±0.07* 4.51±0.05* 4.83±0.05* 5.16±0.05*
A2/2050 5.00±0.08* 4.78±0.13* 4.11±0.19* 4.75±0.10* 5.03±0.10* 5.29±0.09*
A2/2080 5.33±0.13* 5.14±0.98* 4.47±0.21* 5.12±0.14* 5.36±0.15* 5.61±0.14*
A1B /2020 4.81±0.06* 4.06±0.81* 4.85±0.24* 4.54±0.06* 4.54±0.18* 4.57±0.37*
A1B /2050 5.05±0.08* 4.82±0.11* 4.11±0.07* 4.78±0.07* 5.06±0.07* 5.32±0.07*
A1B /2080 5.28±0.13* 5.07±0.21* 4.50±0.11* 5.08±0.08* 5.30±0.12* 5.54±0.10*
B1/2020 4.82±0.50* 4.02±0.28* 4.60±0.03* 4.54±0.05* 4.87±0.05* 5.18±0.05*
B1/2050 4.96±0.08* 4.72±0.10* 4.03±0.06* 4.7±0.08* 4.99±0.08* 5.24±0.07*
B1/2080 5.09±0.10* 4.86±0.16* 4.18±0.10* 4.83±0.09* 5.11±0.06* 5.36±0.06*
*Indicate the statistical significance compared over baseline (BL) period at p<0.01.
generations of 25.04 days in DF and 5.16 generations of 25.18 days in NF period. In the other two emission scenarios similar trends were found at Vridhachalam location. Lower number of generations is predicted at Jalgaon location (4.77 generations with 29.65 days) during VDF pe-riod followed by 4.11 generations with 32.44 days and 4.01 generations with 29.58 days in DF and NF periods respectively. Similar trends were found from A1B and B1 scenarios as well (Ta-bles3and4).
Partitioned variation
The partitioning of variation in number of generations are depicted inFig. 4. The percentage of variation was in the descending order (from the source of uncertainty that explained the most variance in the results to the least) of geographical location>time period>location and time period interaction>model>scenario. These sources explained on average 34.7, 26.63, 19.07, 1.34 and 0.71% of the variation in the predicted number of generations ofS. lituraduring pea-nut crop season respectively, with the remaining interaction terms explaining a combined 14.15%. Similar trend was noticed in generation time ofS. lituraalso.
Table 4. Inter Scenario variation in generation time ofS. liturain future climate change scenarios across peanut growing locations.
Scenario/period Bhubaneswar Junagadh Jalgaon Raichur Tirupathi Vridhachalam
BL 28.35±0.00 35.87±0.00 35.85±0.00 30.45±0.00 29.66±0.00 34.02±0.00
A2/2020 24.9±2.89* 29.58±0.58* 28.92±1.20* 29.49±0.37* 27±0.36* 25.18±0.21*
A2/2050 26.47±0.40* 27.63±0.93* 32.43±0.87* 28.01±0.71* 26.35±0.53* 25.04±0.49*
A2/2080 24.88±0.69* 25.94±1.29* 29.65±0.47* 26.09±0.73* 24.66±0.79* 23.55±0.54*
A1B /2020 27.22±0.29* 32.05±4.81* 27.65±2.30* 29.28±0.45* 28.67±1.29* 29.02±2.64*
A1B /2050 26.30±0.42* 27.46±0.81* 32.16±0.63* 27.68±0.57* 26.22±0.39* 24.9±0.36*
A1B /2080 25.12±0.80* 26.21±1.52* 29.42±0.49* 26.15±0.41* 24.97±0.68* 23.78±0.51*
B1/2020 25.80±2.57* 29.80±2.02* 28.78±0.64* 29.28±0.34* 25.93±0.94* 25.04±0.25*
B1/2050 26.65±0.37* 28.21±0.74* 32.97±0.35* 28.37±0.52* 26.53±0.31* 25.30±0.38*
B1/2080 26.07±0.57* 27.28±1.22* 31.72±0.63* 27.61±0.57* 26.02±0.36* 24.7±0.34*
*Indicate the statistical significance compared over baseline (BL) period at p<0.01.
doi:10.1371/journal.pone.0116762.t004
Figure 4. Relative proportion of variation in predicted number of generations and generation time of
S. lituraby model, location, period, scenario and others.
Discussion
Temperature is the key factor which influences the growth and development of crop plants and herbivore insect pests and variations in temperature cause significant variation in these. Predic-tion of insect generaPredic-tions is possible by adopting growing degree days approach. PredicPredic-tions of
S. lituradevelopment on peanut were attempted under baseline and expected future climate change (NF, DF and VDF) periods. The accumulated thermal heat units expressed as degree days (DD), the number of generations and mean generation time ofS. liturawere estimated through selection of six representative peanut growing locations of India. The influence of tem-perature on development and survival ofS. liturawould affect the population dynamics of the pest and such influence can be estimated and quantified by calculating the number of genera-tions [21]. The findings of present study indicate that 1–2 additional generations would occur during near and very distant future climate periods at six locations. Significant shortening of generation time resulted in occurrence of more generations at these locations. Number of gen-erations varied among three emission scenarios and was more in A2 scenario (5.61) over A1B (5.54) and B1 (5.36) at Vridhachalam location indicating considerable inter scenario variation. Similar trend was observed at rest of the locations.
It is well known that accelerated development of insects is possible due to increased temper-ature which would result in more generations leading to greater crop losses during the season or year. Prediction of developmental time or mean generation time of insect pests in relation to temperature is an important tool for pest management [22]. Additional generations of multi-voltine insect species (aphids and lepidopterans) are reported at higher temperatures [23]. Many of the lepidopteran species includingS.liturawould produce more generations under in-creased temperature conditions of near and distant future climate change period [21].
Production of more generations in a calendar year or during the crop season with higher temperatures is well known and is more evident with gradual warming [24]. Our studies on number of generations ofS. lituraon peanut in India with temperature data of 6 different mod-els corroborate earlier research indicating that the insects respond to higher temperature with increased rates of development, more generations with less time between generations [25]. CNR and CSI models predicted more generations as they projected higher temperatures in fu-ture climate scenario. An upper threshold temperafu-ture of 37°C [16] was used in the study. The daily mean temperatures during peanut growing period of 133 days considered in this study ranging from 26th–44thstandard week (swk) rarely, if ever exceeds upper threshold tempera-ture. However, if calendar year approach is followed there will be instances when daily mean temperatures exceed upper threshold and in such cases the effects of temperatures higher than upper threshold need to be considered while computing number of generations.
Among different sources of variation, geographical location explained higher percentage of variation (34.7%) followed by period (26.63%) which showed the significant effect of climate change onS. litura. In our study, considerable increase in minimum and maximum tempera-tures across six locations was observed during future periods over present. The interactions be-tween location and period explained 19.07% of the variation. Models and scenarios explained very little of the variation which indicates that the changes in temperature and the resultant changes in number of generations are robust to the choice of model and scenario.
they complete each year. In our findings geographical location explained higher per cent (34) of the total variation in number of generations, followed by time period (26%), model (1.74%) and scenario (0.74%). The remaining 14% of the variation was explained by interactions. We considered one insect pest of peanut whereas Ziter et al., [18] studied 13 insect pests. Further investigations are required after covering the all insect pests of peanut to determine the sensi-tivity of model, scenario, period and location. More variation is expected along the latitudinal gradient across locations indicating warmer temperature. The interaction between location and period indicates that the pest response would be partially period specific.
Significant variation in developmental time, number of generations and thermal require-ments ofS. lituraon peanut with temperature data of six different models was predicted to occur during future climate change period. The present investigations were conducted consid-ering the increase in temperatures alone although other factors such as precipitation, elevated CO2, crop phenology, pest phenology and multi-species interactions including pest—
parasitoid associations under Climate Change scenario [18,26] will also affect the growth and development of insect pests. Complete comprehension of confounding effects of climate change is possible only when this information on influence of other factors is available. The findings of studies using temperature alone are to be taken with these limitations in view.
Supporting Information
S1 Data. Final Data of PLOS ONE under Data Policy.
(RAR)
Author Contributions
Conceived and designed the experiments: MSR CAR. Performed the experiments: PS DM BMK. Analyzed the data: BMK KS CAR. Contributed reagents/materials/analysis tools: KV MM KS. Wrote the paper: MSR PS DM KV.
References
1. IPCC Climate Change (2013) The physical science basis. Summary for policy makers. Contribution of working group I to the fifth assessment. Report of the intergovernmental panel on Climate Change. IPCC Secretariat, WMO, Geneva, Switzerland. pp.3.
2. Krishna Kumar K, Patwardhan SK, Kulkarni A, Kamala K, Rao Koteswara et al. (2011) Stimulated pro-jections for summer monsoon climate over India by a high-resolution regional climatic model (PRECIS). Cur. Sci. 3: 312–326.
3. IPCC 2007 Climate Change (2007) Impacts, Adaptation and Vulnerability. Contribution of Work Group II to the Fourth Assessment Report of the Intergovernmental Panel on Climate. Cambridge, UK: Cam-bridge University Press.
4. Cline W (2007) Global Warming and Agriculture: Impact Estimates by Country. Washington, DC: Cen-ter for Global Development and PeCen-terson Institute for InCen-ternational Economics.
5. Zhai F, Zhuang J (2009) Agricultural Impact of Climate Change: A General Equilibrium Analysis with Special Reference to Southeast Asia. ADBI Working Paper 131. Tokyo: Asian Development Bank In-stitute.http://www.adbi.org/workingpaper/2009/02/23/2887.agricultural.impact.climate.change/.
6. Stern N (2007) The Economics of Climate Change: The Stern Review. Cambridge, UK: Cambridge University Press. doi:10.1017/CBO9780511817434
7. Arora M, Goel NK, Singh P (2005) Evaluation of temperature trends over India. Hydrological Science Journal 50, 81–83. doi:10.1623/hysj.50.1.81.56330
8. Aggarwal PK (2008) Global climate change and Indian agriculture: impacts, adaptation and mitigation. Indian J. Agric. Sci., 78(11), 911–919.
10. Bannayan M, Tojosoler CM, Garcia Y, Garcia A, Guerna LC et al. (2009) Interactive effects of elevated CO2and temperature on growth and development of a short and long season peanut cultivar. Climatic
Change. 93: 389–406. doi:10.1007/s10584-008-9510-1
11. Wightman JA, Ranga Rao GV (1994) Groundnut pests. In: Smartt J, Editor. The Groundnut Crop: A sci-entific Basis for Improvement. Pp. 395–479. Chapman & Hall. doi:10.1007/978-94-011-0733-4_11 12. Jones PG, Thornton PK, Heinke J (2011a) Generating characteristic daily weather data using
down-scaled climate model data from the Intergovernmental Panel on Climate Change (IPCC) Fourth As-sessment.https://hc.box.com/shared/f2gk053td8.
13. Jones PG, Thornton PK, Giron E (2011b) Web application. MarkSimGCM- A weather simulator.http:// gismap.ciat.cgiar.org/MarkSimGCM.
14. Srinivasa Rao M, Rama Rao CA, Raju BMK, Manimanjari D, Srinivas K et al. (2014) Software for esti-mating insect generations using degree-days approach (ingen). National Initiative on Climate Resilient Agriculture (NICRA), Central Research Institute for Dryland Agriculture (CRIDA), Hyderabad 500 059, India.
15. Elsaadany GB, Mariy FM, Abdel A, Wahed MS, Ibrahim MY (2000) The applicability predicting the changes in the population density ofPhthorimaeaoperculella(Zeller). Annals Agriculture science. Sp Issue 4: , 1469–1484.
16. Ranga Rao GV, Wightman JA, Ranga Rao DV (1989) Threshold Temperatures and Thermal Require-ments for the Development of Spodoptera litura (Lepidoptera: Noctuidae). Environ Entomol. 18 (4): 548–551.
17. Srinivasa Rao M, Manimanjari D, Rama Rao CA, Srinivas K, Rao VUM, et al. (2012) Climate driven shifts in the incidence of Spodoptera litura on Groundnut, presented in‘Symposium on Managing Stress in Drylands under Climate Change Scenarios’during December 1–2, 2012–10–25 at CAZRI Jodhpur pp.12–13.
18. Ziter C, Robinson EA, Jonathan NA (2012) Climate change and voltinism in California insect pest spe-cies: sensitivity to location, scenario and climate model choice. Glob Change Biol 18, 2771–2780. doi:
10.1111/j.1365-2486.2012.02748.x
19. Rajib MA, Rahman MM, McBean EA (2011) Global warming in Bangladesh perspective: Temperature projections upto 2100. Proceedings of the Global conference on Global warming 2011, Lisbon, Portu-gal, 2011.
20. Some L, Jalloh A, Zougmore R, Nelson G, Thomas TS (2012) West African Agriculture and Climate Change: A Comprehensive Analysis. International Food Policy Research Institute.
21. Srinivasa Rao M, Rama Rao CA, Vennila S, Manimanjari D, Maheswari M et al. (2014) Estimation of number of generations of Spodoptera litura Fab. On peanut in India during near and distant future cli-mate change scenarios. Sci.Res.Essays. 9(7): 195–203. doi:10.5897/SRE2013.5783
22. Roy M, Brodeur J, Cloutier C (2002) Relationship between temperature and developmental rate of
Stethorus punctillum(Coleoptera: Coccinellidae) and its preyTetranychus mcdannieli(Acarina: Tetra-nychidae). Environ Entomol. 31: 177–187. doi:10.1603/0046-225X-31.1.177
23. Pollard E, Yates TJ (1993) Monitoring Butterflies for Ecology and Conservation. Chapman & Hall, London.
24. Lastuka Z (2008) Climate change and its possible influence on the Occurrence and importance of in-sect pests. Plant Protect Sci. 45: S53–S62.
25. Das DK, Singh J, Vennila S (2011) Emerging Crop Pest Scenario under the impact of Climate Change. J. Agric. Physics. 11: 13–20.
26. Robinson EA, Ryan GD, Newman JA (2012) Tansley review: a meta-analytical review of the effects of elevated CO2 on plant-arthropod interactions highlights the importance of interacting environmental and biological variables. New Phytol. 194: 321–336. doi:10.1111/j.1469-8137.2012.04074.xPMID: