The Effect of Store Image on
Store Loyalty and the
influence of Service Quality
among leading Portuguese
retailers
Beatriz Almeida
Dissertation written under the supervision of
Prof. Paulo Romeiro
Dissertation submitted in partial fulfilment of requirements for the MSc in
Management with specialization in Strategy & Entrepreneurship, at the
Universidade Católica Portuguesa,
iii
ABSTRACT
The Effect of Store Image on Store Loyalty and the influence of Service Quality among leading Portuguese retailers
Helena Beatriz Moura de Almeida
Nowadays, we live in a society deeply characterized by consumption. In order to adapt to this situation businessmen, especially retailers, had to come up with ever increasingly innovative and appealing strategies to engage consumers. Competition is fierce and only the best can, indubitably, increase their market share.
With this study it is intended to sum up the most relevant factors for the consumer in the moment of purchase, in order to respond to the widest range of demands from the market. Therefore, the Butcher’s market was chosen to be analyzed, since meat is one of the cornerstones of any bundle of goods that Portuguese families purchase. This would make these factors overarching to other categories.
With this dissertation it is indented to determine what most contributes to increase the loyalty of consumers to a certain store. In order to do that, the two biggest supermarket chains were compared (Pingo Doce and Continente), since both of them comprehend 44% of the market share, which for the scope of this study, is a big enough sample.
Keywords: Store Image, Store Loyalty, Service Quality, Price, Quality of the products, personal selling
iv
SUMÁRIO
Os Efeitos da Imagem na Lealdade da Loja e a Influência da Qualidade de Serviço nos principais retalhistas Portugueses
Helena Beatriz Moura de Almeida
Atualmente, vivemos numa sociedade extremamente consumidora. Para dar resposta a isso, os comerciantes, em especial os retalhistas, tiveram de apresentar estratégias cada vez mais inovadoras e apelativas para atrair clientes. A concorrência é cada vez maior e só mesmo os melhores é que conseguem, efetivamente, aumentar a sua quota de mercado.
Com este estudo pretende-se agregar os fatores mais relevantes para o consumidor, no momento de decisão de compra, de forma a dar resposta às mais variadas exigências do mercado. Assim sendo, optou-se por analisar a categoria do talho, já que a carne é um dos alimentos mais importantes no cabaz de compras das famílias portuguesas, de forma a ser possível tornar esses fatores transversais a outras categorias.
Com esta dissertação, pretende-se determinar, assim, aquilo que mais contribui para aumentar a lealdade dos consumidores à loja, sendo que, para isso, optou-se por comparar os dois maiores supermercados portugueses, nomeadamente o Continente e o Pingo Doce, dado que, no seu conjunto apresentam, aproximadamente 44% de quota de mercado, o que, para este estudo, representa uma amostra suficiente.
Pavavras-Chave: Imagem da Loja, Lealdade da Loja, Qualidade do Serviço, Preço, Qualidade dos Produtos, Qualidades do colaborador
v
ACKNOWLEDGEMENTS
I would firstly like to express my gratitude to my parents, who have constantly supported me through my academic journey and provided me with the best opportunities and the finest education in order to achieve my professional and personal goals.
I would like to express my appreciation to my supervisor, Professor Paulo Romeiro, for all his patience, insightful advice, flexibility and valuable feedback throughout the entire process.
Additionally, it is also very important for me to express my sincere appreciation and affection to my boyfriend for helping me with everything I needed. His optimism and encouragement were truly important and decisive to complete this dissertation, the final stage of my Masters’ degree.
Last but not least, I am very grateful to Sonae and specially to my business leaders, Ricardo Farinha and Alexandre Garrett, who have demonstrated enormous support and constant availability to help me.
vi TABLE OF CONTENTS ABSTRACT III SUMÁRIO VI ACKNOWLEDGEMENTS V TABLE OF CONTENTS VI
TABLE OF FIGURES VII
TABLE OF TABLES VIII
TABLE OF APPENDICES IX GLOSSARY X CHAPTER 1: INTRODUCTION 1 1.1BACKGROUND ... 1 1.2PROBLEM STATEMENT ... 1 1.3RELEVANCE ... 2 1.4RESEARCH METHODS ... 4 1.5DISSERTATION OUTLINE ... 4
CHAPTER 2: LITERATURE REVIEW AND CONCEPTUAL FRAMEWORK 5 2.2LITERATURE REVIEW ... 5
2.2CONCEPTUAL FRAMEWORK ... 13
CHAPTER 3: METHODOLOGY 12 3.1RESEARCH APPROACH ... 13
3.2RESEARCH STRATEGY ... 13
3.3SECONDARY DATA ANALYSIS ... 13
3.4MESUREMENTS ... 13
CHAPTER 4: RESULTS AND DISCUSSION 20 4.1RESULTS AND DISCUSSION ... 20
CHAPTER 5: CONCLUSIONS AND LIMITATIONS 29 5.1MAIN FINDINGS &CONCLUSIONS ... 29
5.2MANAGERIAL /ACADEMIC IMPLICATIONS ... 31
5.3LIMITATIONS AND FURTHER RESEARCH ... 31
REFERENCE LIST I
vii
TABLE OF FIGURES
Figure 1: Conceptual Framework...12
Figure 2: Statistical Diagram PROCESS Model 4...17
Figure 3: Descriptive Analysis………...21
Figure 4: H1 Results...23
Figure 5: H2 Results...24
Figure 6: H3 Results...25
Figure 7: H4 Results...26
viii
TABLE OF TABLES
Table 1: Measurement Model...19 Table 2: Cronbach’s Alpha Analysis...22 Table 3: Multicollinearity test...22
ix
TABLE OF APPENDICES
Appendix 1: Online Survey – English Version...VII Appendix 2: Online Survey – Portuguese Version...VIII Appendix 3: Sample Characterization Graphics……...XXIII Appendix 4: H1 Independent-Samples t-Tests...XXIV Appendix 5: H2 Independent-Samples t-Tests...XXIV Appendix 6: H3 Independent-Samples t-Tests...XXV Appendix 7: H4 Independent-Samples t-Test...XXV Appendix 8: H5 PROCESS Model 5 Output...XXVI Appendix 9: H6 Independent-Samples t-Tests...XXVI
x
GLOSSARY SL: Store Loyalty SI: Store Image SQ: Service Quality RQ: Research Question
1
CHAPTER 1: INTRODUCTION 1.1 Background
According to Blackwell et al. (2001), providing value to customers is of paramount importance for 21st century marketing strategies. In the modern age of globalized competition
and product propagation, it is believed that offering the customer a good/service with a large amount of imbedded added value is a way to increase the gap from one company to its competitors, further increasing the advantage one has (or reducing the gap if the company in question is the one tailgating) (Bums & Woodruff, 1991; Woodruff, 1997).
Over the last few years, store image management has emerged as a key aspect for organizations, not only due to the fact that we live in an increasingly competitive market, but also because of all the retailers that want to have a sustainable and viable position in the market which helps them to retain customer loyalty.
Regarding the impact on customer purchase intention, there hasn’t been achieved a general agreement about the correct strategy which would have the biggest effect. The previous literature granted that there were a few key factors that benefit store loyalty, however, there is no consensus regarding which combination is the most accurate and which one provides the strongest financial benefits to the retailer.
It is not surprising that customers’ perception of store service and image is closely related to customer loyalty and satisfaction levels (Solvang, 2007), which translates into an outstanding importance for those that know how to take advantage of it and implement the best possible strategies to address this issue. By knowing how to tackle variables such as customers’ perception, perceived service quality, product selection, price and location choice, and overall level of satisfaction, one can achieve remarkable positive results and success.
1.2 Problem Statement
The ultimate goal of the present essay is to further elaborate on customer loyalty through finding out the most optimal combination of factors that maximizes a retailer’s profit. In order to achieve this, the researcher is going to analyze the existing customers’ perception of the meat counter’s products and service.
2
Thus, the problematic was established as the following:
“The role of store image in customer loyalty: how to increase the retailer’s power in the meat counter’s market segment”
The statement above is highlighted by the subsequent research questions: o RQ1: Does a good store experience have an impact in store loyalty? o RQ2: Does price has the biggest effect in customer’s store loyalty?
o RQ3: Does the type of services provided have an impact in the store loyalty? o RQ4: Which factors have the highest impact in customer loyalty?
1.3 Relevance
The manner of how to increase customer loyalty is a topic that has been gaining an increased importance within the retailer market, not only because the market is characterized by a cutthroat competition level, but also because it has an everchanging goal in achieving higher profits on a daily basis.
Zairi (2000) said: “Customers are the purpose of what we do and rather than them depending on us, we very much depend on them. The customer is not the source of a problem, we shouldn’t perhaps make a wish that customers ‘should go away’ because our future and our security will be put in jeopardy”. This is the main point why, now-a-days, several organizations are changing their focus to customer loyalty, retention and satisfaction.
Regarding the concept of customer loyalty by Clarke (2001), it may appear at first sight to be outdated in the current age, where customers are able to conduct an exploration and evaluation of different alternatives, as well as check reviews made by others, all of this with a simple action such as pressing a button. However, evidence proves that age-old rules of good and profitable management still hold valid: customer retention is still important to long-term profits, while on the other side there is a high cost or penalty for businesses that cannot capitalize on high loyalty levels.
From a management point-of-view, the present study aims at providing fruitful elements to retailers, enabling them to perceive how to build a perfect customer loyalty
3
through which they can improve their profitability, as Bowen and Chen (2001) claimed: “there is a positive relationship between customer loyalty and profitability”.
The increased profit stems from decreasing marketing costs, increasing sales and reducing operational costs. However, thinking about loyal customers’ costs, it is perceived that is cheaper to take advantage of already gathered information in order to cater to current customers than to invest in brand-new marketing strategies to gain new ones (Bowen and Chen, 2001).
A loyal customer doesn’t only focus on prices, but he also acts like a supporter of the organization and, as such, helps in attracting new customers (acting almost like a brand ambassador). Therefore, the cost to acquire a new customer can be 15 times higher than that of attempting to retain an existing one, and increases by up to 5% the customers’ loyalty; the profit level can also increase between 25%–85% (Jandaghi et al, 2011)
Razavi et al. (2012), based on from previous research, expressed that several service providers consider customer loyalty as a vital pathway to establish competitive advantage. Empirical studies conducted establish that keeping a current customer can be up to 10 times cheaper than attempting to capture a new one. This importance is highlighted when it is joined with the claim that the loyal customer’s behaviour is characterized by degree of increased collaboration, less complaints, smaller sensitivity to price and, overall, increased profitability. The strongest evidence of customer loyalty is the share of customers who are steady and able to recommend others to a particular product or service. Maintaining loyalty is achieved when customers show both a positive attitude towards the product/service and a repeated behaviour pattern.
Furthermore, the way that customers recognize the quality of service that is being offered has a deep relationship with the overall perceived image of the company, including expectations, external influences, quality of service, etc… Therefore, if customer’s experiences exceed their expectations, customer satisfaction, alongside with situational and personal factors, will result in an increased customer loyalty level (Wilson, Zeithaml, Bitner and Gremler, 2008).
To conclude, and considering studies made by Bansal and Gupta (2001), creating customer loyalty is not something that businesses can ignore any longer, since it seems to be
4
the only way of creating and achieving a sustainable competitive advantage. Building loyalty with key customers has become an important marketing objective shared by key players in all industries pandering to business customers.
1.4 Research methods
In order to adequately answer the above-mentioned research questions, all sets of data, whether they are primary or secondary, were taken into account in this dissertation.
First and foremost, in order to create an in-depth literature review and to establish an extensive historical know-how related to the variables at hand, an encompassing research was conducted within the established state-of-the-art about store image and positioning and store loyalty.
As the primary data source, a quantitative questionnaire was conducted among customers who go to the meat counter at least once a week. The results from the questionnaires were analysed and discussed. Furthermore, the present research used primary data obtained through primary statistical analysis which were used in order to answer the research questions are “Analysis of Covariance” (ANOVA and T-TEST). The study’s population sample is Portuguese retail consumers.
In the end, possible improvements were suggested as part of the conclusions of this dissertation. Thanks to the limited amount of time and resources, this dissertation contained some restrictions, due to the fact that it will not encompass all the factors that influence store image.
1.5 Dissertation outlines
The current research is organized in the following manner: the subsequent section will present the review that was made regarding the literature and the elaboration of all the hypothesis. This brings forward an academical knowledge related to store image and positioning and store loyalty. The third section develops the methodology, where the data collection process and data analysis will be furthermore elaborated. The following chapter showcases the final outcomes and study of the dissertation. At the end, the final chapter covers the major results that were achieved and highlights several inferences and constraints of the present essay.
5
CHAPTER 2: LITERATURE REVIEW AND CONCEPTUAL FRAMEWORK 2.1 Literature review
The appraisal of retail image is of vital importance when discussing the thematic of retail and there are plenty of paths to capture retail images and brand positions (Louviere & Johnson, 1990), due to the fact that all retailers want to have the best image as possible in order to achieve/increase customer retention (Day, 1984). In an increasingly over-competitive environment, businesses should be customer oriented (Kotler, 1997), so it’s important to understand customer interests. That’s why companies invest plenty of resources measuring the level of customer satisfaction.
In this dissertation, the factors that allow the company to have the correct market position and that will possibly lead to a wide range of trading benefits (Birtwistle, Clark & Freathy, 1999) will be discussed. Additionally, it is the aim to prove that store image and store positioning are the main factors that sway customer loyalty and the overall strategy success.
It is important to reinforce that a perfect combination between price and product differentiation will provide a headstart or an increase in competitiveness for organizations, especially in a market as the retail one (Day & Wensley, 1988).
Although, and considering the present competitive environment that is being the scope of this work, it really matters to understand the customer behaviour, since there exists evidence that store loyalty may be related to store image (Mazursky & Jacoby, 1986; Osman, 1993). Although what was mentioned previously stands, the problematic regarding the nature of this relationship still remains, namely between it being a direct or an indirect one.
Regarding the concept of retail store image, Pierre Martineau (1958) defined it as the “personality of the retail store”, although over time customers form ideas associated with stores, which strongly influences their shopping and patronage behaviours (Porter & Claycomb, 1997).
Image is expressed as a function of the characteristics of a certain store which gives it a differentiation factor when compared with other stores. Store image can be defined as the customer’s perceptions of a store on different noticeable characteristics (Bloemer & de Ruyter, 1998). Another of the most widespread and academically accepted definitions of
6
retail store image is that someone’s characteristics are inferred from realizations or memory inputs that are linked to a particular store and which represent what that brand/store or other signifies to him/her (Baker, Grewal & Parasuraman, 1994; Mazursky & Jacoby, 1986).
Boarden (1977) suggested that price, quality of the product, assortment, atmosphere, location, facilities and personnel are key characteristics for the literature. However, in recent years, store image is supposed to consist of different elements of the retail marketing mix that was introduced by Ghosh (1990). These elements consist of location, merchandise, store atmosphere, customer service, price, advertising, personal selling and sales incentive programs. For each retail store a distinct image may exist within customers' minds.
A retail business owner has to make sure that the products which he is offering go in line with the customers’ expectations, due to the fact that the main goal of retail, as mentioned previously before, is to increase customer loyalty and, ultimately, retention and increased purchases. (Bloemer & de Ruyter, 1998).
Store loyalty seems to be an intricate concept due to the fact that it changes differently from repeating visiting behaviour. Visiting behaviour in a repeated manner can be defined as the act of coming back to the store (Bloemer & de Ruyter, 1998). However, behavioural conception is often not adequate in order to explain how and why store patterns occur. The most vital part of the definition of store loyalty is store commitment. It is stated that store commitment is a vital condition for store loyalty to happen. Customers whose pattern is not based on store loyalty may exhibit a link to store attributes and can easily be lured away by competitors through, for example, price competition. According to Osman (1993) “a customer who is loyal to a certain retail establishment will give this store his or her priority visit in any shopping event”.
Marshall (2010) stated (based on several research) that loyalty refers to a commitment to re-purchase or re-patronize a product or service consistently in the future, therefore causing same-brand or same organization purchasing, despite influences and marketing efforts having the potential to cause change.
7
Considering the definition of store image, we also need to define a large number of characteristics that could be of relevance in order to gauge and measure it. However, and having in consideration the actual objective of this dissertation, it will be given focus to only three of them, which are the personal selling, price, and quality of products. The choice of these variables is due to the fact that they are the ones that hold a particular importance to the definition of the concept, not only because they appear in all the reviewed definitions, but also because they seem to allow to take more conclusions about the customer loyalty when the most important Portuguese retailers in the meat counter market are being analysed. Therefore, the following concepts will be analysed and reviewed as follows:
● Personal selling: change from a focus on influencing buyer behaviour to managing the inherent conflict in buyer and seller relations. The highlight on building relationships rather than establishing short-term sales and the use of sales teams dictates changes in the way firms act in the relationships between salespeople and members of sales teams (Weitz, 1999). In this study, the personal selling is divided in the type of service that is being offered, which subsequently divided in personal service of hand cut meat (butcher's sympathy is also included in this variable) and/or packaged meat;
● Price: price competition is modelled by the market, where the main point of this factor is to determine the optimal value that the customer is willing to pay, taking into account market demand as well as competitors’ prices (Bucklin et al.,1998).
In order to achieve a competitive position, the retailer has the possibility to hold sales. By doing this, the retailer is attracting more customers and consequently, increase their own market share.
● Quality of the products: a basic retailing strategy for creating competitive advantage is to deliver a high-quality service or product (Berry, 1986). A retail store experience is encompassed by more than a non-retail service experience in terms of customers’ negotiation, finding the correct product, interacting with store personnel and products, all of which influence the evaluation of customers about the overall quality of service.
● We can also analyse the definition of convenience as it appeared in the marketing literature in relation to the different types of products. The classification proposed by Copeland (1923) about the consumer products included convenience goods:
8
intensively allocated products that require the minimum of time, physical and mental effort to purchase. Later product classification schemes also incorporated the convenience goods division (e.g., Bucklin, 1963; Murphy and Enis, 1986). Therefore, in early marketing terminology, “convenience” denoted the time and effort consumers used in carrying out a purchase of a product, rather than a quality of it (Brown 1990). Focusing on resources such as time, opportunity and energy that consumers expend in order to buy products, researchers began to view convenience as an characteristic that reduces the non-monetary price of a product (Etgar, 1978; Kelley 1958; Kotler and Zaltman, 1971).
● “Atmosphere is a term that is used to explain our feelings towards the shopping experience which cannot be seen” (Milliman, 1986). Kotler (1974) explains the atmosphere as “the design of the retail chain outlet that produces specific emotional effects on the buyer that enhances his purchasing probability”. The luring and awe-inducing atmosphere of retail chains creates a sense of happiness in the customers’ experience, which directly affects their purchase intention and their decision-making process. Regarding this, Srinivasan & Srivastava (2011) proved that the probability of customers staying longer within the store increases thanks to its atmosphere. When a customer feels content from the surroundings of the store, he spends increased amounts of time in it (Bohl, 2012). The environment has a large impact on the consumers’ emotion and satisfaction. Several other researchers have identified the effect of atmosphere on the behaviour of consumers in the store (Russell & Mehrabian, 1978), but empirical research on the impact of store atmosphere on the behaviour of consumers is limited (Zeynep & Nilgun, 2011).
Westbrook (1981) suggests that two wide categories of retailer-related experiences are important to the customer: “in-store experiences” and “experiences related to products”. “In-store experiences” include interactions with store employees as well as store layout. “Experiences related to products” include their quality and availability.
Regarding the meat counter’s market, and considering the Wotruba (1991) perspective, the nature of personal selling has evolved through four stages: “production”, “sales”, “marketing”, and “partnering”. In each of these stages, the role of salesmen differs, an, therefore, salesmen in these roles engage in different activities and need differentiated
9
sets of knowledge, skills, and abilities to be effective. The nature of sales management also changes in response to the changing nature of personal selling.
Researchers also acknowledge that sellers have a portfolio of relationships with their customers (Lambe and Spekman 1997), which will be emphasized in this analysis. These relationships are based on relational exchanges associated with the partnering role for salespeople.
In turn, store image should affect behavioural intentions, such as loyalty, since consumers prefer businesses that have an image with a positive meaning associated. (Selnes,1993).
Additionally, and considering that store image is a predictor of loyalty, it is expected to differentiate customer loyalty groups. Based on these events, the hypothesis that comes up is the following:
H1: “Store image has a positive influence on loyalty”
The next causal link has to do with Price. This factor seems to be really important since seems to have a direct and positive effect on loyalty when satisfaction evaluations are weaker or customers have a smaller degree of confidence in their evaluations (Johnson et al., 2001). According to Mittal, Ross and Baldasare (1998) customers perceive the importance of price and state that their willingness to pay attention to price regarding their own loyalty evaluations. Therefore, it is expected that price can lead to loyalty.
H2: “Price has a positive influence on customer's loyalty”
Concerning the personal selling concept, we can talk about commitment, which suggests two relations in the loyalty model: the “affective relationship” and “calculative commitment” relationship. As a matter of fact, both of these dimensions maintain a customer loyal to a product/company, even when satisfaction and/or store image is low.
According to Allen and Meyer (1990), moral store-commitment relates to a feeling of obligation towards a company. However, Mathieu and Zajac (1990) claim that moral commitment is rare in business relationships and that “affective commitment” and “calculative commitment” seem to be truly relevant to business relationships.
“Calculative commitment” has to do almost exclusively with an estimate ratio of benefits in relation to switching costs (Hemetsberger & Thelen, 2003). In contrast, “affective
10
commitment” is defined as the desire for a continuation of the relationship and expresses a sense of loyalty and belonging (Morgan & Hunt, 1994). “Affective commitment” is the emotional state which develops through the reciprocity between consumers and company (Gustafsson, Johnson, & Ross, 2005).
Johnson et al. (2001) defines “affective commitment”. It conveys a more emotional evaluation since it encompasses the effective strength of the relationship that customers have towards a brand or a business, and the level of involvement and trust that stems from it. The “calculative commitment” serves as a mental barrier to change, since the calculative component is based on colder, more rational and economical aspects of the service. The relationship between satisfaction, commitment and loyalty has been studied and confirmed in a number of researches (Dick & Basu, 1994; Prado & Santos 2004; Pritchard, Havitz, & Howard 1999; Santos 2001; Zins, 2001). Based on the arguments given above, researchers hypothesized that:
H3: “The Personal Selling has a positive impact on loyalty”
In the light of the work carried out by Parasuraman and Grewal (2000) value is a prognosticator of loyalty. In more practical terms, Santos (2001) claimed that the definition of relational value presented a rational explanation of loyalty due to the fact that when consumers realize that their money has an increased value in the relationship, they present a propensity to keep on purchasing.
However, according to Parasuraman and Grewal (2000), "a lot of research has been focused on perceived value from the product perspective and not from the service perspective". Therefore:
H4: “The product quality has a positive influence on loyalty”
Regarding the concept of service quality, it has been found that it presents a direct and lasting effect on customer satisfaction and loyalty (Bowen & Chen, 2001; Brady & Cronin, 2000; Cronin & Taylor, 1992; Ganguli & Roy, 2011; Parasuraman, Zeithaml, & Berry, 1985; Parasuraman, Zeithaml, & Berry, 1988). Above-average levels of service quality has an impact on organizational outcomes such as improving profitability, high market share, customer loyalty and probability of purchase (Brady & Cronin, 2001).
11
Service quality has different dimensions regarding different service sectors (Pollack, 2009). However, service quality measurement allows the management level to recognize quality issues and enhance the overall quality of services needed in order to surpass expectations and reach customer satisfaction. Zeithaml (1988) defines service quality as an assessment of the customer from the overall excellence of service due to the fact that it is intangible, heterogeneous and indivisible.
In 1985, Parasuraman, Zeithaml, and Berry advanced the most used model named SERVQUAL. Firstly, they presented 10 dimensions for service quality, but after some preliminary studies in the 80’s, they narrowed it down to 5 dimensions for service quality model. The SERVQUAL model was based upon the difference between perception and expectation of quality of service through 5 different dimensions.
Following this, in the 90’s, Cronin and Taylor advanced the SERVPERF model that was based on performance in service quality assessment. SERVPERF was more comprehensive in terms of variance in overall service quality measurement than SERVQUAL. In addition, Dabholkar, Thorpe, and Rentz, in 1996, tested SERVQUAL and reported that this measurement had not been adapted in some areas like retail store environment. They proposed a new model so called Retail Service Quality Scale (RSQS).
Regarding the SERVQUAL model, they presented the usage of the gap or difference between expected level of service and delivered level of service for measuring service quality perception with five dimensions: “Reliability”, “Responsiveness”, “Assurances”, “Empathy”, and “Tangibility”.
SERVQUAL is an analytical tool, which helps the management group to identify gaps between variables that affect the quality of the services being offered (Seth, Deshmukh, & Vrat, 2005). This model is the most used by marketing scholars and scientists, although it is a “probe” study and does not offer a clear measuring method for evaluating gaps at different levels.
This model has been improved throughout time, and some researchers think that only performance is required to be measured in a SERVPERF model in order to find perception of service quality (Cronin & Taylor, 1992). Throughout this model’s application, it has been found that SERVQUAL’s factors are inconsistent and the model cannot be taken into account for different applications (Dabholkar, et al., 1996).
12
Customer satisfaction is calculated by the difference between expectations and perceptions of the service quality (Parasuraman et al., 1988) and it is positively related to customer loyalty (Ehigie, 2006). Therefore, the following hypotheses is advanced:
H5: “Customer loyalty is mediated by store image towards service quality”
Therefore, service quality is a vital predecessor to maintaining a good store image. Nguyen and LeBlanc (1998) also demonstrated that service quality was an antecedent of building a store image. Based on the discussion, they tried to prove the positive influence of service quality in the restaurant business. For the purpose of this dissertation, the researcher will consider the concept of store image similar to restaurant image, due to the fact that it presents equivalent meaning. Therefore, it is logical to consider the following hypothesis:
H6: “The service quality has a positive influence on store image” 2.2 Conceptual Framework
13
CHAPTER 3: METHODOLOGY
The following section showcases all the methods that were utilized to further elaborate on the “Research Problem” by answering to the “Research Questions”. The beginning of the present section analyses the global pathway that has been used in order to create the hypothesis and the way secondary data was used and applied. Afterwards, it will be discussed in a more in-depth manner the methodology used in the design of the survey that was carried out, which encompasses a record of the thought process for the research that was carried out, the population’s peculiarities, sampling methods, application of the constructs and a short summary of the statistical tests that were utilized for the subsequent hypothesis test process.
3.1 Research Approach
There are 3 different types of methodologies that are usually utilized during the research process: “exploratory, descriptive and explanatory”. “Exploratory research” represents the first part of the analysis of a hypothetical/theoretical concept. The ultimate goal is to acknowledge if there are any theories that might help shed some light over what was noticed and to comprehend in further detail what is occurring (Saunders, Lewis, & Thornhill, 2009). Frequently, “exploratory research” is able to consider a brand-new subject in order to further increase the studies in a way that describes and explains in a better fashion. “Descriptive research” happens during the point that the investigator is attempting to explain what is occurring in a more detailed manner, “filling in the blanks” and bolstering the knowledge related to a certain subject. In this stage, the wide range of the activities regarding the collection of intel to comprehend the “whats and hows”.
“Explanatory research” establishes the connection between the last ones. Analysts try to build the link between designs and a relationship of causality and effect between variables with the aim to describe the scene. It’s the way that things interact with each other (Saunders, Lewis, & Thornhill, 2009).
In the present work, the aim of the researcher is to understand how to explore customer loyalty through finding out the most optimal combination of factors that maximize a retailer’s profit. In order to achieve this, the researcher is going to analyse the existing customers’ perception of products and services provided by the meat counter.
14
In order to do that, the researcher began by implementing a descriptive research to understand what can affect customer loyalty. In this stage, it was intended to achieve a more in-depth understanding of how the consumer is able to be persuaded and how the shopper can improve sales and profit margins. Afterwards, it’s fundamental to bring forward a an “explanatory research”, which occurs during the tests of primary data: a quantitative questionnaire will be conducted among customers who go to the meat counter at least once a week. Overall, the goal is to see how some factors can influence store image and, consequently, customer loyalty.
3.1.1 Primary vs. Secondary Data
“Primary research” is the type of study that is carried out in “first person” for the problem that is being analysed. It is created by formulating inquiries, carrying out experimentations and achieving conclusions, and can be “quantitative or qualitative”.
“Secondary research” is the bundling of the last study made by different researchers. The information that has been compiled is aimed to showcase the results of someone’s study. Within the scope of this dissertation, the type of information and data used will result from surveys. When some conclusions have been drawn, it will be possible to test different assortment options of combinations of different factors that influence the consumer. These outcomes will become the origin of the “primary data”.
3.2 Research Strategy
To measure store loyalty, a survey (present Annex I) was conducted, showcasing three characteristics of store image, which were considered by the researcher to be the most important ones. The three variables were personal selling, price and quality of the products.
From the total number of responses, it was possible to assess that these three variables were considered by the consumers as the most important ones as well. Further analysis regarding this thematic can be found in the fourth Chapter. With the collected findings, a solid foundation to justify the primary data was achieved.
15
To get to the previously established goals and the results that bring forward enough evidence that validates the hypothesis that were set up, two kind of approaches had to be used, depending on qualitative and quantitative methodologies (exploratory and explanatory, respectively). A survey was designed for the “quantitative research” part of the dissertation. In opposition to that, “quantitative approaches” were applied to test particular hypothesis of the “research problem”.
“Explanatory research” aims to identify the thought process behind the relation that exists between the variables. This way, it can be treated as the most valid path to investigate the causality relation between store image and store loyalty.
The research at hand was conducted, and all the hypothesis and tests were carried out in order to provide a transparent framework of what type of data would need to be collected. That being said, and as a way to fully understand Store Image factors with further detail for the two biggest players within the national market (Continente and Pingo Doce), a survey with random questions was created. As a visual aid (stimulus), a picture of the meat counter of either of the brands was presented, and from there the answers that followed were respective to that particular picture/brand, disregarding the actual place where consumers regularly shopped.
The survey was composed by a bundle of questions that aimed to analyse the perception, by the consumers, of each supermarket regarding Service Quality, Quality of Product, Price and Personal Selling. That way it would be possible to understand which of these factors had a bigger impact on Store Loyalty. Through this analysis it will be possible to understand the factors that retailers should focus on in order to increase their customer retention and subsequent profits.
3.3 Secondary Data Analysis 3.3.1 Population
The scope of the population that the study aims for is described as the Portuguese consumers who go to the same supermarket to buy meat at least once a week. Those used for secondary data consist of those who go to the supermarket just to buy meat due to their
16
understanding the quality of that specific service. This makes for more in-depth realization of how loyal consumers are when buying meat, ceteris paribus.
3.3.2 Data Collection
The secondary data sources of the present research come from the gathered results of each of the questionnaires and online surveys answer by Portuguese consumers through Linked-In, Facebook and e-mail. Those were distributed to different people in order to understand the multiple choices between men and women considering the different types of variables.
3.3.3 Data Analysis
All quantitative data gathered was analysed using SPSS. A covariance analysis was carried out in order to identify the relationships (and all its inherent characteristics) between all the variables, whether they are the independent or dependent ones. An independent sample t-test was conducted in order to assess the possibility of identification of direct effects of the independent variables on the intention of purchase and, namely, to measure differences of the impact among the information/emotional form of communication on the dependant variable.
Additionally, in order to evaluate the likely mediator effect of service quality on the relation among store image and store loyalty, a macro “PROCESS” in the program SPSS was developed by Andrew Hayes. In the present research, the simple mediation model which only includes one mediator was implemented as can be seen in “Figure 2”.
Due to this model, the independent variable, X, might disturb the dependent variable, Y, in 2 distinct manners, a direct and an indirect one. Through a direct link, X disturbs Y with the effect of M (mediator) being independent. Considering the indirect link, X disturbs M and ultimately this disturbance have an impact in Y (Preacher & Hayes 2004, 2014 and 2008). Ultimately, M attempts to describe the relationship between X and Y.
17
3.4 Measurement
This sub-chapter further elaborates the measures for the constructs and the motivation for the selection of the three considered variables. Throughout the survey that was carried out, the order in which the questions appeared was randomized so that it was possible avoid order bias. Two photos were also given in the online survey to help the participants.
Service quality
The GAP model (Parasuraman et al., 1985) identifies 7 key gaps in relationship to managerial perceptions of service quality and tasks associated with service delivery to customers. 6 of the gaps (Gap 1, Gap 2, Gap 3, Gap 4, Gap 6 and Gap 7) are identified as functions of the way in which service is delivered, whereas Gap 5 pertains to the customer and as such, is considered to be the true measure of service quality.
One service quality measurement model that has been extensively applied is the SERVQUAL model developed by Parasuraman et al. (1985, 1986, 1988, 1991, 1993, 1994) and Zeithaml et al. (1990). SERVQUAL is the most often used methodology for measuring service quality. It is used to compare customers' expectations before a service is carried out and their perceptions of the actual service that was delivered, as is shown by Gronroos (1982), Lewis and Booms (1983) and Parasuraman et al. (1985). The SERVQUAL instrument has
18
been the main methodology utilized to measure consumers’ perceptions of service quality. It has 5 generic dimensions or factors (van Iwaarden et al., 2003):
o “Tangibles”: physical facilities, equipment and appearance of personnel. o “Reliability”: ability to perform the promised service in a dependable and
accurate way.
o “Responsiveness”: willingness to help customers and provide prompt service. o “Assurance”: knowledge and wholesomeness of employees and their ability
to inspire trust and confidence.
o “Empathy”: caring and personalized service that the company provides to its customers.
In the SERVQUAL instrument, there are twenty-two statements that assess the performance across these five dimensions using a 7-point Likert scale measuring both consumer expectations and perceptions, with answered ranging from (1) Strongly Agree to (7) Strongly Disagree (Gabbie and O'neill, 1996). It is important to highlight that without proper information on both the quality of services expected and perceptions of services received, feedback from customer surveys can be highly misleading from a policy and an operational perspective.
Evaluating service quality and greater understanding about how several dimensions disturb overall service quality would make organizations to efficiently design the service delivery process. Organizations give an increased quality of service and, ultimately, provide outstanding service to external customers stemming from identifying the strengths and weaknesses related to service quality.
Store Image
A measurement model conducted by Zimmer and Golden (1988) was used. They considered six dimensions of the store image scale, which are employee service, product quality, atmosphere, convenience and price/value are three items were finally retained. A 7-point scale, ranging from (1) Strongly Agree to (7) Strongly Disagree, was used.
19
Store Loyalty
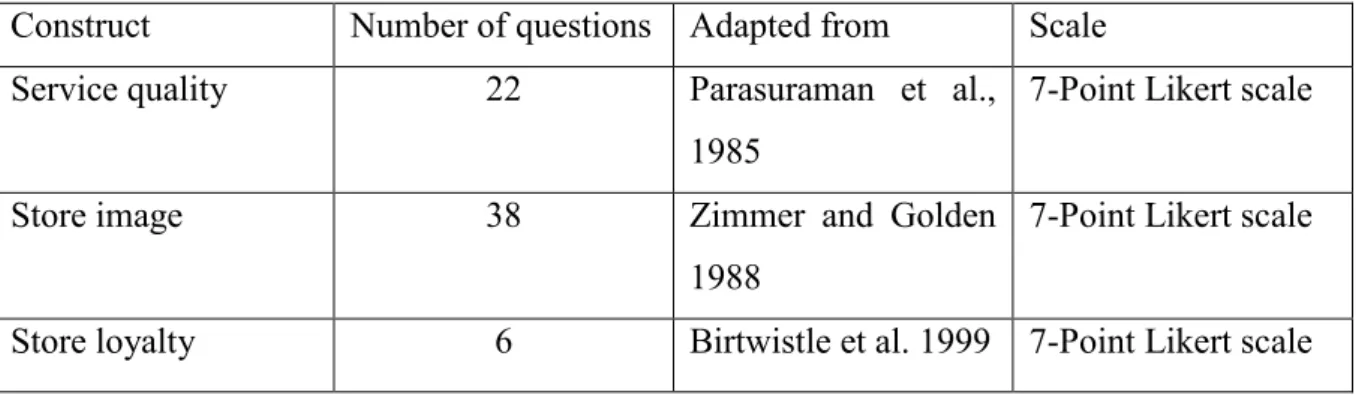
Regarding store loyalty and considering what Lastovicka and Gardner (1977) claimed, the amount of consumer commitment can differ greatly. Therefore, they assume that there is a process that demands continuity. The questions about store loyalty, adapted from Birtwistle et al., 1999, will be inquired and are displayed on a 7-point scale, varying from 1 = strongly disagree to 7 = strongly agree.
Construct Number of questions Adapted from Scale
Service quality 22 Parasuraman et al.,
1985
7-Point Likert scale
Store image 38 Zimmer and Golden
1988
7-Point Likert scale
Store loyalty 6 Birtwistle et al. 1999 7-Point Likert scale
20
CHAPTER 4: RESULTS AND DISCUSSION 4.1 Results and Discussion
This chapter seeks to establish and describe in detail the datasets that were acquired from the online survey using the methodology settled previously. This will guarantee the researcher consistent findings regarding the research questions advanced in the first section of this dissertation.
4.1.1 Sample Characterization
Summarized, 300 respondents responded to the present survey. However, just 225 of them were considered as valid, since the remaining didn't finish the survey or gave answers in an improper manner. As previously was shown in the methodology section, the survey consisted of a choice among Pingo Doce and Continente, where participants would have questions assigned to them regardless of their preference for the brand in question. This means that someone could have chosen Pingo Doce, for example, and the following questions would be either for Pingo Doce or Continente, in order to capture the full extent of the scope to be analysed. Since the scenarios were randomly and uniformly categorized between respondents, each of them getting practically the same number of partakers.
Focusing only on people who actually chose the Continente scenario, 112 respondents answered the survey, while for the Pingo Doce scenario, 56 respondents answer the survey. If the respondents went to another supermarket, they weren’t be consider to the analysis. Concerning the age groups, the sample is quite dispersed, with 39.4% of people ranging between 45 and 64 years, 37.2% belonging to the group 25 to 44 years, 15.9% corresponding to the 18 to 24 year old group, participants with 65 years old or older represented 6.2% of the sample and the remaining 1.3% corresponds to the younger segment of respondents with less than 18 years old.
In order to understand the consumers’ influences, it was questioned in the survey the patterns of consumption, namely regarding purchasing patterns. These answers were capable of shedding light into understanding that most people go to the supermarket at least 1 time per month. More than 60% of those who answered go to the supermarket two or more times per week.
21
Figure 3: Descriptive Analysis
4.1.2 Measure Reliability
To determine how reliable and consistent were the variables of the present sample, the “Cronbach's Alpha Test” was carried out for store image, service quality and store loyalty. To compute the “Cronbach Alphas” for the overall sample, the research combined the questions linked to the 2 supermarkets in 1 analysis.
For the 17 questions which evaluate service quality, the “Cronbach Alpha” is 0.893, which is an adequate number (all values above 0.7 are considered statistically acceptable according to the relevant literature, according to George, D. and Mallery, P.,2003) and the suppression of any item whatsoever will not boost the total accuracy of the constructs.
The store image variable is associated to 35 questions and the Cronbach alpha for these constructs is equal to 0.811, which is a quite high value, therefore the suppression of items would not boost the value of the “Cronbach Alpha”.
Regarding store loyalty, the “Cronbach Alpha” of the 6 questions is 0.893 which makes a statistically relevant value.
22
Table 2: Cronbach Alpha Analysis
Cronbach Alpha Nº of items Continente Pingo Doce Total Sample
Store Loyalty 6 0.906 0.841 0.889
Store Image 35 0.885 0.695 0.811
Service Quality 17 0.910 0.865 0.893
4.1.3 Manipulation check
A “one-sample t-test” was conducted in order to assess if the handling of the stimuli was the adequate one. Due to the fact that all those who responded to the questionnaire were asked to evaluate a specific supermarket, a “one-sample t-test” is the correct test in order to assess if the mean degree of the two supermarkets was substantially disparate. The numbers showcase that the means of the 2 variables are very disparate (t (225) = 44.049, p < .001). Therefore, the allegation that was expected to be the most emotional one from the previous study was, indeed, treated as emotional (showcasing a mean of 1.465 on a “7-point Likert scale”). Therefore, it can be concluded that the premise was a correct one.
Furthermore, there is a significant negative impact between the variables (p<0.01). However, there is no impact of service quality, price, personal selling and product quality in loyalty (p-value > 0.05). In the present model, there is zero evidence of multicollinearity since VIF is under ten, as can be seen in the table below:
Constructs Total Sample
Price 5.182
Personal selling 2.877
Product quality 2.109
Service Quality 2.941
Table 3: Multicollinearity test
Additionally, the variable store image was not considered for the multicollinearity test due to the fact that it already encompasses the other 3 (price, personal selling and quality of products).
23
4.1.4 Results from the Hypothesis Test Hypothesis 1
H1: “Store image has a positive influence on loyalty groups”
The following linear regression is constituted by metric variables: 𝑆𝑡𝑜𝑟𝑒 𝑙𝑜𝑦𝑎𝑙𝑡𝑦 = 𝛽0+ 𝛽1𝑆𝑡𝑜𝑟𝑒 𝑖𝑚𝑎𝑔𝑒 + 𝜀𝜄,
𝜄 = 1, … , 𝑁̅
All of the assumptions of the linear regression model were proven, which means that residuals aren’t correlated, that the error is normally distributed, and it has 0 mean. There is also evidence of homoscedasticity.
The model is statistically significant (F(1;224) =14.423; 𝜌 < 0.001) and the store
loyalty only explains 7.32% of the variance in the store image. The 𝛽1 is 0.856 with 𝜌 <
0.001, which shows that, on average, one unit increase in store image increases 0.856 units in the store loyalty, keeping everything else constant.
Therefore, hypothesis 1 is proven. The null hypothesis that store image doesn’t have an effect on store loyalty was rejected.
Figure 4: Hypothesis 1
A “compare means one-way ANOVA test” was carried out in order to determine the whether the independent variables “store image” and “service quality” are considered metric variables as well as if the dependent variable (“store loyalty”) follows the same principle. The categorical independent variable regards to whether a customer has “chosen” Continente or Pingo Doce, as can be seen in Appendix 3.
H0: μContinente = μPingo Doce
24
H1: μContinente μPingo Doce
The results of the “ANOVA model” are at a significance level of 5%, and there is evidence that store image has statistically significant changes between the 2 supermarkets (p-value = 0,000).
Hypothesis 2
H2: “Price has a positive influence on loyalty”
The following linear regression is constituted by metric variables: 𝑆𝑡𝑜𝑟𝑒 𝑙𝑜𝑦𝑎𝑙𝑡𝑦 = 𝛽0+ 𝛽1𝑃𝑟𝑖𝑐𝑒 + 𝜀𝜄,
𝜄 = 1, … , 𝑁̅
All of the assumptions of linear regression were verified which means that residuals are not correlated, the error is normally distributed and has 0 mean. Furthermore, there is evidence of homoscedasticity.
The model is statistically significant (F(1;224) =15.813; 𝜌 < 0.001) and the store
loyalty only explains 9.50% of the variance in the store image. The 𝛽1 is 0.975 with 𝜌 <
0.001, which suggests that, on average, one unit increase in Price increases 0.975 units in the store loyalty, keeping everything else constant.
Therefore, hypothesis 2 is verified. The null hypothesis that price does not have an effect on store loyalty was rejected.
Figure 5: Hypothesis 2
25
In this specific case, and regarding the “ANOVA model”, with a significant level of 5%, there is sufficient evidence that the variable “price” presents statistically significant distinctions between the 2 supermarkets (p-value = 0,000).
Hypothesis 3
H3: “The personal selling has a positive impact on loyalty”
The following regression is constituted by metric variables hence: 𝑆𝑡𝑜𝑟𝑒 𝑙𝑜𝑦𝑎𝑙𝑡𝑦 = 𝛽0+ 𝛽1𝑃𝑒𝑟𝑠𝑜𝑛𝑎𝑙𝑠𝑒𝑙𝑙𝑖𝑛𝑔 + 𝜀𝜄,
𝜄 = 1, … , 𝑁̅
All of the assumptions of the linear regression were proven, which translates to that residuals are not correlated, the error is normally distributed and has 0 mean. There is also evidence of homoscedasticity.
The general model is statistically significant (F(1;224) =9,644; 𝜌 < 0.001) and the
store loyalty only explains 3.303% of the variance in the Personal Selling. The 𝛽1 is 0. 553
with 𝜌 < 0.001, which suggests that, on average, one unit increase in Personal Selling
increases 0.553 units in the store loyalty, keeping everything else constant.
Therefore, hypothesis 3 is verified. The null hypothesis that Personal Selling does not have an effect on store loyalty was rejected.
Figure 6: Hypothesis 3
Regarding the personal selling effect, and considering the “ANOVA model” (significant level of 5%), it can be seen that there is significant amounts of evidence that personal selling has statistically significant distinctions between the 2 supermarkets (p-value = 0,010).
26
Hypothesis 4
H4: “The product quality has a positive influence on loyalty”
The following regression is constituted by metric variables: 𝑆𝑡𝑜𝑟𝑒 𝑙𝑜𝑦𝑎𝑙𝑡𝑦 = 𝛽0+ 𝛽1𝑃𝑟𝑜𝑑𝑢𝑐𝑡𝑄𝑢𝑎𝑙𝑖𝑡𝑦 + 𝜀𝜄,
𝜄 = 1, … , 𝑁̅
All of the assumptions of linear regression were proven, which roughly means that residuals are not correlated, that the error is normally distributed and that it has 0 mean. There is also evidence of homoscedasticity.
The general model is statistically significant (F(1;224) =3,264; 𝜌 < 0.001) and the
store loyalty only explains 2.209% of the variance in the Product Quality. The 𝛽1 is 0. 484
with 𝜌 < 0.001, which suggests that, on average, one unit increase in Product Quality
increases 0.484 units in the store loyalty, keeping everything else constant.
Therefore, hypothesis 4 is verified. The null hypothesis that Product Quality does not have an effect on store loyalty was rejected.
Figure 7: Hypothesis 4
Regarding the product quality effect, and considering the “ANOVA model”( significant level of 5%), there is evidence that product quality has no statistically significant distinctions between the 2 supermarkets (p-value = 0,070).
27
Hypothesis 5
H5: “Store loyalty is mediated by store image towards service quality”
To understand the mediation effect of service quality on the relationship among store image, and store loyalty, the previously mentioned “PROCESS” macro was carried out in SPSS by applying the model 4 (simple mediation case) (Appendix 8).
Beginning by the most forefront effects of the variables and assuming the level of significance of 5%, the effect of loyalty on store image is statistically significant (p.value = 0,00’), which has a positive effect.
The effects of store image and service quality are statistically significant (p.SP= 1.1125; p.PR=1.7464), making up together 63,93% of the variance of store loyalty, Both have a positive effect on loyalty.
In terms of the possibility of service quality being a mediator on this accord, its necessary to consider the indirect effect of X on Y through M which is 0,1286, with a confidence interval of -0,0342 to 0,0845 and the total effect of X on Y is 1,2090 which is statistically significant (p- value = 0,000).
Due to the fact that 0 is embedded in the bootstrapping confidence interval of 95%, it is feasible to achieve the conclusion that the indirect effect is not statistically distinct from 0. This hints that the impact of store image with or without service quality as a mediator might be similar, which means that the mediator addition does not turn the impact of store image significantly different. This allows to conclude that the effect of X on Y seems to be equal to the total effect of X on Y. Therefore, the H5 is not assessed through the mediation regression. It is feasible to assess that service quality is not a decent mediator of the relation of store image and store loyalty, as can be seen by the non-validation of the H5.
28
Hypothesis 6
H6: “The service quality has a positive influence on store image”
The following regression is constituted by metric variables: 𝑆𝑡𝑜𝑟𝑒 𝑙𝑜𝑦𝑎𝑙𝑡𝑦 = 𝛽0+ 𝛽1𝑆𝑒𝑟𝑣𝑖𝑐𝑒𝑄𝑢𝑎𝑙𝑖𝑡𝑦 + 𝜀𝜄,
𝜄 = 1, … , 𝑁̅
All the assumptions of linear regression were proven, which showcases that residuals are not correlated, the error is normally distributed and has 0 mean. This also means that there is evidence of homoscedasticity.
The general model is statistically significant (F (1;224) =9,938; 𝜌 < 0.001) and the
store loyalty only explains 2.209% of the variance in the Service Quality. The 𝛽1 is 0.725
with 𝜌 < 0.001, which suggests that, on average, one unit increase in Service Quality
increases 0.725 units in the store loyalty, keeping everything else constant.
Therefore, hypothesis 6 is verified. The null hypothesis that service quality does not have an effect on store loyalty was rejected.
Figure 7: Hypothesis 6
Last but not least, and considering the service quality effect and the “ANOVA model” (significant level of 5%), it can be stated that there is enough evidence to support the claim that product quality has statistically significant contrasts between the 2 supermarkets (p-value = 0,002).
Service quality
0.725***
29
CHAPTER 5: CONCLUSIONS AND LIMITATIONS
5.1 Main Findings and Conclusions
A survey was carried out so that it was possible to perform a quantitative data analysis over the already established research problem. Respondents were presented 1 of 2 scenarios where they had to assess one of the two supermarkets. The analysis shed light to some relevant conclusions, not only theoretical, but also for practical scenarios.
5.1.1 The impact of store image on store loyalty
The ultimate purpose of the current research was to assess how customer loyalty could be enhanced in order to enhance the consumer’s purchase motivation and eventual business. This is deeply relevant due to the fact that marketeers are always restless, and with the increase in competition levels, they are always trying to innovate and coming up with new ideas to answer the individual needs of consumers.
Having said this, the research question number one is proposed to establish if store image has a positive or negative influence on loyalty. The results indicate that store image, in fact, has a direct effect on customer loyalty, the effect is also significant to both supermarkets.
Compiling the results for the research question number one, it can be stated that store image has a direct repercussion on store loyalty of the consumer. Within the store image variable there are several factors that have an impact and can explain on store loyalty. There is also a need to test whether service quality can be a mediator of the relationship presented above.
In order to identify which factors within store image would be more effective, we also need to conduct an “independent t-test”. From the gathered results, it can be claimed that there are differences between both supermarkets.
30
5.1.2 The impact of Price, personal selling and quality of the products on store loyalty The next research questions (2, 3 and 4) are focused on the impact of price, personal selling and quality of products on store loyalty considering both supermarkets: Continente and Pingo Doce.
In fact, it can be claimed that price has a significant and positive effect on store loyalty. The regression model proposes that, regardless of the supermarket we are considering, the price is the most important factor, so a higher competitive price leads to a higher effect on loyalty.
Considering the personal selling factor, this has a significant and positive effect on both, meaning that a higher personal selling seems to lead to a higher loyalty level. In this particular case, it seems to be satisfactory, although it is lower than the price effect.
Lastly, when we are discussing product quality, we can also affirm that this factor doesn’t seem to be essential and it has a weaker effect on store loyalty. This is due to the fact that the effect seems to be lower in both cases.
5.1.3 Mediation between store image and service quality
PROCESS was used to test if the service quality is a mediator and if it should, or not, be taken as a significant mediator. This showcases that service quality helps to explain the relationship between store image and store loyalty. In detail, a better service quality leads to a higher store loyalty.
However, in this specific case, it is just a partial mediator, since the several regression model highlights that to the Pingo Doce specific case, the model is not explained by this factor (it is not statistically significant). To conclude, service quality is just a good factor to this model to the Continente case.
31
5.1.4 The impact of service quality on store image.
Comparing the results of both supermarkets, it can be demonstrated that both have a direct positive and significant effect on store loyalty. Additionally, it seems that this factor seems to be the second most important factor and that it has a high impact in both supermarkets.
5.2 Managerial / Academic Implications
Marketeers work every day in order to increase the loyalty of consumers and that's why they have to make decisions all the time in order to be more competitive.
They have to understand that if they want to improve and have a good market share, it is essential to focus on every consumer in order to answer to all their needs.
Additionally, marketeers have to pay attention to what group their customers belong to and what they want. The conclusions from the cluster analysis indicate that its essential to focus on the right factors to succeed.
To the knowledge of the researcher, no published studies of this nature had been carried out in Portugal, let alone regarding the Butcher’s market. Therefore, this study contributes in a ground-breaking way to possible further academical studies of this nature, filling an identified gap in the literature with a study of this scope.
Furthermore, this study can also contribute for managers/marketers/decision makers in order to know which variables have more of an impact on consumers’ decisions and how they can influence them. This is of great importance due to the fact that in an extremely competitive market, every competitive advantage is a plus and can make a substantial difference in sales, consumer engagement and retention.
5.3 Limitations and Further Research
In terms of limitations of this dissertation, firstly, the number of answers collected is nowhere near enough to establish a reasonable representation of the Portuguese market. Regarding the answers itself, there is a large age interval that encompasses the ages of 25 to 44. This interval is large enough to include both people that usually shop and those that are
32
too young to conduct such activities on a regular basis (either because they live with their parents or others that do those activities for them). The geographical distribution is also skewed towards Porto, which is also a limitation. Lastly, and still within the scope of the answers, one must also take into account that with anonymous online surveys there are always those who answer in an improper/jokingly manner.
Due to the nature of this study, which is an academical one, and also due to time constraints, it wasn’t possible to conduct a thorough study that could comprise an amount of answers that could really create an adequate picture of the average Portuguese consumer of the Butcher’s market. Additionally, and considering the fact that a convenient sample that isn’t representative is being used, the results cannot be generalized.
For further research, this study can be applied to other market segments (fish markets, bakery, fast food, etc.) or to the same segment in other countries, in order to establish a point of comparison between types of consumers. Additionally, a similar study can also be carried out in order to encompass an even larger number of answers, so that a true reflection of the Portuguese consumer within the Butcher’s market can be created.
I
REFERENCE LIST
Agustín, C., & Singh, J. (2002). Satisfaction, trust, value and consumer loyalty: curvilinearities in relationship dynamics. Proceedings of the Conference of European Marketing Academy.
Allen, N. J., & Meyer, J. P. (1990), The measurement and antecedents of affective, continuance, and normative commitment to the organization, Journal of Occupational Psychology, 63(1), pp. 01-18.
Areni, C.S. & Kim, D. (1994), “The Influence of in-store lighting on consumers’ examination of merchandise in a wine store”, International Journal of Research in Marketing, vol. 11, no. 2, pp.117.
Bagozzi, Richard P. (1981), "Evaluating Structural Equation Models With Unobservable Variables and Measurement Error: A Comment," Journal of Marketing Research, 18 (August), pp. 375-381.
Baker, J., Grewal, D. and Parasuraman, A. (1994). ‘The influence of store environment on quality inferences and store image’. Journal of Academy of Marketing Science. 22 (4), pp. 328-39.
Baker, Julie, Dbruv Grewal, and A Parasuraman (1994), "The Influence of Store Environment on Quality Inferences and Store Image," Journal of the Academy of Marketing Science, 22 (4), pp. 328-339.
Bansal, S. & Gupta, G., (2001), Building Customer Loyalty Business-to-Business Commerce. In J. N. Sheth, A. Parvatiyar & G. Shainesh, eds., Customer Relationship Management. New Delhi, Tata McGraw-Hill, 2001, pp. 3-25.
Beardon, W.O. (1977). ‘Determinant Attributes of Store Patronage: Downtown versus Outlying Shopping Areas’. Journal of Retailing. 53, pp. 15-22.
Bernt Krohn Solvang, (2007). Satisfaction, Loyalty and Repurchase: A study of Norwegian Customers of furniture and Grocery Stores. Journal of Consumer Satisfaction, Dissatisfaction and Complaining Behavior. Vol. 20 pp. 110.
Berry, L. L. (1986). ‘Retail businesses are service businesses’, Journal of Retailing, 62 (Spring): pp. 3-6.
Birtwistle, G., Clark, I. and Freathy, P. (1999). ‘Store Image in UK fashion sector: Consumer Versus Retailer Perceptions’. The International Review of Retail, Distribution and Consumer Research. 9(1), pp. 1-16.