Phase Diagram Study for the PbO-ZnO-CaO-SiO
2-“Fe
2O
3” System in Air with CaO/SiO
2in
1.1 and PbO/(CaO+SiO
2) in 2.4 Weight Ratios
Josue Lopez-Rodrigueza, Antonio Romero-Serranoa*, Aurelio Hernandez-Ramireza, Alejandro
Cruz-Ramireza, Isaias Almaguer-Guzmanb, Ricardo Benavides-Perezb, Manuel Flores-Favelab
Received: February 21, 2017; Revised: April 28, 2017; Accepted: May 21, 2017
An experimental study on the phase equilibrium and the liquidus isotherms for the PbO-ZnO-CaO-SiO2-“Fe2O3” system with CaO/SiO2 in 1.1 and PbO/(CaO+SiO2) in 2.4 weight ratios, respectively, was carried out in the temperature range 1100-1300ºC (1373-1573 K). High temperature phases were determined by the equilibrium-quenching method. Results are presented in the form of pseudo-ternary sections “Fe2O3”-ZnO-(PbO+CaO+SiO2). X-Ray difraction (XRD) and SEM-EDS results showed that the phase equilibria in this system are dominated by the high melting temperature spinel and zincite phases. It was observed that if the system is at a temperature below 1300ºC and the total (Fe2O3 + ZnO) is greater than 20 wt%, spinel and/or zincite will be present in the slag system. As an application of the phase diagram, the liquid phase compositions below the liquidus surface were estimated, then their viscosities were calculated using FACTSage software.
Keywords: Phase diagram, Slags, Lead
* e-mail: [email protected]
1. Introduction
Metallurgical slags have a relevant role to play in the
extraction and reining of metals. They are formed by luxes, added to or included in the charge, which produce a slag with a low melting point. Eicient luxing requires
the knowledge of phase relationships in the slag, and these may be represented graphically on phase diagrams. Zhao1
has explained that among the various methods for phase diagram determination, the equilibrium-quenching-analysis method is helpful to constructing isothermal sections. This method is based on keeping the high-temperature phase equilibria at room temperature by quenching. The method is appropriate for investigating systems in which the phase transitions are sluggish, and long-term homogenization is thus needed, such as with silica based slags.
The equilibration-quenching method can be explained with reference to Figure 1. Consider a hypothetic A-B-C ternary system with the A(S), B(S), C(s) and A2C(S) primary
phase ields. Boundary lines separate primary phase ields,
along which one liquid is in equilibrium with two solid
phases as deined by the adjoining primary phase ields.
Let us consider that a system of overall composition M is heated at temperatures T1 and T2, below the liquidus surface. At temperature T1, there exists an equilibrium between the liquid phase with a composition of point x and grains of A2C phase. If the system is kept at temperature T2, there will be an equilibrium between the liquid phase with a composition
of the point y and two solid phases, A2C and crystals of pure C. When the sample is cooled rapidly by drop quenching directly into water, from temperature T1 or T2, the result is that the phases present at those temperatures and their respective compositions are retained at room temperature, as shown in the micrographs in Figure 1. Then, the position of isotherm T1 and the boundary line at T2 can be estimated by microanalysis at room temperature.
a Metallurgy and Materials Department, Instituto Politécnico Nacional-ESIQIE, Zacatenco,
C.P. 07738, Mexico City
b Servicios Administrativos Peñoles S.A de C.V., Prol. Comonfort Sur 2050, Col. L. Echeverría, Torreón,
C.P. 27300 Coahuila, Mexico
Figure 1. Schematic ternary phase diagram illustrating the use of the equilibration technique.
The production of lead and zinc metals is mainly undertaken in blast furnaces, where the reduction of lead oxide in this furnace produces slags in the multicomponent system PbO-ZnO-“Fe2O3”-SiO2-CaO2. This system represents the major
components of lead/zinc smelting slags in oxidizing conditions.
of luxes with diferent SiO2, CaO and Fe2O3 contents is
done, and the information on the liquidus temperatures and the mineralogical species formed is useful for optimizing industrial practice. From the process operations’ point of view, the presence of solids in liquid slags increase the
viscosity of the system and is likely to result in diiculties
in phase separation and slag tapping3,4.
Jak et al.5 reported that the liquidus surface for the
PbO-ZnO-CaO-SiO2-“Fe2O3” system can be shown graphically
if it is projected onto a pseudo-ternary diagram “Fe2O3
”-ZnO-[PbO+CaO+SiO2]. In order to describe the system, it is
necessary to ix the CaO/SiO2 ratio and the PbO/(CaO+SiO2)
ratio in the liquid phase. The liquidus isotherms can be plotted on this diagram as would be the case for a normal ternary phase diagram. As ZnFe2O4 and ZnO primary phases are present in this system, phase equilibria can be treated as a
true ternary in these primary phase ields. The composition
of the liquid phase and the proportions of solid and liquid phases can be obtained by simple mass balance considerations using the lever rule.
Experimental studies on phase equilibria in the
PbO-ZnO-CaO-SiO2-“Fe2O3” system in air, using diferent CaO/ SiO2 ratios, have been carried out earlier5-7 to characterize
the phase relations of slag systems used in lead and zinc smelting. They used synthetic oxide mixtures, pelletized and equilibrated at temperatures below the liquidus so that two or more phases were formed. The samples were quenched, and the phases present at high temperature and their compositions were retained at room temperature. Their results showed that the liquidus in the pseudo-ternary “Fe2O3”-ZnO-(PbO+CaO+SiO2) system contains primary
phase ields of spinel (ZnxFe3-xO4+y), zincite (ZnO), hematite
(Fe2O3), melilite (PbvCa2-vZnwFe1-wSi2O7), magneto-plumbite (PbFe10O16) and calcium and lead silicates.
The present study has been conducted to provide experimental data on the “Fe2O3”-ZnO-[PbO+CaO+SiO2] pseudo-ternary section with the following weight ratios: CaO/SiO2 = 1.1 and PbO/(CaO+SiO2) = 2.4, using the equilibrium-quenching method. These composition parameters have been selected because they represent the slags typically encountered in the Mexican lead blast furnaces.
FACTSage thermodynamic software8 has incorporated
an extensive amount of results on the PbO-ZnO-CaO-SiO2 -Fe2O3-FeO-Al2O3 slag systems in order to obtain one set of model equations for the Gibbs energy of the liquid slag. This software is used in this work as a tool to calculate the boundary line that separates the melilite and silicates’
primary phase ields of the phase diagram. This computer
program can also calculate the viscosities of liquid silicate slags. The model links the viscosities of silicate melts to their structure and thermodynamic properties. The local structure of the liquid, in terms of the bridging behavior of oxygen, calculated using the thermodynamic model allows to characterize the structure of the liquid semi-quantitatively.
The silicon atoms in silicate melts are always tetrahedrally bonded to four oxygen ions. Basic silicate melts consist mainly of Mn+, O2-, and SiO
4
4- ions. As the silica content increases
above the orthosilicate composition, the SiO44- tetrahedra start
to polymerize, forming more and more bridging oxygens, and gradually, a three-dimensional network is formed. This model has been used extensively for modeling the viscosity of silicate melts containing lead oxide9.
2. Experimental Procedure
The experimental procedure involves the preparation of synthetic slags from pure oxide powders (above 99.5
wt% purity). One diiculty in the experimental procedure
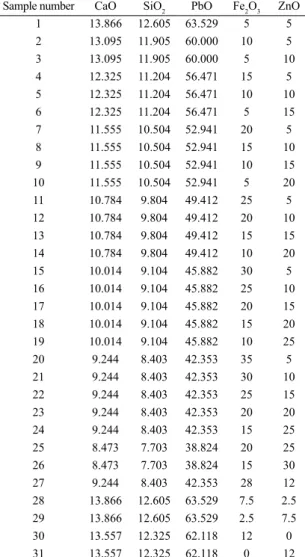
is the high vapor pressure of lead oxide. In order to reduce this problem, master slags with the required amounts of PbO and SiO2 were prepared. The master slags were then mixed with the appropriate addition of the other pure oxide powders (ZnO, CaO and Fe2O3) to prepare the inal mixtures. About 31 slag systems were tested, and their compositions are shown in Table 1 and Figure 2.
Table 1. Slag compositions used for experiments (wt%). Sample number CaO SiO2 PbO Fe2O3 ZnO
1 13.866 12.605 63.529 5 5
2 13.095 11.905 60.000 10 5
3 13.095 11.905 60.000 5 10
4 12.325 11.204 56.471 15 5
5 12.325 11.204 56.471 10 10
6 12.325 11.204 56.471 5 15
7 11.555 10.504 52.941 20 5
8 11.555 10.504 52.941 15 10
9 11.555 10.504 52.941 10 15
10 11.555 10.504 52.941 5 20
11 10.784 9.804 49.412 25 5
12 10.784 9.804 49.412 20 10
13 10.784 9.804 49.412 15 15
14 10.784 9.804 49.412 10 20
15 10.014 9.104 45.882 30 5
16 10.014 9.104 45.882 25 10
17 10.014 9.104 45.882 20 15
18 10.014 9.104 45.882 15 20
19 10.014 9.104 45.882 10 25
20 9.244 8.403 42.353 35 5
21 9.244 8.403 42.353 30 10
22 9.244 8.403 42.353 25 15
23 9.244 8.403 42.353 20 20
24 9.244 8.403 42.353 15 25
25 8.473 7.703 38.824 20 25
26 8.473 7.703 38.824 15 30
27 9.244 8.403 42.353 28 12
28 13.866 12.605 63.529 7.5 2.5 29 13.866 12.605 63.529 2.5 7.5
30 13.557 12.325 62.118 12 0
About 20 g of each slag sample were homogenized and equilibrated in platinum crucible (25 mm inner diameter
and 35 height) in air in two steps, the irst involving the
melting of the sample at 1300ºC over 6 h, and the second equilibration at the predetermined temperatures of 1300, 1200 and 1100ºC over 4 h. After equilibrium was achieved, the samples were quenched in iced water. The furnace temperature was controlled within ± 3ºC with an R-type thermocouple (Pt-Pt, 13%Rh). The estimated maximum lead oxide and zinc oxide losses during equilibration, using the X-ray
luorescence technique, were 2.5 and 1.1 %, respectively.
The experimental procedure is shown in Figure 3.
reference standards for EDS analysis were gold, silver,
platinum, copper, quartz, galena, sphalerite, chalcopyrite, pyrite and wollastonite. Attention was paid to the morphology, shape and compositions of the solid crystallized phases; the presence of crystals was homogeneous in composition. It
must be stressed that it is possible to conirm the equilibrium
achievement by changing the equilibration time variation to
conirm that no further changes take place with time. Another test of the equilibrium achievement is by conirming the
chemical homogeneity of phases and samples10.
3. Results and Discusion
3.1. Phase diagram of the pseudoternary system
The compositions results of the quenching experiments between 1100ºC and 1300ºC are given in Table 2. The advantage of this experimental technique is that each experiment provides information on the liquidus composition
and on the compositions of the solid phases formed. Each
phase composition given in Table 2 is an average of up to three compositions measured in various locations within that phase.
It must be stressed that in practice, there is always a mixture of two iron cations Fe2+ and Fe3+ present in slags
and the Fe2+/Fe3+ ratio depends on both temperature and
oxygen partial pressure. It has been reported6 that when the
oxygen partial pressures is high, approaching that of air, at 1100-1300ºC, the Fe2+/Fe3+ ratio is about 1/9; i.e., there is
little Fe2+ in this phase. As the FeO concentrations in the
present system in air are small all iron is represented as ferric oxide in this article (“Fe2O3”).
The liquidus surface for part of the pseudo-ternary section “Fe2O3”-ZnO-(PbO+CaO+SiO2) with the CaO/SiO2 weight ratio of 1.1 and the PbO/(CaO+SiO2) weight ratio of 2.4 is shown in Figure 4. This pseudo-ternary section has
the following primary ields:
1. Spinel: ZnxFe3-xO4+y 2. Zincite: ZnO
3. Melilite: PbvCa2-vZnwFe1-wSi2O7
4. Calcium and lead silicates: Ca2SiO4, Pb5SiO7, Ca2PbSi3O7, etc.
Jak and Hayes6 also reported primary ields of hematite
(Fe2O3) and magneto-plumbite (PbFe10O16) in some diagrams
with diferent CaO/SiO2 and Pb/(CaO+SiO2) ratios and with
less than 5 wt% ZnO in the slag; however, our research was carried out with slags containing higher amounts of ZnO, and so we did not observe the presence of such phases.
Figure 4 shows that the phase equilibria in this system is dominated by the phases of high melting point, spinel and zincite. It can be seen that if the system is below 1300ºC, and if the total (Fe2O3 + ZnO) is greater than 20 wt%, spinel and/or zincite will be present in the slag system. As spinel
and zincite do not contain signiicant amounts of PbO,
Figure 2. Schematic representation of the slag compositions.
Figure 3. Experimental procedure.
Samples of each slag were characterized by X-ray
difraction (XRD Bruker D8 Focus) using Cu Kα (λ=1.5406 Å) radiation over a 2θ of 10º to 120º at a speed of 2 min-1.
A microstructural analysis was performed by irst mounting
and polishing the samples, then by examination using scanning electron microscopy coupled with an
energy-dispersive spectra analyzer (FEI Quanta 600, EDAX EDS) and GENESIS-MLA software (Mineral Liberation Analysis)
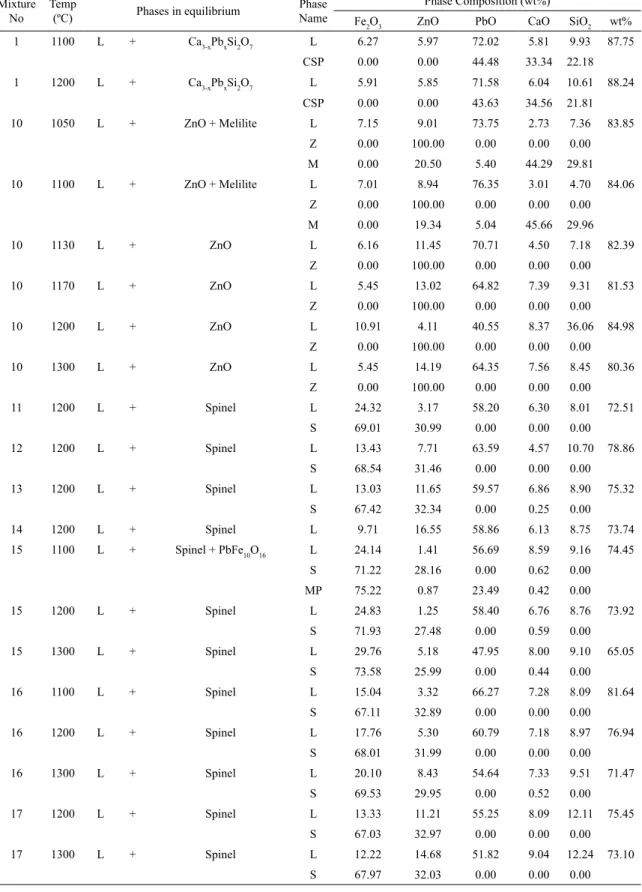
Table 2. Experimental data on the Section with a CaO/SiO2 weight ratio of 1.1 and PbO/(CaO+SiO2) weight ratio of 2.4.
Mixture
No Temp (ºC) Phases in equilibrium
Phase
Name
Phase Composition (wt%)
Fe2O3 ZnO PbO CaO SiO2 wt%
1 1100 L + Ca3-xPbxSi2O7 L 6.27 5.97 72.02 5.81 9.93 87.75
CSP 0.00 0.00 44.48 33.34 22.18
1 1200 L + Ca3-xPbxSi2O7 L 5.91 5.85 71.58 6.04 10.61 88.24
CSP 0.00 0.00 43.63 34.56 21.81
10 1050 L + ZnO + Melilite L 7.15 9.01 73.75 2.73 7.36 83.85
Z 0.00 100.00 0.00 0.00 0.00
M 0.00 20.50 5.40 44.29 29.81
10 1100 L + ZnO + Melilite L 7.01 8.94 76.35 3.01 4.70 84.06
Z 0.00 100.00 0.00 0.00 0.00
M 0.00 19.34 5.04 45.66 29.96
10 1130 L + ZnO L 6.16 11.45 70.71 4.50 7.18 82.39
Z 0.00 100.00 0.00 0.00 0.00
10 1170 L + ZnO L 5.45 13.02 64.82 7.39 9.31 81.53
Z 0.00 100.00 0.00 0.00 0.00
10 1200 L + ZnO L 10.91 4.11 40.55 8.37 36.06 84.98
Z 0.00 100.00 0.00 0.00 0.00
10 1300 L + ZnO L 5.45 14.19 64.35 7.56 8.45 80.36
Z 0.00 100.00 0.00 0.00 0.00
11 1200 L + Spinel L 24.32 3.17 58.20 6.30 8.01 72.51
S 69.01 30.99 0.00 0.00 0.00
12 1200 L + Spinel L 13.43 7.71 63.59 4.57 10.70 78.86
S 68.54 31.46 0.00 0.00 0.00
13 1200 L + Spinel L 13.03 11.65 59.57 6.86 8.90 75.32
S 67.42 32.34 0.00 0.25 0.00
14 1200 L + Spinel L 9.71 16.55 58.86 6.13 8.75 73.74
15 1100 L + Spinel + PbFe10O16 L 24.14 1.41 56.69 8.59 9.16 74.45
S 71.22 28.16 0.00 0.62 0.00
MP 75.22 0.87 23.49 0.42 0.00
15 1200 L + Spinel L 24.83 1.25 58.40 6.76 8.76 73.92
S 71.93 27.48 0.00 0.59 0.00
15 1300 L + Spinel L 29.76 5.18 47.95 8.00 9.10 65.05
S 73.58 25.99 0.00 0.44 0.00
16 1100 L + Spinel L 15.04 3.32 66.27 7.28 8.09 81.64
S 67.11 32.89 0.00 0.00 0.00
16 1200 L + Spinel L 17.76 5.30 60.79 7.18 8.97 76.94
S 68.01 31.99 0.00 0.00 0.00
16 1300 L + Spinel L 20.10 8.43 54.64 7.33 9.51 71.47
S 69.53 29.95 0.00 0.52 0.00
17 1200 L + Spinel L 13.33 11.21 55.25 8.09 12.11 75.45
S 67.03 32.97 0.00 0.00 0.00
17 1300 L + Spinel L 12.22 14.68 51.82 9.04 12.24 73.10
18 1200 L + Spinel L 11.60 17.14 51.98 8.91 10.37 71.26
S 73.80 25.68 0.00 0.52 0.00
18 1300 L + Spinel L 15.13 20.81 45.39 8.29 10.38 64.06
19 1200 L + ZnO L 14.62 11.84 59.93 5.24 8.37 73.53
Z 0.00 100.00 0.00 0.00 0.00
19 1300 L + ZnO L 9.66 20.16 50.24 8.56 11.38 70.18
Z 0.00 100.00 0.00 0.00 0.00
20 1100 L + Spinel L 21.31 0.00 58.74 9.04 10.91 78.69
S 71.32 28.26 0.00 0.42 0.00
20 1200 L + Spinel L 27.70 2.47 53.40 7.54 8.89 69.84
S 73.03 26.97 0.00 0.00 0.00
20 1300 L + Spinel L 33.58 4.49 46.55 6.46 8.91 61.93
S 75.55 23.99 0.00 0.47 0.00
21 1100 L + Spinel L 17.33 2.49 60.89 8.39 10.91 80.19
S 68.20 31.24 0.00 0.56 0.00
21 1200 L + Spinel L 17.01 4.04 60.94 8.60 9.42 78.95
S 68.34 31.26 0.00 0.40 0.00
21 1300 L + Spinel L 27.44 7.94 48.76 6.62 9.24 64.62
S 70.03 29.97 0.00 0.00 0.00
22 1100 L + Spinel + Melilite L 10.92 6.31 73.91 3.40 5.46 82.77
S 66.61 33.39 0.00 0.00 0.00
M 2.59 24.05 4.08 33.24 36.04
22 1200 L + Spinel L 17.10 8.20 58.80 8.19 7.71 74.70
S 68.50 30.97 0.00 0.53 0.00
22 1300 L + Spinel L 20.62 14.81 46.77 7.82 9.98 64.57
S 68.31 31.69 0.00 0.00 0.00
23 1100 L + Spinel + ZnO + Melilite L 9.30 9.66 72.93 3.55 4.56 81.04
S 65.41 34.59 0.00 0.00 0.00
Z 0.00 100.00 0.00 0.00 0.00
M 0.00 28.37 0.00 34.31 37.32
23 1200 L + Spinel + Melilite L 11.32 18.31 52.31 7.98 10.07 70.37
S 67.42 32.34 0.00 0.25 0.00
M 0.00 43.35 0.00 32.15 24.50
23 1300 L + Spinel L 18.46 18.90 45.87 7.84 8.92 62.63
S 65.02 34.98 0.00 0.00 0.00
24 1100 L + Spinel + ZnO + Melilite L 9.39 9.28 72.80 2.79 5.74 81.34
Z 0.00 100.00 0.00 0.00 0.00
S 64.80 35.20 0.00 0.00 0.00
M 0.00 28.10 0.00 34.19 37.71
24 1200 L + ZnO + Spinel L 12.73 17.12 52.93 7.51 9.70 70.15
Z 0.00 100.00 0.00 0.00 0.00
S 68.06 31.94 0.00 0.00 0.00
24 1300 L + Spinel L 15.19 22.27 46.20 7.46 8.89 62.54
S 7.26 92.74 0.00 0.00 0.00
25 1300 L + Spinel L 17.72 24.67 44.31 5.67 7.63 57.60
S 64.24 35.76 0.00 0.00 0.00
26 1300 L + ZnO L 9.17 13.42 59.46 7.67 10.28 77.41
Z 0.00 100.00 0.00 0.00 0.00
27 1100 L + Spinel L 14.90 3.29 67.96 5.86 7.99 81.80
S 64.93 35.07 0.00 0.00 0.00
27 1200 L + Spinel L 14.22 7.26 60.34 8.12 10.06 78.52
S 66.84 33.16 0.00 0.00 0.00
28 1100 L + Ca3-xPbxSi2O7 L 8.33 3.71 72.54 5.56 9.86 87.96
CSP 0.00 0.00 82.99 11.58 5.43
28 1200 L + Ca3-xPbxSi2O7 L 7.89 2.85 68.63 8.53 12.09 89.26
CSP 0.00 0.00 43.23 34.72 22.05
29 1100 L + Ca3-xPbxSi2O7 L 2.55 2.66 76.20 7.16 11.43 94.79
CSP 0.00 0.00 43.32 33.99 22.69
29 1200 L + Ca3-xPbxSi2O7 L 2.52 8.58 68.93 7.91 12.06 88.90
CSP 0.00 0.00 43.03 34.58 22.39
29 1300 L + Ca3-xPbxSi2O7 L 5.07 6.64 63.54 11.40 13.35 88.29
30 1100 L + Ca3-xPbxSi2O7 L 13.60 0.00 70.58 6.27 9.56 86.40
CSP 0.00 0.00 43.32 33.99 22.69
31 1100 L + ZnO L 0.00 9.60 83.39 2.17 4.84 90.40
Z 0.00 93.64 6.36 0.00 0.00
Table 2. Experimental data on the Section with a CaO/SiO2 weight ratio of 1.1 and PbO/(CaO+SiO2) weight ratio of 2.4.
PCS: PbO + CaO + SiO2
Figure 4. Experimentally determined liquidus surface on the
pseudo-ternary section of “Fe2O3”-ZnO-(PbO-CaO-SiO2) for slags with CaO/ SiO2 and PbO/(CaO+SiO2) weight ratios of 1.1 and 2.4, respectively.
CaO or SiO2 in solid solution, then the CaO/SiO2 and PbO/ (CaO+SiO2) ratios in the liquid phase do not change. The
SEM-EDS measurements of the glass compositions were suicient to construct liquidus surfaces in these primary phase ields.
As indicated, the general ternary phase diagram rules
can be applied to the zincite and spinel primary phase ields
of the pseudo-ternary section; then, the compositions and proportions of the phases present in a slag of a particular overall composition can be derived from the diagram for any temperature using tie-line. Using these rules, we were
able to estimate the position of the isotherms at 1100, 1200 and 1300ºC in Figure 4.
The ternary phase diagram rules cannot be applied in the
melilite and calcium silicate primary ields, as the liquid and
solid compositions do not lie on the pseudo-ternary section; however, the liquidus temperatures for compositions in these
primary ields can be deined. Figure 4 shows the isotherms
at 1100 and 1200ºC obtained experimentally in the calcium
silicate primary ield. There is uncertainty about the spinel/
melilite and melilite/silicate boundary lines; therefore, this part of the diagram was deduced from experimental and FACTSage predictions8. The special point E was experimentally
determined at 1020ºC, 10% Fe2O3, 7% ZnO and 83% (PbO+CaO+SiO2), which represents the intersection of the spinel/zincite, spinel/melilite and zincite/melilite boundary lines, with the minimum liquidus temperature.
The SEM-EDS measurements in Table 2 show that all
the zinc and iron are present in the liquid, zincite, spinel and
melilite phases. These are the primary phase ields directly
relevant to lead and zinc sinters. As the systems are cooled to temperatures below the liquidus, the remaining liquid phase becomes enriched in PbO and the liquid compositions approach those described by the PbO-CaO-SiO2 ternary system.
3.2. Microstructure
Examples of microstructures observed at diferent
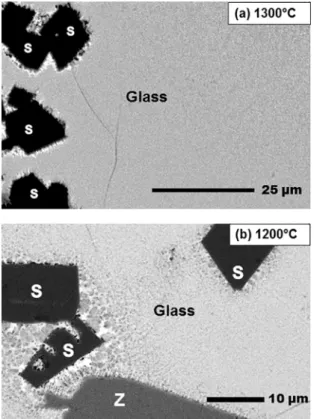
temperatures for slag sample number 23 are presented in
Figure 5. Micrographs of the slag sample 23 equilibrated and quenched from (a) 1300ºC and (b) 1200°C. S: spinel, Z: zincite.
solid to form is spinel, when the liquid compositions reach the boundary line of spinel-zincite there is a coprecipitation of spinel and zincite. As the cooling of the sample continues
to point E in the phase diagram, melilite starts to precipitate
and the liquid composition leaves the composition of the pseudo-ternary section.
Figure 5a shows that at 1300 ºC the slag system is
constituted of two clearly diferent phases; the dark angular
crystals (S) correspond to spinel with a composition close to that of franklinite (ZnFe2O4: 33.67 wt% ZnO and 66.33 wt% Fe2O3), and the gray background corresponds to the liquid converted into glass during the quenching process. The composition of the glass phase in this sample, measured
with EDS, gives one point that lies in the 1300ºC isotherm of
the pseudo-ternary phase diagram. The equilibrium phases at 1200ºC are shown in Figure 5b. It is observed that there are three phases in equilibrium: spinel (S), glass, and gray oval precipitates corresponding to zincite (Z). At 1200ºC the composition of glass is on the boundary line of spinel
and zincite primary phase ields.
The crystallization of sample 24 is illustrated in Figure 6.
Zincite is the irst solid to form (Figure 6a). On cooling
further, the liquid composition reaches the boundary line spinel/zincite and coprecipitation of zincite and spinel begins (Figure 6b).
It is worth mentioning that at high temperatures (1100-1300ºC) the stable phases are liquid and one or more solids;
Figure 6. Micrographs of the slag sample 24 equilibrated and quenched from (a) 1300°C and (b) 1200°C. S: spinel, Z: zincite.
however, after cooling the samples the glass phase obtained together with the solid phases can be considered as metastable phases at room temperature.
3.3. X-Ray difraction results
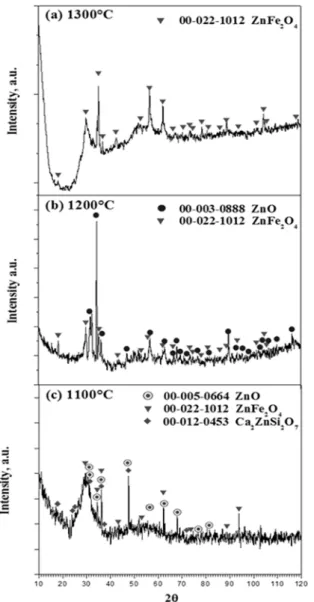
XRD analysis was used to conirm the phase identiication. Figure 7 shows the XRD patterns obtained from the slag
number 23 equilibrated at three temperatures (1300, 1200 and 1100ºC) and quenched to room temperature. Figure 7a shows that at 1300ºC, the spinel ZnFe2O4 (JCPD ile 22-1012) is the only crystalline phase, which is in agreement with
the SEM-EDS results shown in Figure 5a. When the liquid
composition reaches the spinel/zincite boundary line, spinel
and zincite ZnO (JCPD ile 003-0888) coprecipitate, as shown in the XRD pattern of Figure 7b. At 1100ºC, the XRD pattern
of Figure 7c shows that the slag contains spinel (ZnFe2O4), zincite and melilite with the composition Ca2ZnSi2O7 (JCPD
ile 012-0453).
3.4. Application to plant practice
The lead blast furnace is a reactor where the charge moves through a vertical shaft in counter-current to the
ascending reducing gas low. The produced liquid phases
Figure 7. X-Ray difraction patterns for slag sample 23 equilibrated at diferent temperatures.
crucible and separated by density gradient. The sinter
produced in Mexico has historically been diferent from that
form around the world in that the Mexican sinter contains high concentrations of silver and bismuth. The recovery of precious metals during lead production in a blast furnace
makes this process more proitable. Losses of silver and lead
are common in this process and can be due to both physical and chemical phenomena. Lead can be trapped as metallic particles in the slag11, due to its composition and viscosity.
The information provided in the pseudo-ternary section of the slag system can be used in practical applications to
predict the efect on the slag viscosity of increasing ZnO
content. Figure 8 shows the composition of the slags in the Mexican plant which have ZnO compositions of 14 and 22
wt%. This igure also shows the cooling paths for the slags
with low (14 wt% ZnO) and high (22 wt% ZnO) together with the point compositions of the liquids in equilibrium
Figure 8. Pseudo-ternary section of “Fe2O3”-ZnO-(PbO-CaO-SiO2)
with the cooling path of two diferent slags in a commercial lead
blast furnace.
with spinel at temperatures under the liquidus surface. The compositions of the liquid phase were used to estimate their viscosity using the FACTSage program8.
Figure 9 shows the changes during cooling in the viscosity of the liquid phase, in terms of temperature and ZnO content, for both slags, with low and high ZnO content. It is evident that increasing the ZnO content in the slag increases the viscosity and, therefore, the possibility that valuable metals can be trapped in the slags during the tapping stage is also increased.
Figure 9. Efect of temperature and ZnO content on the liquid slag
viscosity calculated with FACTSage software8.
4. Conclusions
An experimental study of quenched synthetic slag samples in the system PbO-ZnO-CaO-SiO2-“Fe2O3” with the weight ratios CaO/SiO2 = 1.1 and PbO/(CaO+SiO2) =
2.4 was carried out. The XRD and SEM-EDS techniques
were used to identify the solid phases that were formed in equilibrium with the liquid at a high temperature.
in the temperature range of 1100-1300ºC. The isotherms in
the spinel, zincite and silicates primary phase ields were
experimentally obtained, as well as the boundary lines for spinel/zincite and zincite/melilite. The thermodynamic software FACTSage was used to calculate the boundary line of melilite/silicates in the (PbO+CaO+SiO2) rich region.
An application of the phase diagram is the estimation of the composition of the liquid phase that remains once the crystallization process begins; then, its viscosity can be calculated by commercial software.
5. Acknowledgements
The authors thank Servicios Administrativos Peñoles
S.A. de C.V. for providing inancial support for this project. The authors also wish to thank the Institutions CONACyT, COFAA and Instituto Politécnico Nacional for their
permanent support.
6. References
1. Zhao JC, ed. Methods for Phase Diagram Determination.
London: Elsevier Science; 2007. p. 114-118.
2. Habashi F, ed. Handbook of Extractive Metallurgy: Primary
metals, secondary metals, light metals. Volume 2. Hoboken:
Wiley; 1997.
3. Jak E, Hayes PC. Phase Chemistry of Lead Smelting Slags.
In: Proceedings of Lead-Zinc 2010 Conference; 2010 Oct 3-6;
Vancouver, Canada. TMS; 2010. p. 1161-1176.
4. Perez M, Romero A, Hernandez A, Almaguer I, Benavides
R. Distribution of lead and silver under lead blast furnace
conditions. Revista de Metalurgia. 2012;48(3):213-222. DOI: 10.3989/revmetalm.1150
5. Jak E, Zhao B, Hayes PC, Harvey I. Experimental study of phase
equilibria in the PbO-ZnO-“Fe2O3”-(CaO+SiO2) system in air
for the lead and zinc blast furnace sinters (CaO/SiO2 weight ratio of 0.933 and PbO/(CaO+SiO2) ratios of 2.0 and 3.2).
Metallurgical and Materials Transactions B.
2003;34(4):383-397. DOI: 10.1007/s11663-003-0065-2
6. Jak E, Hayes PC. Experimental study of phase equilibria in
the PbO-ZnO-“Fe2O3”-CaO-SiO2 system in air for high lead smelting slags (CaO/SiO2 = 0.35 and PbO/(CaO+SiO2) = 5.0 by weight). Metallurgical and Materials Transactions B. 2002;33(6):817-825. DOI: 10.1007/s11663-002-0065-7
7. Jak E, Hayes PC. The efect of the CaO/SiO2 ratio on the phase equilibria in the ZnO-“Fe2O3”-(PbO + CaO + SiO2) system in air: CaO/SiO2 = 0.1, PbO/(CaO + SiO2) = 6.2, and CaO/SiO2 = 0.6, PbO/(CaO + SiO2) = 4.3. Metallurgical and Materials
Transactions B. 2003;34(4):369-382. DOI:
10.1007/s11663-003-0064-3
8. Thompson WT, Bale CW, Pelton AD. Facility for the Analysis
of Chemical Thermodynamics (FACTSage). Montreal: Ecole
Polytechnique; 2016. Available from: <http:www.crct.polymtl. ca>. Access in: 24/5/2017
9. Kim WY, Pelton AD, Decterov SA. Modeling the Viscosity
of Silicate Melts Containing Lead Oxide. Metallurgical and
Materials Transactions B. 2012;43(2):325-336. DOI: 10.1007/
s11663-011-9610-6
10. Shevchenko M, Hidayat T, Hayes PC, Jak E. Experimental
Study of Liquidus of the “FeO”-SiO2-PbO Slags in Equilibrium with Air and with Metallic Lead. In: Proceedings of the 10th
International Conference on Molten Slags, Fluxes and Salts;
2016 May 22-26, Seattle, WA, USA. p. 1221-1228.
11. Cháidez-Felix J, Romero-Serrano A, Hernández-Ramirez A, Pérez-Labra M, Almaguer-Guzman I, Benavides-Perez R, et
al. Efect of copper, sulfur, arsenic and antimony on the silver
distribution in the phases of the lead blast furnace. Transactions
of Nonferrous Metals Society of China. 2014;24(4):1202-1209.