The creep in concrete is a phenomenon that occurs due the water movement within the concrete and it is inluenced by several factors that act simultaneously. Some of these factors are the environmental conditions (relative humidity and temperature) to which the element or the specimen is submitted. This paper compares the experimental results from drying creep of specimens loaded at different ages and kept in a controlled envi -ronment (climatic chamber) versus those from an uncontrolled ambience. In addition, comparisons are made among the experimental results with those from prediction models available in the literature. From the results it can be noted that changes in humidity during the irst month of testing have the greatest inluence on creep and that concrete loaded at higher ages have lower creep. Regarding the prediction models, it was observed that the ACI and GL models are those that best anticipate creep occurrence.
Keywords: self-compacting concrete, drying creep, prediction models.
A luência é um fenômeno que ocorre devido à movimentação de água no interior do concreto e é afetada por vários fatores que agem simulta -neamente. Dentre estes fatores estão às condições do ambiente (umidade relativa do ar e temperatura) ao qual o elemento, ou corpo de prova, está submetido. Neste trabalho são feitas comparações entre resultados experimentais de luência por secagem de corpos de prova carregados em idades diferentes e mantidos em ambiente controlado (câmara climatizada) e não controlado. Além disso, são feitas comparações entre estes resultados com os fornecidos por modelos de previsão disponíveis na literatura. A partir dos resultados pode-se notar que alterações da umidade durante o primeiro mês de ensaio apresentam maior inluência nas deformações e que concretos carregados com maiores idades apresentam me -nores deformações por luência. Foi observado na comparação entre modelos de previsão que o modelo do ACI e GL melhor preveem a luência.
Palavras-chave: concreto auto adensável, luência por secagem, modelos de previsão.
Inluence of the environment and loading age
on SCC drying creep
Inluência das condições do ambiente e idade de
carregamento na luência por secagem do CAA
A. C. MARQUES a
T. N. BITTENCOURT b
M. P. BARBOSA c
a Department of Structure and Geotechnical Engineering, University of São Paulo, [email protected], av. Professor Almeida Prado n.83 tv.2,
Cidade Universitária, CEP05508-900, São Paulo-SP, Brazil;
b Department of Structure and Geotechnical Engineering, University of São Paulo, [email protected], av. Professor Almeida Prado n.83 tv.2,
Cidade Universitária, CEP05508-900, São Paulo-SP, Brazil;
c Department of Civil Engineering, São Paulo State University, [email protected], alameda Bahia n.550, Centro, CEP:15385-000,
Ilha Solteira-SP, Brazil.
Received: 09 Dec 2011 • Accepted: 09 Sep 2012 • Available Online: 05 Apr 2013
Abstract
1. Introduction
Creep basically consists in the deformation increasing on a loaded element when stress is kept constant [1]. This constant external load becomes the driving force for the movement of the adsorbed and capillary water. Thus, the creep deformation can occur even with a 100% relative humidity [2].
It is usually classiied into basic and drying creep. The basic creep occurs without moisture exchange with the environment. Accord -ing to Mehta and Monteiro [2], basic creep usually occurs in large structures where drying shrinkage can be neglected. As for the drying creep is observed when concrete is submitted to a less than 100% relative humidity environment.
Considering that the gradual increase of the creep deformation can be several times greater than the one observed at the time of loading, it proves to be very important for structures. It affects the deformation and vertical displacements and often also the stress distribution. However depending on the structure, these effects may vary. For example, to the concrete mass it is an important parameter, because its effect results in relaxation of the thermal stresses from the concrete cooling. As for the prestressed con -crete, it contributes to the loss of prestressing tension [3]. The moisture movement in the hardened cement paste, which es-sentially controls the drying shrinkage and creep strains in con -crete, is inluenced by many factors that interact simultaneously [2]. Among the factors that inluence this property are: material type and concrete dosage, additives and admixtures, chemical composition and cement ineness, the relative humidity and ambi -ent temperature, curing conditions and conservation, the geometry of the concrete element, age at loading and concrete strength. Neville [4] states that one of the most important factors that inlu -ence the creep of concrete is the relative humidity of the air that surrounds it. For creep, the relative humidity affects the concrete drying, and it is important to distinguish between the drying that occurs before and after loading. The drying while the member is loaded, increases creep, which is called drying creep. However, in concrete members which have reached the hygroscopic equi
-librium with the environment before loaded, the inluence of the relative humidity is lower.
Regarding the temperature, it may have two opposing effects on creep. Mehta and Monteiro [2] reported that if a concrete member is subjected to a temperature greater than the environment as a curing before loaded, the strength will increase and creep strain is smaller than that from a concrete stored at a lower temperature. This is because the temperature accelerates hydration, reducing creep. On the other hand, the exposure to high temperatures dur -ing the load can increase the creep.
In mortar tests, made by Neville [5], considering the variation of humidity over time, the results show that creep is increased when the specimens are exposed to moisture variation only if the load is applied before the irst drying. Exposure of mortar specimens to an alternating relative humidity between 50 and 70% show that creep is almost as big as the measured on specimens kept in a constant relative humidity of 50%, and higher than the average relative humidity of 60%. This suggests that by alternating the rela -tive humidity, creep will be increased beyond that obtained with the lower limit of moisture. The same author also show the study of the behavior of concrete exposed to relative humidity variations in an environment protected from weather (humidity ranging from 60 to 90%), comparing them with results from laboratory specimens kept at 50% moisture. From the results it seems to be no substan -tial difference in the total strain or creep between the specimens kept in an environment with relative humidity ranging from 60 to 90%, when compared to specimens kept in constant humidity of 50%. Therefore, caution should be exercised in applying results with constant moisture for ield applications.
As for the age at loading, the creep of concrete loaded at early ages is greater in the irst weeks of loading compared to concrete loaded at higher ages. This behavior is due to the higher degree of hydration of the older concrete, which have internal structure more compact and less water available [3]. For loading ages superior to 28 days, the inluence of age is very small [6].
In this paper comparisons are made between results obtained from drying creep specimens loaded at different ages and kept in a climate-controlled chamber and specimens left in an uncon -trolled environment of relative humidity and temperature. In addi -tion, comparisons are made between the experimental results and prediction models available in the literature.
2. Materials and methodology
The self compacting concrete of this paper is tested both in fresh and hardened state. The tests performed in the fresh SCC were: slump-low, low-rate, V-funnel, and L-box. The tests performed in the hardened SCC were: compressive strength, splitting tensile strength, modulus of elasticity and drying creep.
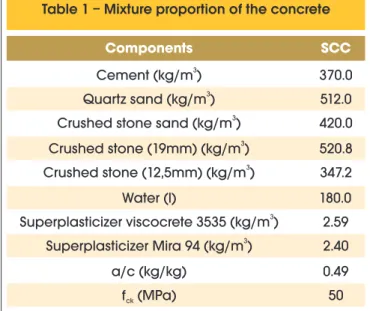
The concrete was made with cement-type CP-II-E-40 from Vo -torantim Cimentos Brasil S.A., granitic coarse aggregate (maxi -mum size 12,5mm), coarse aggregate from limestone, quartz sand and artiicial sand (from crushed stone). The superplasticizers used were polyfunctional Mira 94 from Grace Construction Products and viscocrete 3535 from Sika SA. The mixture used is shown in Table 1 and the physical characterization of coarse and ine aggregates are in Table 2. In Figure 1 are shown the gradation curves of all aggregates used.
The materials of the mixture were weighted and the aggregates
Table 1 – Mixture proportion of the concrete
Components
SCC
3
Cement (kg/m )
370.0
3
Quartz sand (kg/m )
512.0
3
Crushed stone sand (kg/m )
420.0
3
Crushed stone (19mm) (kg/m )
520.8
3
Crushed stone (12,5mm) (kg/m )
347.2
Water (l)
180.0
3
Superplasticizer viscocrete 3535 (kg/m )
2.59
3
Superplasticizer Mira 94 (kg/m )
2.40
a/c (kg/kg)
0.49
creep test are similar to those from the compressive strength test, the molds have some changes when compared to the usual ones because of the metallic plates at the ends of the specimen (diam -eter of 15cm and 2cm thick). So the molds were 15x34cm, in order to keep the specimen 30cm height.
The metallic plates are placed at the ends of the specimen to en -sure latness and uniformity of the applied load. The upper plate is solid and the lower plate has a hole and a slot (as prescribed in NBR8224 [13]) which allows the passage of the embedded strain gage cable. Furthermore, to ensure their attachment to the speci -men, the bottom plate has a metal clamp. The mold also splits, in order to facilitate the instrumentation procedures and has an oriice because of the strain gage cable. In Figure 2, can be seen the mold used for the creep test.
The procedure adopted for the creep test starts by setting the strain gage in the mold, which is made by centralizing it in the longitudinal axis of the mold. After closing the mold, oil is spread inside of it to facilitate the removal of the specimen. After placed the concrete, the upper plate is placed and leveled. These procedures are de-tailed in Marques et al. [14].
Once casted, the specimens were kept in the molds until the date of the test (14 or 49 days). The demold of each group was made only at the test date and the loading was according to NBR8224 [13], i.e. the total load was applied in 30s and before the inal loading, it was preceded for two consecutive loading and unload -ing cycles.
were previously oven-dried. The mixing of the concrete and the specimens cast were made in the Laboratório de Estruturas e Ma -teriais estruturais (LEM), of EPUSP. The fresh SCC tests were made after mixing and before casting the test specimens. Those tests were performed according to NBR15823-2 [7], NBR15823-4 [8] and NBR15823-5 [9].
The compressive strength, splitting tensile strength and modulus of elasticity tests were made according to NBR5739 [10], NBR7222 [11] and NBR8522 [12], respectively, for 7, 14, 28, and 49 days. Three specimens were casted for each test and for each age (total of 36 specimens) The creep test was made according to NBR8224 [13], and was divided into two groups. The irst group was loaded at 14 days and the second one at 49 days. In Table 3 is shown the amount of specimens for each group of drying creep test.
Besides the two ages at loading, tests were also made both inside and outside a climated-controlled chamber at 60 ± 4% of humidity and 23º ± 1 of temperature.
2.1 Procedures adopted for the drying creep test
The creep test uses cylindrical specimens of 15x30cm. The instru -mentation used are embedded electrical strain gage from KYOWA, type KM-120-120-H2-11W1M3. Although the specimens for the
Table 2 – Aggregates physical characteristics
Material
Test
Quartz sand
sand
Crushed
Crushed
stone
stone
(12.5mm)
Crushed
stone
(19mm)
Maximum aggregate size (mm)
0.60
2.40
9.50
19.0
Fine check sum (%)
1.40
3.10
0.50
0.80
Fineness modulus (%)
1.28
2.62
5.67
6.93
3
Specific gravity (g/cm )
2.69
2.70
2.68
2.81
3
Bulk dry specific gravity (g/cm )
2.66
2.65
2.63
2.79
3
Bulk SSD specific gravity (g/cm )
2.67
2.66
2.64
2.80
Figure 1 – Aggregates gradation curves
Table 3 – Specimens for creep tests
Test
Age (days)
14
49
Drying creep
2
2
Drying creep (out the
climated-controlled chamber)
2
2
Drying shrinkage
1
1
Drying shrinkage (out the
climated-controlled chamber)
1
1
According to NBR8224 [13], the creep strain is given by subtract -ing the elastic deformation and the unloaded specimen strain from the total strain. The elastic deformation is the one obtained after the 30s after the third load.
2.2 Creep predicting models
The purpose of the prediction models is to provide, to designers, conditions to estimate the creep and shrinkage strains with some accuracy, using known parameters [15].
There are several factors that affect creep, and it is hard to ac -curately predict it since different physical mechanisms interacts among each other and are inluenced by these parameters [16]. Because it is a long-term test, these properties are not often exper -imentally determined and, in the absence of experimental results for creep or shrinkage, it can be estimated by prediction models that are available in standard codes and the literature. This paper uses the creep prediction models from NBR6118 [17], Eurocode 2 [18], ACI 209R [19], B3 [16], and GL [20]. It is also discussed some factors that might interfere its use for SCC and the input data adopted for each model.
The comparison between experimental results and the ones ob-tained by the prediction models will be gauged by the compliance function (J).
All the analyzed prediction models can be used for an applied load of up to 40% of the compressive strength of the specimen at the loading age, with the exception of EC2, which allows stress up to 45% of the characteristic compressive strength of the concrete and B3 which can be used for a stress up to 45% of the average compressive strength of the concrete.
Other input data is the slump, which is used only by NBR6118 [17] and ACI 209R [19] prediction models. According to the NBR6118 [17], the concrete slump must be used without additives. As for ACI 209R [19], it is considered the slump of the mixture. This paper The applied load both in the irst group (14 days specimens) and
the second group (49 days specimens) were set at 30MPa, which corresponds to 30% of the compressive strength of the specimen at 14 days. This value is ixed due to the limitation of the load appli -cation system which maximum stress allowed is 30MPa. The load systems used inside and outside the climated-controlled chamber can be seen at Figures 3 and 4.
As previously said, the specimens undergo two cycles of loading and unloading before the inal load is applied. Therefore, the initial strain is the one obtained after the removal of the second load. After that, the specimens are loaded for the third time and measured the strain after 30s (as prescribed in NBR8224 [13]). The data acquisition equipment was set to register the measurement data every 30s on the irst day and every hour after the second day until the end of the test.
Figure 2 – Split creep mold
Orifice for the strain gage cable
Figure 3 – Manual pump and hydraulic
accumulators coupled to the manifold
in order to decrease the pressure loss
hydraulic accumulators
compares experimental results with those provided by NBR6118 [17] and ACI 209R [19] prediction models using slumps before and after the addition of additives (5cm and 28cm, respectively). Among the prediction models, the B3 [16] has more input data and needs the mixture composition. The range allowed for the material parameters are:
n Mean compressive strength (f
cm): 17 ≤ fcm ≤ 70 MPa; n water/cement ratio (a/c): 0.35 ≤ a/c ≤ 0.85;
n Cement content (c): 160 ≤ c ≤ 720 Kg/m³;
n aggregate/cement ratio in weight (ag/c): 2.5 ≤ ag/c ≤ 13.5.
The prediction model that requires less data is the GL [20], which only speciication concerning the cement is its type, which is con -sidered in all prediction models.
Although the prediction models uses equations to predict the modulus of elasticity from the compressive strength results, in this paper were used the experimental results of compressive strength and modulus of elasticity.
Besides the compatibility of the prediction models input, it is also necessary to establish a criteria for their comparison. A method widespread in the literature is proposed by Bažant and Panula [16]. The authors developed a statistical coeficient used for the com -parison between the experimental results and predictions models (wB3). According to Bažant and Baweja [16], it is considered a good approximation the models with a coeficient up to 25%.
3. Results and discussions
The characterization tests results of the fresh SCC (slump-low, low-rate, V-funnel, and L-box) are shown in Table 4. As can be seen, the results of slump-low, V-funnel, and L-box are consistent with the concretes prescribed by NBR 15823-2 [7], NBR 15823-5 [9] NBR 15823-4 [8] as concrete of class SF1, VS2, VF2 and PL2.
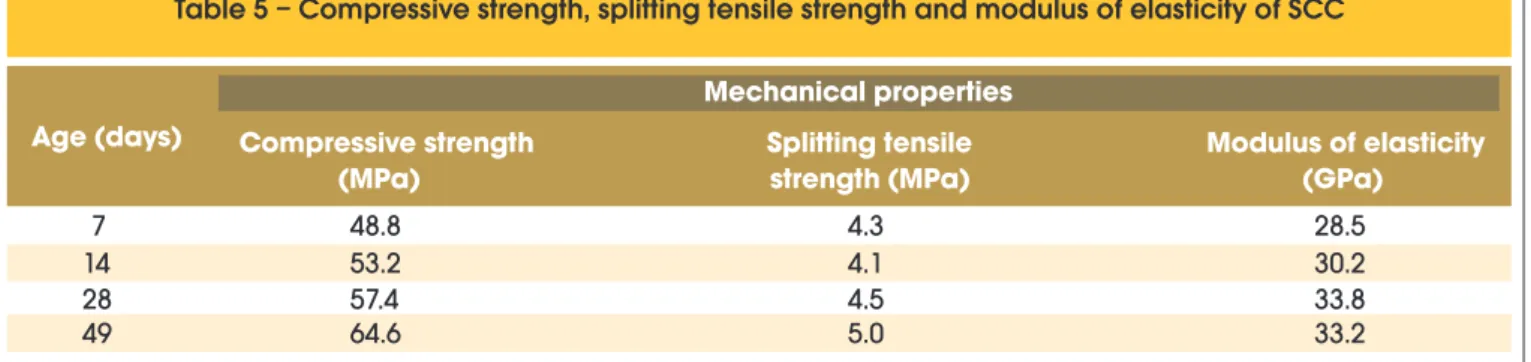
The hardened SCC characterization was made by compressive strength, splitting tensile strength, elastic modulus and drying creep tests. The mean results from three specimens of the irst three tests are shown in Table 5. Those tests are made in order to evaluate the material behavior over time and to provide data for the creep prediction models, used in this paper.
The drying creep and drying shrinkage tests were made in both specimens that was outside and inside the climated-controlled chamber (humidity of 60 ± 4% and temperature of 23 ± 1ºC). From this comparison it is possible to verify the inluence of the environ -ment on the long-term deformations.
The label for the specimens are according to the following order: test condition (humidity and constant temperature - Chamber or variations in humidity and temperature - Outside chamber), age at loading or drying (14 days - 14 or 49 days - 49), the specimen number (specimen 1-1 or specimen 2-2).
The measured strains for both drying creep and drying shrinkage specimens can be seen in Figure 5.
As can be seen in Figure 5, the creep strains of the specimens loaded at 14 days, and kept inside the climated-controlled chamber, have higher total strain (approximately 2200me) than the specimens kept outside the chamber (approximately 1800me). This difference can be attributed mainly to the environmental humidity, since the
Table 4 – Properties of fresh SCC
Test
Data
the standard code
Limits specified by
Slum-flow (mm)
605
550 a 650 (SF1)
Flow-rate T (s)
500
5
>2 (VS2)
L-Box (H /H )
2 1
0,8
≥0,8 (PL2)
V-funnel (s)
9
9 a 25 (VF2)
Table 5 – Compressive strength, splitting tensile strength and modulus of elasticity of SCC
Age (days)
Mechanical properties
Compressive strength
(MPa)
Splitting tensile
strength (MPa)
Modulus of elasticity
(GPa)
7
48.8
4.3
28.5
14
53.2
4.1
30.2
28
57.4
4.5
33.8
49
64.6
5.0
33.2
Figure 5 – Drying creep and drying shrinkage
deformations for both 14 and 49 days at loading
0 50 100 150 200 250 300 350 400 -1800
-1600 -1400 -1200 -1000 -800 -600 -400 -200 0
C
re
ep
de
fo
rm
at
io
n
(
)
Time (days)
average temperature outside the chamber for the irst month of load -ing was 20ºC. In this same period, the average humidity outside the chamber for the irst month of testing was 68%, while the average humidity during the same period inside the chamber was 60%. Regarding the creep results for the second load, it is observed that the results of the specimens inside and outside the chamber are close to each other, presenting approximately 200me of difference. During the irst month of the test for specimens loaded at 49 days, the humidity outside the chamber was 64%.
A similar behavior can be observed in Figure 6, which shows the
experimental compliance function results. As previously stated, during the second loading, the relative humidity inside and outside the chamber showed a difference of about 4%, which is within the accepted variation limits of humidity inside the chamber. This has relected on the experimental results by the proximity among the compliance function curves shown in Figures 5 and 6.
The creep strain was obtained by subtracting the drying shrinkage specimen strain from the mean strain from the loaded specimens. After obtaining the experimental curve, the results were divided by the applied load value, to originate the compliance function (J). The Figure 6 shows the experimental compliance function curves from specimens loaded at 14 days (Chamber-14) and 49 days (Chamber-49). It can also be seen the curves from specimens kept outside the chamber.
As can be seen in Figure 6, the values for the compliance function for 365 days from specimens loaded at 14 days was 99me/MPa and 78me/MPa regarding specimens kept inside and outside the cham -ber, respectively (i.e., a difference of 21% between the results). As for the results from the specimens loaded at 49 days, were approx -imately 72me/MPa and 82me/MPa for those which remained outside and inside the chamber, respectively. These results show a 12% difference between the measured values. The proximity between the results obtained from the specimens loaded at 49 days were already expected, since the relative humidity inside and outside the chamber was similar during the test beginning.
The lowest compliance function value for the specimens kept in an environment with higher relative humidity was expected because, according to Mehta and Monteiro [2], and Neville [5], it would be expected that the increase in atmospheric humidity would retard the relative moisture low rate from the interior to the exterior sur -faces of the concrete.
Comparing the compliance function from specimens kept inside and outside the chamber, it can be seen that there is a difference
Figure 6 – Compliance function for both
age at loading and storage condition
Figure 7 – Comparison among experimental
and prediction model results for
specimens kept inside the climated-controlled
chamber and age at loading of 14 days
Figure
8 – Comparison among experimental
and prediction model results for
of 16% and 10%, respectively, between the results concerning a 365 days period. The decrease in the compliance function value for specimens loaded later was expected since their degree of hy -dration is higher and they have less available water (fact reported by Neville [4]). This behavior was also experimentally obtained by Equipe de FURNAS [3], Kalintzis [22], Takeuti [23], and oth -ers. The proximity among the compliance function values for the specimens kept outside the chamber was due to the higher relative humidity for the loading at 14 days (68%), which decreased the compliance function value to this age.
Besides the comparison between experimental results, they were also compared to some prediction models available in the literature The compliance function from experimental and prediction models results are shown in Figures 7, 8, 9, and 10. In Figure 7 is shown the compliance function from experimental results regarding the irst age at loading (14 days) for specimens kept inside the cham -ber, compared to the compliance function for the prediction mod -els. In Figure 8 is shown the comparison made between the experi -mental compliance function and the predicted ones for specimens loaded at 14 days and kept outside the chamber.
As can be seen at Figures 7 and 8, several prediction models are close to experimental results. The comparison among the experi -mental and the prediction models results is made by using the co -eficient of variation (wB3).
As prediction models do not consider the variation of the relative humidity over time, it was set as input the mean relative humidity for the irst month of the test. The table 6 shows the input data used for each prediction model.
The same comparison with the prediction models and the results inside and outside the chamber was made for the specimens load -ed at 49 days. In Figures 9 and 10 are shown respectively the curves of experimental compliance function and of the prediction models for the specimens kept inside and outside the chamber.
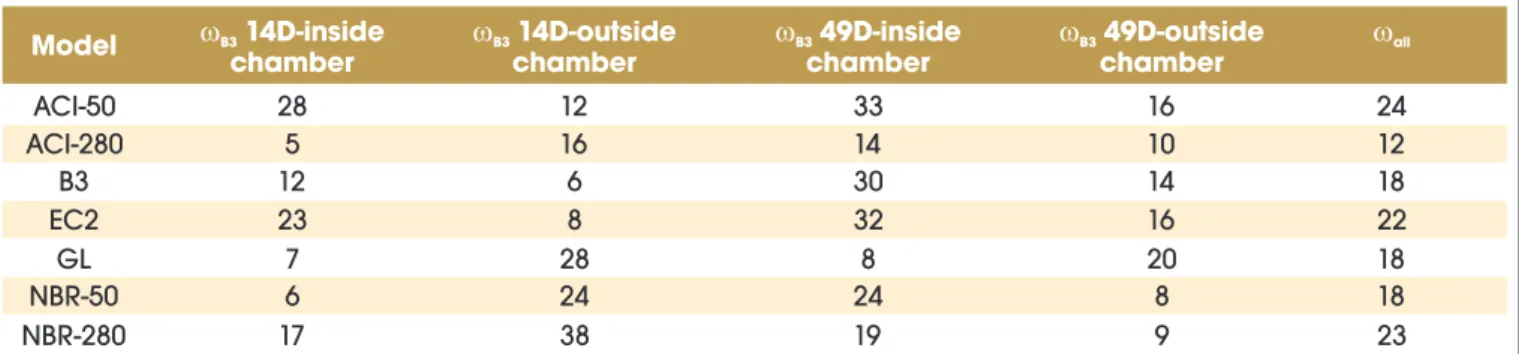
The table 7 shows the coeficient of variation (wB3) obtained for
all prediction models regarding each load age and environmental condition. It is also shown the overall coeficient of variation of the deviations of the models proposed by Bažant and Baweja [16]. Considering acceptable error values up to 25% for wB3 coeficient, it
can be seen at Table 7 that, although some prediction models can -not predict the behavior of the specimens load at 49 days and kept inside the chamber, in general all prediction models are suitable. Among the analyzed models, it was observed that most of them presents good prediction compared to the experimental results (wB3 approximately 18%). However, more comparisons among the prediction models and experimental results from different SCC mixtures varying the type and amount of cement and types of ag -gregates are necessary, in order to corroborate if those prediction models can be used for SCC’s.
4. Conclusions
From the experimental and prediction model results it can be seen that:
n Regarding the fresh SCC tests, all results were within the limits
set by the Brazilian standard code. The concrete used is clas -siied as SF1, VS2, VF2 and PL2;
n It was found that the variation of humidity during the irst month
test is signiicant for the drying creep test. This interference is attributed to the greater availability of water movement in the early ages;
n Specimens loaded at 49 days presented lower results for com -pliance function. This is due to the higher degree of hydration of the concrete at the age of 49 days and less available water.
n All the studied prediction models could predict the creep of the
analyzed SCC. Among the used prediction models, most of them showed a wB3 coeficients about 18%;
n It is still necessary to perform creep tests with different SCC
Figure 9 – Comparison among experimental
and prediction model results for
specimens kept inside the climated-controlled
chamber and age at loading of 49 days
Figure 10 – Comparison among experimental
and prediction model results for specimens
mixtures, varying the type of cement, type and proportion of aggregates and additions, in order to verify whether the predic -tive models are suitable or not for this type of concrete.
5. Acknowledgements
The authors would like to thanks FAPESP (Fundação de Amparo à Pesquisa de São Paulo) for the inancial support and Engemix for affording the materials used in this paper.
6. References
[01] Husni, R.; Benítez, A.; Manzelli, A.; Macchi, C.; Charreau, G.; Risetto, J.; Luco, L. F.; Guittelman, N.; Morris, W. Ações sobre as estruturas de concreto.
In: HELENE, P. Manual de reparo, proteção e reforço de estruturas de concreto. Red Rehabilitar, 2005. 1, p.37-104.
[02] Mehta, P. K.; Monteiro, P. J. M. Concreto – estrutura, propriedades e materiais. PINI, São Paulo, 2008. [03] Equipe de FURNAS, Laboratório de concreto,
Departamento de apoio e controle técnico, Concretos: massa, estrutural, projetado e compactado com rolo. Editor: Walton Pacelli de Andrade, PINI, São Paulo, 1997. [04] Neville, A. M. Propriedades do concreto. São Paulo,
PINI, 828p., 1997.
[05] Neville, A. M.; Dilger, W. H., Brooks, J. J. Creep of plain concrete. London, New York, Construction Press, Estados Unidos, 361p., 1983.
[06] Neville, A. M. Creep of concrete: plain, reinforced, and
Table 6 – Prediction models input data
Input data
ACI
Ec2
B3
GL
NBR
Type of cement
f
cm28(Mpa)
f (Mpa)
ckRelative humidity
t (age at loading in days)
0t (age at cure end in days)
ct (end o test in days)
fNotional size(h )
0Ratio V/S (mm)
Applied load (Mpa)
Temperature (°C)
E
cm28(Mpa)
Slump (mm)
3
Water content (kg/m )
3
Cement content (kg/m )
Air content (%)
Fine aggregate percentage (%)
3Total aggregate (kg/m )
3
Unit weight of concrete (kg/m )
Type of cure
ASTM I
57.4
-60%
14/49
-365
-37.5
15
-33800
50/280
-2
51,8
-2300
moist
N
-49.4
60%
14/49
-365
75 mm
-15
23
33800
-ASTM I
57.4
-0.6
14/49
14/49
365
-37.5
15
-33800
-180
370
-1800
-ASTM I
57.4
-0.6
14/49
14/49
365
-37.5
15
-33800
-CP II
-49.4
60%
14/49
-365
0.075m
-15
23
33800
50/280
-Table 7 – Coefficient of variation between experimental results and the prediction models
Model
B314D-inside
chamber
B314D-outside
chamber
B3chamber
49D-inside
B349D-outside
chamber
allACI-50
28
12
33
16
24
ACI-280
5
16
14
10
12
B3
12
6
30
14
18
EC2
23
8
32
16
22
GL
7
28
8
20
18
NBR-50
6
24
24
8
18
prestressed. North-Holland Publishing Co, 662p., 1970. [07] ASSOCIAÇÃO BRASILEIRA DE NORMAS TÉCNICAS.
Concreto auto adensável Parte 2: Determinação do espalhamento e do tempo de escoamento – Método do cone de Abrams: NBR15823-2, 2010.
[08] ASSOCIAÇÃO BRASILEIRA DE NORMAS TÉCNICAS. Concreto auto adensável – Parte 4: Determinação da habilidade passante – Método da caixa –L: NBR15823-4, 2010.
[09] ASSOCIAÇÃO BRASILEIRA DE NORMAS TÉCNICAS. Concreto auto adensável – Parte 5: Determinação da viscosidade – Método do funil –V: NBR15823-5. 2009. [10] ASSOCIAÇÃO BRASILEIRA DE NORMAS TÉCNICAS.
Ensaio de compressão de corpos de prova de concreto cilíndricos – Método de Ensaio: NBR 5739. Rio de Janeiro, 1994.
[11] ASSOCIAÇÃO BRASILEIRA DE NORMAS TÉCNICAS. Argamassa e concreto – Determinação da resistência à tração por compressão diametral de corpos de prova cilíndricos: NBR 7222. Rio de Janeiro, 1994. [12] ASSOCIAÇÃO BRASILEIRA DE NORMAS TÉCNICAS.
Concreto – Determinação do módulo estático de elasticidade à compressão: NBR 8522. Rio de Janeiro, 2008.
[13] ASSOCIAÇÃO BRASILEIRA DE NORMAS TÉCNICAS. Determinação da luência – Método de Ensaio: NBR 8224. Rio de Janeiro, 1983.
[14] Marques et al. Procedimentos de Ensaio de Fluência para Corpos-de-Prova de Concreto com Extensômetro Elétrico de Deformação. In: 50º CONGRESSO BRASILEIRO DO CONCRETO, Salvador, 200, CD-ROM. [15] Rüsch, H.; Junqwirth, D.; Hilsdorf, H. K. Creep and
shrinkage: theirs effect on the behavior of concrete structures. New York: Springer-Verlag, 284p., 1983. [16] Bažant, Z.P., Baweja, S., Creep and shrinkage
prediction model for analysis and design of concrete structures (Model B3), In: AlManasseer, A., (Ed.), Creep and Shrinkage of Concrete, ACI Special Publication, (extended and improved version of BAŽANT and BAWEJA, 1995), 2000.
[17] ASSOCIAÇÃO BRASILEIRA DE NORMAS TÉCNICAS. Projeto de estruturas de concreto – Procedimento: NBR 6118. Rio de Janeiro, 2003.
[18] EC2 - Eurocódigo 2. Projeto de estruturas de betão - parte 1: Regras gerais e regras para edifícios, 2004. [19] AMERICAN CONCRETE INSTITUTE. ACI 209R-92.
Prediction of creep, shrinkage, and temperature effects in concrete structures. ACI 1992.
[20] Gardner, N.J., Lockman, M.J. Design provisions for drying shrinkage and creep of normal-strength concrete, ACI Materials Journal, 98(2), p.159-167, 2001. [21] GARDNER, N.J., Comparison of predictions for
drying shrinkage and creep of normal-strength concrete. Can. J. Civ. Eng. 31, p. 767-775, 2004. [22] Kalintzis, C. A. A. Estudo da luência do concreto de
elevado desempenho. – EPUSP – Escola Politécnica de São Paulo - Dissertação de mestrado - São Paulo, 2000. [23] Takeuti, A. R. Comportamento resistente imediato e
ao longo do tempo de pilares reforçados por meio de