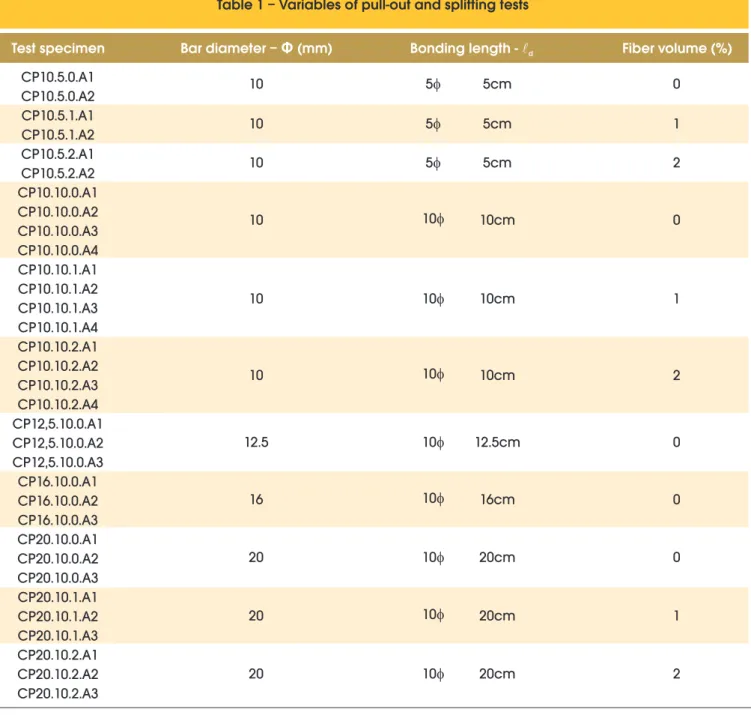
Bonding between steel bars and concrete makes the two materials compatible, enabling the use of reinforced concrete as a construction material. If the bond is good, there will be less cracks, and the reinforcing bar will be better protected by the surrounded concrete. The aim of this research was to analyze the inluence of steel ibers on concrete-steel bond strength. Therefore, pull-out tests were performed with thirty-three prismatic specimens measuring 200 mm x 300 mm x 150 mm. The variables analyzed were: bar diameter (10 mm, 12.5 mm, 16 mm and 20 mm); bond length (ive and ten times the diameter); and the volume of steel ibers added to the concrete (1% and 2%). Short, steel, hooked ibers were used, 35 mm in length and with aspect ratio of 65. Based on the pull-out tests assays, the form and force of the rupture was determined in each speci-men, Computational simulations of the specimens were also performed with bars of 100 mm in diameter. Both the results of the experimental tests and the modeling showed that the addition of ibers had little effect on the bond strength between the bar and the concrete. On the other hand, when the bond rupture occurred by splitting of the concrete cover, the inluence of the steel ibers was signiicant.
Keywords: reinforced concrete, steel ibers, bond.
A aderência entre a barra de aço e o concreto permite que haja a compatibilização entre os dois materiais, validando o uso do concreto armado como material de construção. Quanto melhor a aderência, menores são as aberturas das issuras e mais protegida ica a armadura. Assim, busca-se nessa pesquisa investigar a inluência das ibras de aço na aderência aço-concreto. Para tanto, foram ensaiados trinta e três corpos de prova, com dimensões de 200 mm x 300 mm x 150 mm, dos quais foi arrancada uma barra de aço neles concretada. As variáveis analisadas foram o diâmetro da barra (10 mm, 12,5 mm, 16 mm e 20 mm), o comprimento aderente (cinco e dez vezes o diâmetro da barra) e o volume de ibras de aço adicionadas ao concreto (1% e 2%). Foram utilizadas ibras de aço com ganchos nas extremidades, comprimento de 35 mm e rela -ção de aspecto igual a 65. Dos ensaios de arrancamento foi determinada a forma e a força de ruptura em cada um dos modelos. Adicionalmente, foram feitas simulações computacionais dos ensaios realizados com barra de 10 mm de diâmetro. Tanto os resultados dos ensaios experimentais quanto da modelagem mostraram que as ibras estudadas exercem pequena inluência na tensão de aderência entre a barra e o concreto. Por outro lado, quando a ruptura da aderência se dá pelo fendilhamento do cobrimento de concreto, a inluência das ibras é signiicativa.
Palavras-chave: concreto armado, ibras de aço, aderência.
Inluence of steel ibers on the reinforcement bond
of straight steel bars
Inluência da adição de ibras de aço na tensão
de aderência de barras de aço retilíneas
D. L. ARAÚJO a [email protected]
A. R. DANIN b [email protected]
M. B. MELO c [email protected]
P. F. RODRIGUES d [email protected]
a Professor Doutor, Programa de Pós-Graduação em Geotecnia, Estruturas e Construção Civil, Escola de Engenharia Civil, Universidade Federal de Goiás, Praça Universitária, s/n, Setor Universitário, 74605-220, Goiânia, GO. E-mail: [email protected];
b Mestre, Escola de Engenharia Civil, Universidade Federal de Goiás, [email protected]; c Mestre, Instituto Federal de Educação, Ciência e Tecnologia de Goiás, [email protected]; d Engenheiro Civil, Gerente de P&D, Furnas Centrais Elétricas S. A., [email protected]. Received: 06 Fev 2012 • Accepted: 19 Fev 2013 • Available Online: 05 Apr 2013
Abstract
1. Introduction
The bond between steel bars and the adjacent concrete allows both materials to be compatible, enabling the use of reinforced concrete as a construction material. If the bond is good, there will be fewer cracks, and the reinforcing bar will be better protected by the surrounded concrete.
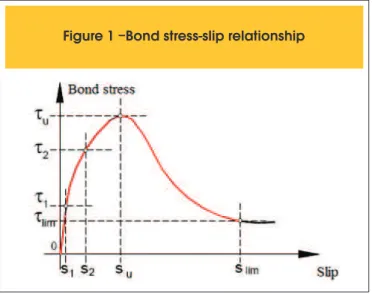
Adherence is usually subdivided in three parts: adhesion, friction and mechanical. This subdivision is based on the bond stress-slip relationship, as shown in Figure 1. In this igure, s1, s2 and su rep-resent the slip relative to the bond stress due to adhesion (τ1), to friction (τ2), and to mechanical anchorage (τu), respectively. Adhesion bonding, also called chemical adhesion, corresponds to the initial part (rather inclined) of the curve and consists of the resistance to the shear stress between the concrete and steel par-ticles. It occurs due to the physic-chemical connections between the bar and the cement paste formed during the bonding. In com-parison with the other parts of the bonding, adhesion is rather small, being destructed as soon as the irst slip between steel and concrete occurs.
Friction bonding occurs when a material tends to slip in relation to another one. However, it depends on the friction coeficient of the steel-concrete interface and on the surface roughness of the steel bar. The mechanical bonding is represented by the last upward slop-ing part of the curve shown in Figure 1. This part is due to the ex -istence of irregularities at the bar’s surface that function as support points. This means that the more irregular the bar’s surface struc-ture, the higher the mechanical bonding, since a so-called ‘wedging effect’ will take place [1]. The part related to mechanical bonding is the main reason for the anchoring of ribbed steel bars in concrete, providing a certain post-peak resistance, and varying in function of the inclination, height and the distance between the ribs.
There are two main forms of bonding failure: pull-out and splitting. Failure by pull-out of the steel bar occurs when the shear stress at the steel-concrete interface is higher than the bonding strength. In this case, the bar slides without there being failure by splitting of the adjacent concrete. This normally occurs for small bonding lengths together with an external coninement pressure, provided, for example, by a high cover/bar diameter ratio (c/φ).
On the other hand, when the concrete cover is small or there are no coninement stresses on the anchorage part, failure of the con -crete by splitting may occur, due to radial tensile stresses coming from the bar’s ribs. This failure is brittle and usually occurs without notice. The factors that most inluence the resistance to splitting are the rib’s geometry, the concrete’s strength, the concrete’s con-inement stress and the relation between the concrete’s cover and the bar’s diameter [2].
For high values of the adhering length and suficient concrete cov -er, the shear stress at the steel-concrete interface is smaller than the bonding strength and the steel bar can break without being pulled out from the concrete. In case the pull-out of the bar occurs at the moment it reaches its yield stress, this bond length is called basic anchorage length.
In literature, there exist several tests that allow determining the bond stress-slip relationship. These tests can be basically subdi-vided in bar pull-out tests [3-10], beam bending tests [6, 11-13], and direct traction tests on rods (or concentric pull-out test) [14]. This last test consists of concreting two bars at the extremities of a concrete prism, one of those being pulled-out due to its shorter anchorage length. Traditionally, the bonding stress is determined by means of the standard pull-out test, due to the easy executing process of this test. However, it only provides the average bond-ing stress along the anchorage length. Next to this, in this test the concrete is conined at the prism’s support base, thus allowing it neither to split nor to expand. Another negative aspect of this test is the dificulty to guarantee the bar’s position during the concreting of the test specimen, which requires a precise manufacturing pro-cess of the test specimens such as to guarantee the bar’s linearity. Fibers can be added to the concrete to improve its post-crack be -havior, since these act as bridges to transfer stresses between cracks, controlling the opening of the crack or its propagation [15]. In this sense, lots of research treats the inluence of the steel ibers on the steel-concrete bonding [8, 9, 16-18]. They commonly con-clude that the steel ibers improve the bonding of the concrete with the reinforcement, when this is corrugated, inhibiting splitting in the forces transfer region between the reinforcement and the concrete. However, some researchers observe that the ibers contribute in a positive way only in concrete with a higher strength (65 MPa) and bars with higher diameter (20 mm), and that in some cases, they can also lead to a reduction of up to 30% in bonding strength [8, 19]. From the point of view of computer modeling of reinforced concrete structures, various simple constitutive models to represent the lo-cal bond stress-slip relationship of reinforcement bars immersed in concrete are available in literature and are already included in proj-ect codes [20]. These codes, however, do not consider the pres-ence of the steel ibers and their inlupres-ence on the bond stress-slip relationship. In this case, constitutive models reported in literature can be used [21].
2. Experimental program
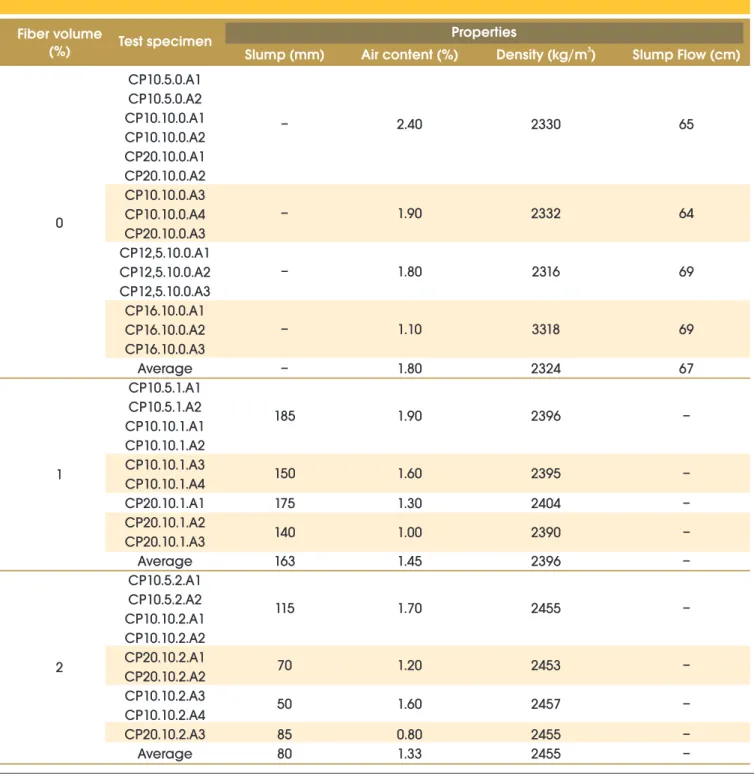
the slump low test by the Abrams cone method, conform to stan -dard ABNT NBR 15823-2:2010 [25]. The results of these tests are shown in Table 2.
In the center of each test specimen a steel bar was cast, whose di-ameter varied between 10 mm, 12.5 mm, 16 mm, and 20 mm. The average yield stress of these bars, previously determined following standard ABNT NBR ISO 6892:2002 [26], was 592 MPa, 572 MPa, 616 MPa, and 505 MPa, respectively.
The tests with bars with diameter above 10 mm were called split-ting tests, realized in order to evaluate the inluence of the ibers when the bonding failure happened through splitting of the con-crete cover. The relationship between the concon-crete cover of the reinforcement and its diameter (c/φ) varied during the tests be-coarse aggregate that was used had maximum dimensions of 12.5
mm such as to guarantee that it would represent approximately one-third of the length of the steel ibers, which had hooks at the extremities, aspect ratio equal to 65 and length of 35 mm.
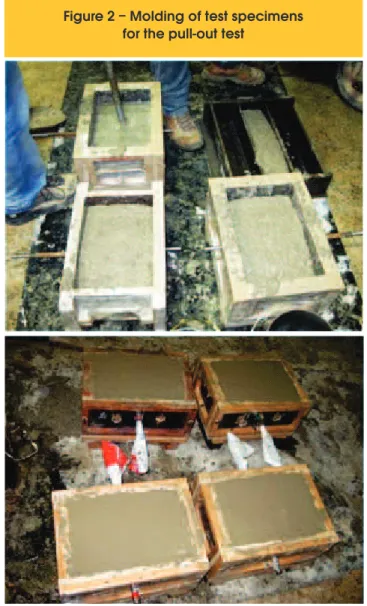
The prismatic test specimens were cast in horizontal position and the concrete was consolidated with an immersion vibrator such as to avoid the preferential alignment of the ibers in a speciic plane (Figure 2). The fresh concrete was characterized for work -ability by a slump test, following standard ABNT NBR NM67:1998 [22], for air content in the mixture conform to standard ABNT NBR NM47:2002 [23], and for density in accordance with standard ABNT NBR 9833:2008 [24]. The concrete without ibers were self-compacting, and for this reason its properties were determined by
Table 1 – Variables of pull-out and splitting tests
Test specimen
Bar diameter –
Φ
(mm)
Bonding length -
dFiber volume (%)
CP10.5.0.A1
CP10.5.0.A2
CP10.5.1.A1
CP10.5.1.A2
CP10.5.2.A1
CP10.5.2.A2
CP10.10.0.A1
CP10.10.0.A2
CP10.10.0.A3
CP10.10.0.A4
CP10.10.1.A1
CP10.10.1.A2
CP10.10.1.A3
CP10.10.1.A4
CP10.10.2.A1
CP10.10.2.A2
CP10.10.2.A3
CP10.10.2.A4
CP12,5.10.0.A1
CP12,5.10.0.A2
CP12,5.10.0.A3
CP16.10.0.A1
CP16.10.0.A2
CP16.10.0.A3
CP20.10.0.A1
CP20.10.0.A2
CP20.10.0.A3
CP20.10.1.A1
CP20.10.1.A2
CP20.10.1.A3
CP20.10.2.A1
CP20.10.2.A2
CP20.10.2.A3
10
10
10
10
10
10
12.5
16
20
20
20
0
1
2
0
1
2
0
0
0
1
2
5cm
5cm
5cm
10cm
10cm
10cm
12.5cm
16cm
20cm
20cm
20cm
5
5
5
10
10
10
10
10
10
10
ed. These plates had dimensions of 7.5 cm x 7.5 cm for the test specimens with bars of 20 mm diameter, and 10 cm x 10 cm for the test specimens with bars of 10 mm diameter.
The area without bonding of the bars was created by enfolding it with a plastic tube, its length varying in function of the bonding length of the bar in the concrete (Figure 4 and Table 1). In order to follow the deformation of the bar, a strain gage was glued on the bar outside the concrete.
The concrete used in the research was characterized for its av-erage compressive strength (fcm), following standard ABNT NBR 5739:2007 [28], modulus of elasticity (Ecm), following standard ABNT NBR 8522:2008 [29, 30] and average splitting tensile strength (fctm,sp), or Brazilian Test, following standard ABNT NBR 7222:2010 [31]. All these parameters were obtained with tests on cylindrical test specimens with dimensions of 150 mm x 300 mm. Next to these, the three-point bending test, notched at mid-span, in order to determine the fracture energy of the concrete (Gf) was carried out conform to the test scheme recommended in [32]. All these parameters were used in the computer modeling of the bar pull-out tests.
3. Results and discussion
3.1 Bonding stress
Table 3 shows the results of the mechanical properties of the con-crete, as well as the results of the pull-out tests, carried out on test specimens with bars of 10 mm diameter. In this table, an increase in compressive strength of up to 25% can be observed, when 1% of steel ibers was added (78.5 kg/m3), conirming other authors who say that the addition of up to 120 kg/m3 to the concrete increases with ap-proximately 25% the concrete’s compressive strength [33]. However, with the addition of 2% of steel ibers (or 157 kg/m3), a lower increase of the compressive strength is observed, reaching a maximum of 19%. On the other hand, it is observed that the incorporation of steel ibers caused a signiicant increase in splitting tensile strength of up to 80% for 1% ibers and 123% for 2% ibers. Yet, the modulus of elastic -ity of concrete was little inluenced by the addition of the steel ibers. In the same way, the Poisson coeficient also was not inluenced by the addition of the steel ibers, presenting an average value of 0.20. In all the pull-out tests with bonding length equal to 5φ, failure oc-curred due to the loss of bonding between the bar and the con-crete. The failure occurred due to the pull-out of the bar without the splitting of the concrete cover and with the bar still in linear elastic behavior. With the addition of 1% of steel ibers, the aver -age bonding stress showed a small increase of 9%, going from 20.53 MPa to 22.28 MPa. Although the increase in iber volume improved the mechanical properties of the concrete, especially the splitting tensile strength, this improvement did not relect itself in the increase of the average bonding stress between steel and con-crete, calculated with Equation (1), once that with 2% of ibers the average bonding stress remained almost the same as for the test specimens without ibers (20.18 MPa).
(1)
d
max
b
F
f
tween 7.0, 5.5, 4.2, and 3.25 respectively for the bar of 10 mm, 12.5 mm, 16 mm, and 20 mm. The other variables were the bond-ing length of the bar in the concrete (ive and ten times the diam -eter of the bar) and the added volume of steel ibers (1% and 2%, which corresponds to a consummation of ibers of 78.5 kg/m3 and 157.0 kg/m3, respectively). The bonding length of 5φ was used in order to determine the bonding stress of the bar, in line with what is recommended in the literature [3], while the bonding length of 10φ was used to conirm the basic anchorage length of the bar. The pull-out tests were realized with displacement control in a uni-versal test machine with load capacity of 300 kN. The test scheme is shown in Figure 3. The load was applied perpendicularly to the cast, since the specimens were cast in a horizontal position. In order to allow ixing the test specimen to the test machine, two bars of 25 mm were used (at 75 mm from the tested bar), attached to a metallic device conform to the test adaptation shown in the literature [27]. For the passage of the bars through the test speci -men, two holes with 25 mm diameter (for test specimens with a 10 mm bar) or 32 mm diameter (for the others) were made. These bars were screwed in steel plates on which the test specimen
Here, fb is the average bonding stress, Fmax the pull-out load, ld the bonding length, and φ the diameter of the steel bar.
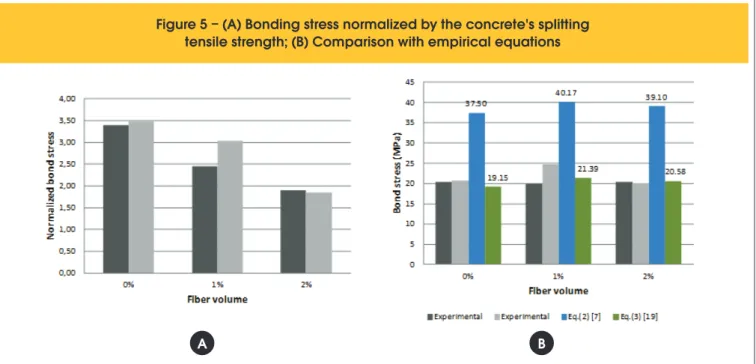
This same conclusion can be reached when comparing the normalized bonding stress, obtained by the relation between the bonding stress and splitting tensile strength of the concrete (Figure 5). In this case, a reduction of up to 45% in the normal -ized bonding stress is noted with the addition of 2% of steel ibers, showing that the bonding stress is not inluenced by the increase
of the tensile strength of the concrete provided by these ibers. A possible justiication of this is the short length of the bonding por -tion of the bar (50 mm) as compared to the length of the ibers (35 mm), which does not allow the mobilization of the iber before the pull-out of the bar.
The same behavior was observed by other researchers [8], who found that the addition of 0.75% (60 kg/m3) of steel ibers with 35 mm length and aspect ratio equal to 64 increased by maximum
Table 2 – Properties of fresh concrete
Fiber volume
(%)
Test specimen
Slump (mm)
Air content (%)
Density (kg/m )
3Slump Flow (cm)
Properties
0
1
2
CP10.5.0.A1
CP10.5.0.A2
CP10.10.0.A1
CP10.10.0.A2
CP20.10.0.A1
CP20.10.0.A2
CP10.10.0.A3
CP10.10.0.A4
CP20.10.0.A3
CP12,5.10.0.A1
CP12,5.10.0.A2
CP12,5.10.0.A3
CP16.10.0.A1
CP16.10.0.A2
CP16.10.0.A3
Average
CP10.5.1.A1
CP10.5.1.A2
CP10.10.1.A1
CP10.10.1.A2
CP10.10.1.A3
CP10.10.1.A4
CP20.10.1.A1
CP20.10.1.A2
CP20.10.1.A3
Average
CP10.5.2.A1
CP10.5.2.A2
CP10.10.2.A1
CP10.10.2.A2
CP20.10.2.A1
CP20.10.2.A2
CP10.10.2.A3
CP10.10.2.A4
CP20.10.2.A3
Average
–
–
–
–
–
185
150
175
140
163
115
70
50
85
80
2.40
1.90
1.80
1.10
1.80
1.90
1.60
1.30
1.00
1.45
1.70
1.20
1.60
0.80
1.33
2330
2332
2316
3318
2324
2396
2395
2404
2390
2396
2455
2453
2457
2455
2455
65
64
69
69
67
–
–
–
–
–
–
–
–
16% the bonding stress between bar and concrete. In this case, the results were obtained by pull-out tests conform to literature [3], on bars of 8 mm and 20 mm of diameter embedded in concrete with compressive strength of up to 93 MPa. Despite this result, in general these researchers noted a reduction of up to 45% in nor -malized bonding stress due to the addition of steel ibers.
In Figure 5, the average bonding stress between bar and concrete
Figure 3 – Pull-out test setup (dimensions in mm)
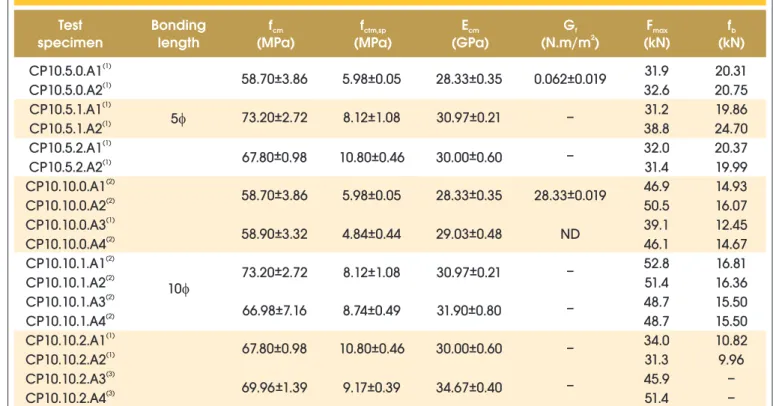
Table 3 – Results of concrete properties and pull-out test
Test
specimen
F
max(kN)
f
b(kN)
Bonding
length
f
cm(MPa)
f
ctm,sp(MPa)
E
cm(GPa)
G
f 2(N.m/m )
(1)CP10.5.0.A1
(1)CP10.5.0.A2
(1)CP10.5.1.A1
(1)CP10.5.1.A2
(1)CP10.5.2.A1
(1)CP10.5.2.A2
(2)CP10.10.0.A1
(2)CP10.10.0.A2
(1)CP10.10.0.A3
(2)CP10.10.0.A4
(2)CP10.10.1.A1
(2)CP10.10.1.A2
(2)CP10.10.1.A3
(2)CP10.10.1.A4
(1)CP10.10.2.A1
(1)CP10.10.2.A2
(3)CP10.10.2.A3
(3)CP10.10.2.A4
31.9
32.6
31.2
38.8
32.0
31.4
46.9
50.5
39.1
46.1
52.8
51.4
48.7
48.7
34.0
31.3
45.9
51.4
20.31
20.75
19.86
24.70
20.37
19.99
14.93
16.07
12.45
14.67
16.81
16.36
15.50
15.50
10.82
9.96
–
–
5
10
58.70±3.86
73.20±2.72
±
67.80 0.98
±
58.70 3.86
58.90±3.32
±
73.20 2.72
66.98±7.16
67.80±0.98
±
69.96 1.39
5.98±0.05
8.12±1.08
10.80±0.46
5.98±0.05
4.84±0.44
8.12±1.08
8.74±0.49
10.80±0.46
9.17±0.39
28.33±0.35
30.97±0.21
±
30.00 0.60
±
28.33 0.35
±
29.03 0.48
±
30.97 0.21
±
31.90 0.80
30.00±0.60
34.67±0.40
0.062±0.019
–
–
±
28.33 0.019
ND
–
–
–
–
ND: non-determined value. (1) The pull-out of the bar happened before the yield of the steel; (2) the pull-out of the bar happened after the yield stress of the steel, but before its failure; (3) the failure happened in the bar, without it being pulled out.
obtained from the tests is also compared to the recommended bonding stress in references [8] and [21] for concretes reinforced with steel ibers. Equations (2) and (3) show the expressions to calculate the recommended bonding stress from these two refer-ences, respectively:
(2)
62
,
25
c
f
c
f
)
RIA
50
(
22
,3
f
0
4,
0
4,
cube
,0
70
,0
37
cube
2
b
(3)
5
,
0
cm
b
2
,
5
f
f
Here, fb is the average bonding stress, in MPa; fcm is the compres-sive strength of the concrete obtained from cylindrical test speci-mens, in MPa; fcube is the compressive strength of the concrete obtained from prismatic test specimens (assumed to be equal to fcm/0.8); RIA is the relation between the height of the ribs (hr=0.64 mm) and the distance between the ribs (sr=6.1 mm) of the steel bar; φ is the diameter of the steel bar (10 mm); and c is the con-crete cover (70 mm).
When comparing the values obtained with Equation 2 with the ex-perimental values, it is noted that this expression overestimates the bonding stress by 85% on average. On the other hand, the values obtained with Equation 3 differ from the experimental val-ues by only 3% on average. This shows that this last expression is adequate for the evaluation of the bonding stress of bars immersed in concrete, with and without steel ibers.
3.2 Basic anchorage length
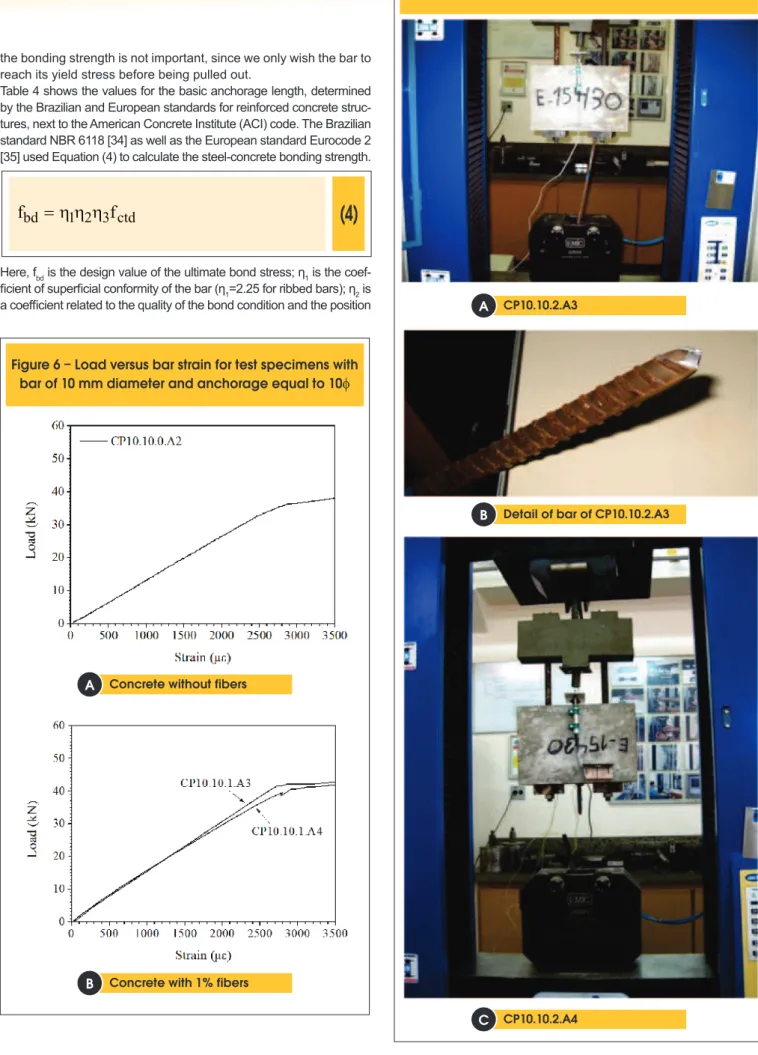
Table 3 shows the results of pull-out tests of the bars with 10 mm diameter and bonding length equal to 10 cm, i.e. ten times the bar
diameter (10φ). For the large majority, the bars were pulled out of the concrete after reaching the steel’s yield stress (Figure 6), inde -pendent of the presence of steel ibers. Due to the high concrete cover around the bar (c/φ=7), in none of the tests splitting of the concrete cover was observed.
Although in these tests the bar as pulled out after the steel’s yield limit, the average bonding stress between bar and concrete was still calculated. This is justiied by the fact that from these tests one wishes to obtain the basic anchorage length, deined as the straight length of a reinforcement bar necessary to anchor the yield load Asfy in this bar, assuming a uniform bonding strength along this length [34]. Furthermore, other researchers conirm that the bonding stress obtained from the pull-out test without yielding of the reinforcement gives bonding strength values well above the normative values [8]. From the test specimens with ibers, it was noted that the addition of 1% ibers increased the average bonding strength at the mo -ment of pull-out of the bar with only 10%, while the addition of 2% of ibers increased this same bonding strength with only 7%. For the test specimens with 2% of ibers, those that were pulled out be -fore the yield of the steel (CP10.10.2.A1 and CP10.10.2.A2) were disregarded. The small increase that was observed can be related to the residual resisting capacity of the steel after having reached its yield strength, i.e. the increase is due to the higher strength than yield stress of the steel at the maximum load applied in the pull out test. Furthermore, the closeness of the values suggests that the volume of added ibers did not have any inluence on the average bonding strength.
Taking into account that in the majority of the tests, the bare reached the yield stress before being pulled out, it can be concluded that the bonding length of 10φ was higher than the reinforcement’s basic anchorage length, independent of the ibers’ presence and volume. It should be emphasized that in two test specimen with 2% ibers (CP10.10.2.A3 and CP10.10.2.A4), the bars were not pulled out from the concrete block, as failure occurred in the part without bonding (Figure 7). This suggests that the steel ibers might have improved the bonding strength of these test specimens enough to cause failure of the steel bar. However, this residual increase of
Figure 5 – (A) Bonding stress normalized by the concrete's splitting
tensile strength; (B) Comparison with empirical equations
the bonding strength is not important, since we only wish the bar to reach its yield stress before being pulled out.
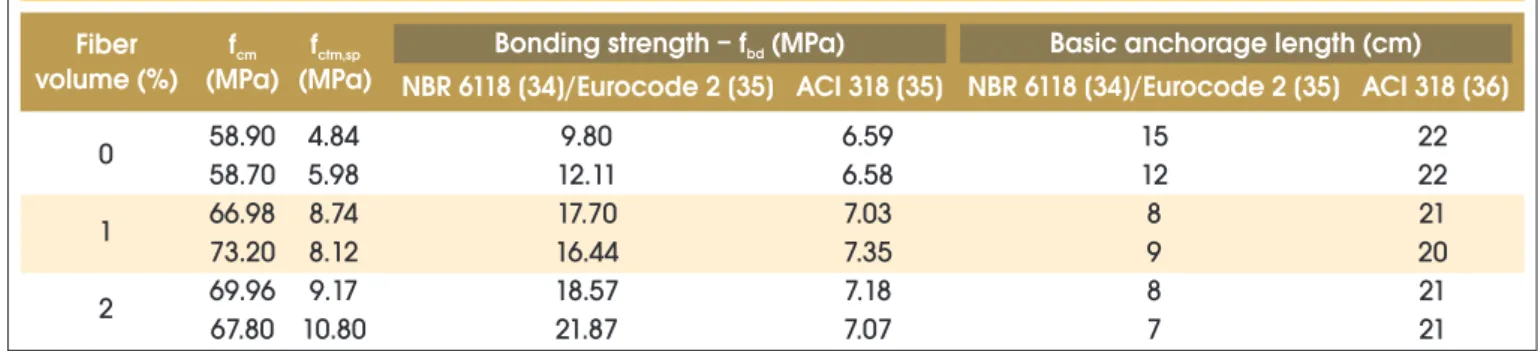
Table 4 shows the values for the basic anchorage length, determined by the Brazilian and European standards for reinforced concrete struc-tures, next to the American Concrete Institute (ACI) code. The Brazilian standard NBR 6118 [34] as well as the European standard Eurocode 2 [35] used Equation (4) to calculate the steel-concrete bonding strength.
(4)
ctd
3
2
1
bd
f
f
Here, fbd is the design value of the ultimate bond stress; η1 is the coef-icient of supericial conformity of the bar (η1=2.25 for ribbed bars); η2 is a coeficient related to the quality of the bond condition and the position
Figure 6 – Load versus bar strain for test specimens with
bar of 10 mm diameter and anchorage equal to 10
Concrete without fibers
A
Concrete with 1% fibers
B
Figure 7 – Bar failure
CP10.10.2.A3
A
Detail of bar of CP10.10.2.A3
B
CP10.10.2.A4
of the bar during concreting (η2=1 for regions with good condition); and η3 is related to the bar diameter (η3=1 for φ < 32 mm). For reasons of comparison, the design value of the concrete tensile strength (fctd) was taken equal to 90% of the concrete’s splitting tensile strength (fctm,sp). The basic anchorage length (lb) is calculated following Equation (5). In this case, for the steel’s yield stress (fy), the experimentally obtained values were used.
(5)
bd
y
b
4
f
f
In line with item 12.2.3 of ACI 318M-08 [36], the anchorage length of straight bars tensioned longitudinally must be calculated follow-ing Equation (6).
(6)
tr
s
e
t
cm
y
b
1
,
1
f
f
c
K
Using Equation (5), the design value of the ultimate bond stress fol-lowing ACI 318M-08 [36] can be estimated by means of Equation (7).
(7)
s
e
t
tr
cm
bd
4
K
c
f
1
,1
f
Here, λ is the coeficient that takes into consideration the con -crete’s density (λ=1.0 for normal density concrete); Ktr is the coeficient that takes into account the coninement of the concrete (Ktr=1.0 in the absence of stirrups); the relation
trK
c
should not be higher than 2.5; ψt=1.0 when less than
300 mm of fresh concrete is launched under the anchoring part; ψe=1.0 when the reinforcement is not coated; ψs=0.8 for bars with 10 mm diam-eter. For the case of the realized tests, Equation (7) can be simpliied into Equation (8).
(8)
cm
cm
bd
,1
1
4
f
0
,
8
2
,
5
0
,
859
f
f
Upon comparing the results of Table 4, one notes that ACI 318M-08 is more conservative, proposing higher anchorage lengths than those stipulated by the Brazilian and European standards. These, on the other hand, present anchorage lengths close to the value used in the test, i.e. 10 cm (or 10φ). Furthermore, the bonding strength recommended by NBR 6118 and by Eurocode 2 happens to be close to the bonding stress obtained in the test, with a difference of 25% less for the concrete without fibers and of only 6% more for the concrete with 1% fibers. This way, it can be deduced that the value of 10 cm (or 10φ) represents the straight basic anchorage length of the tested bar and the expressions in these standards can be used in order to evaluate the basic anchorage length of bars immersed in fibrous concrete, as soon as the tensile strength of the composite is known.
Special attention should be paid to the densification of the fibrous concrete around the bar in order to avoid loss of bonding stress. This happened in the bars of test specimens CP10.10.2.A1 and CP10.10.2.A2, both with 2% fibers, which did not reach the steel’s yield stress. This shows that the bond-ing between the steel bar and the concrete in this case might have been impaired, maybe because of problems during mold-ing, such as the formation of a water film at the interface be-tween bar and concrete, caused by excessive vibration. In the other two test specimens in which the fibrous concrete has less workability (Table 2), the bars failed without being pulled out of the concrete.
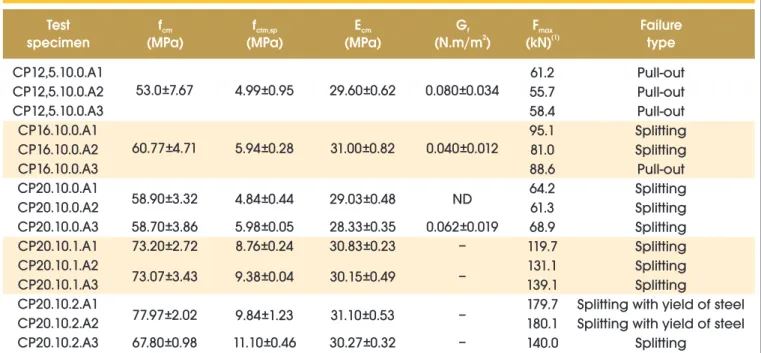
3.3 Concrete splitting tests
The results of the concrete splitting tests, i.e. with bars with diameters higher than 10 mm, as well as the concrete’s me-chanical properties are shown in Table 5. In these tests, the bonding length was kept constant and equal to 10φ, since the anchorage’s failure due to splitting of the concrete was sought, instead of the determination of the bonding stress between bar and concrete.
Analyzing the influence of the concrete cover, it is noted that in the tests with bars of 12.5 mm diameter (c/φ=5.5), all the test specimens showed bond failure between bar and concrete, since the bar was pulled out without any splitting of the con-crete. In the tests with bars of 16 mm diameter (c/φ=4.2), two test specimens showed splitting failure of the concrete cover (Figure 8), and in one of these, the bar was pulled out without splitting of the concrete cover.
Since the previous test was not conclusive with regard to split-ting failure of the concrete cover, the reinforcement’s diameter was increased by 20 mm, which represents a relation between the concrete cover and the reinforcement’s diameter (c/φ) equal to 3.25. In Table 5, it can be seen that due to the
reduc-Table 4 – Basic anchorage length for bars of 10 mm diameter
Fiber
volume (%)
NBR 6118 [34]/Eurocode 2 [35]
ACI 318 [35]
NBR 6118 [34]/Eurocode 2 [35]
ACI 318 [36]
Bonding strength – f (MPa)
bdBasic anchorage length (cm)
f
cm(MPa)
(MPa)
f
ctm,sption of the concrete cover, in all the tests splitting of the con-crete was observed. For this reason, this diameter was used to analyze the influence of the fibers on the concrete’s splitting strength.
It is worth noting that with the bar of 20 mm diameter, the bond-ing length was 20 cm, and equal to the test specimen’s length. As such, there was no part without bonding of the bar with the concrete. Previous test results with this same test specimen and bar of 20 mm diameter, but with bonding length equal to 10 cm (or 5φ), showed a bonding stress that was much higher than the real values. This happened due to the test speci-men’s way of molding, which introduced additional resisting mechanism next to the bonding between bar and concrete [37]. For this reason, it was opted to maintain the test specimen’s height, even without the non-bonding part.
From the test results, it can be concluded that the addition of 1% steel fibers propitiated an average increase of 100% in the maximum load, while the addition of 2% increased this maximum load by 157%. When an analysis of variance is carried out on these results (with a 95% confidence inter -val), it can be concluded that the addition of fibers as well as its volume significantly influenced the concrete’s splitting strength.
This increase in the splitting strength of the concrete cover is related to the increase in the concrete’s splitting tensile strength. Starting from theory of elasticity [38], it is possible to write Equation (9), giving us the maximum circumferen-tial stress (σθ,max) in a circular section with radius b, with a circular hole with radius a, to which is applied an internal pressure pi, distributed along the internal hole. In this case,
the maximum stress occurs on the side of the internal hole.
(9)
2
2
2
2
i
max
,
P
b
a
a
b
When in this expression the test specimen’s dimensions are sub-stituted, i.e. a=10 mm (half of the bar’s diameter), and b=75 mm (shortest distance from the bar’s surface to the test specimen’s surface, being the cover), the result is σθ,max=1.036pi. The radial pressure acting on the internal hole can be related to the bar’s bonding stress (fb) starting from the knowledge of the inclination of the bar’s ribs (β), i.e. pi=fb/tg β. Assuming that the bar has the lowest rib inclination allowed for high-bonding bars, i.e. β=45° [1], pi=fb is reached. For the test specimen without ibers, the bonding stress can be calculated by means of Equation (1) and is equal to 5.1 MPa, from which it can be concluded that the maximum circum -ferential stress in this model is equal to 5.3 MPa. This value is only 2% lower than the average splitting tensile strength of the concrete used for the test specimens, i.e. 5.41 MPa (Table 5). This indicates a good correlation between the load measured during the test and the concrete’s tensile strength.
In the case of the models with steel ibers, the maximum circumfer -ential stress is 10.7 MPa for the test specimen with 1% ibers and 13.8 MPa for the test specimen with 2% ibers. These values are 18% and 32% higher than the average splitting tensile strength of the concrete (Table 5). However, the ibrous concretes showed a strength increase after the matrix’s cracking, which justiies this dif -ference, since Equation (9) is valid for fragile materials.
Table 5 – Results of concrete properties and splitting test
Test
specimen
f
cm(MPa)
f
ctm,sp(MPa)
E
cm(MPa)
G
f 2(N.m/m )
F
max (1)(kN)
Failure
type
CP12,5.10.0.A1
CP12,5.10.0.A2
CP12,5.10.0.A3
CP16.10.0.A1
CP16.10.0.A2
CP16.10.0.A3
CP20.10.0.A1
CP20.10.0.A2
CP20.10.0.A3
CP20.10.1.A1
CP20.10.1.A2
CP20.10.1.A3
CP20.10.2.A1
CP20.10.2.A2
CP20.10.2.A3
53.0±7.67
60.77±4.71
58.90±3.32
58.70±3.86
73.20±2.72
73.07±3.43
77.97±2.02
67.80±0.98
4.99±0.95
5.94±0.28
4.84±0.44
5.98±0.05
8.76±0.24
9.38±0.04
9.84±1.23
11.10±0.46
29.60±0.62
31.00±0.82
29.03±0.48
28.33±0.35
30.83±0.23
30.15±0.49
31.10±0.53
30.27±0.32
0.080±0.034
0.040±0.012
ND
0.062±0.019
–
–
–
–
61.2
55.7
58.4
95.1
81.0
88.6
64.2
61.3
68.9
119.7
131.1
139.1
179.7
180.1
140.0
Pull-out
Pull-out
Pull-out
Splitting
Splitting
Pull-out
Splitting
Splitting
Splitting
Splitting
Splitting
Splitting
Splitting with yield of steel
Splitting with yield of steel
Splitting
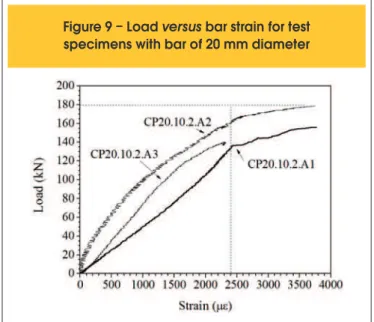
Next to propitiating an increase in splitting strength of the concrete cover, the incorporation of ibers also inluenced the failure type, which was less brittle than in concrete without ibers (Figure 8). Furthermore, the addition of 2% ibers allowed the bar to reach the steel’s yield stress before the splitting failure of the concrete cover, as was registered by the strain gage glued to the external part of the bar (Figure 9). This shows the positive effect of the steel ibers in the concrete’s coninement in the anchorage bars region.
3.4 Computer modeling
The computer modeling of the pull-out tests was executed with the DIANA® 9.3 software, based on the inite element method
[39]. In order to represent the concrete and the steel bar, iso-parametric solid inite elements of type CHX60 were used, and to represent the interface between the steel bar and the con-crete, the interface inite element of type CQ48I was used, both available in the software’s library. It should be emphasized that in this modeling the possibility of slip between bar and concrete was not considered, i.e. the perfect adhesion between both ma-terials was assumed.
In a preliminary stage, the models were processed without the representation of the ribs on the bars. In this study, it was veri-fied that the physical representation of the bar’s ribs exerted any influence on the results [37]. This way, all the computer models presented here consider the presence of the ribs on the bars.
Figure 10 shows the inite elements mesh that was used in the modeling of the pull-out test for the bar of 10 mm diameter. The choice for only modeling this bar diameter came from the fact that it was wanted to numerically evaluate the bonding stress distribu-tion between the bar and the concrete when the bar is pulled out from the concrete without splitting. The size of the inite elements mesh was deined in function of the ribs’ dimensions and in func -tion of the minimum volume for the tridimensional inite element allowed in the DIANA® 9.3 software. In this same igure is also
shown the boundary conditions scheme of the computer model, which was restricted along the full length of its base.
Figure 8 – Failure by splitting of the concrete cover
Bar of 16 mm diameter and concrete without fibers
Bar of 20 mm diameter and concrete without fibers
Bar of 20 mm diameter and concrete with 2% fibers
A
B
C
In order to represent the tensile behavior of the concrete with i -bers, the Hordijk constitutive model was used, which is available in the DIANA® 9.3 software, and which uses an exponential curve to
represent the concrete’s softening. In this case, the fracture energy of the ibrous concrete (GF
f) was calculated using Equation (10), available in literature [40].
(10)
f
f
0
f
F
V
41
,
27
1
G
G
Here, G0
f is the fracture energy for the concrete without added i -bers and Vf is the ibers volume, in percentage.
For the concrete without ibers, a constitutive tensile model with linear softening was used, where the value of fracture energy was
determined in a three-point bend tests on notched beams (G0 f). In order to represent the steel’s behavior, a constitutive model with perfect elasto-plastic behavior was used, with the yield stress equal to the experimentally determined values.
Table 6 shows the maximum strengths obtained in the test and from the computer model. In general, the maximum strength ob-tained from the computer model represented approximately 70% of the maximum strength obtained in the test. This is due to the fact that in the model there was intense cracking of the concrete in the region close to the bar, which resulted in lack of convergence of the numerical process. Despite this, it can be noted that in the model with bonding length equal to 5φ, the ibers showed a small inluence on the bonding strength, with a 12% increase when com -paring the model with 1% ibers with the model without ibers, and a 14% increase when comparing the model with 2% ibers with the model with 1% ibers. On the other hand, upon analyzing the
Figure 10 – Finite element mesh of models with bar of 10 mm diameter
Model with bonding length equal to 10
(10 cm)A
Boundary conditions in displacementin z-direction – concrete block base
B
Table 6 – Results of computer models with bar of 10 mm diameter
Bonding
length
volume (%)
Fiber
(1)
f
b,n(MPa)
(2)
f
bm(MPa)
Average maximum
experimental strength
F (kN)
expMaximum
numerical strength
F (kN)
u5
10
0
1
2
0
1
2
13.8
15.4
17.4
9.6
9.8
9.9
18.7
20.9
23.8
9.6
9.9
10.3
32.2
35.0
31.7
45.6
50.4
48.6
23.0
25.7
29.3
30.9
31.5
33.0
0.71
0.73
0.92
0.68
0.63
0.68
(1) f is the average bonding stress, corresponding to the maximum numerical strength, determined by means of Equation b,n (12); (2) f is the bonding stress, corresponding to the maximum numerical strength, determined by means of the CQ48I bm interface element between bar and concrete.
F
expmodel with bonding length equal to 10φ, it can be noted that the ibers do not inluence the bonding strength.
Figure 11 shows the tensile stresses distribution along the bar at the moment the numerical maximum strength was reached. The crosshatched part represents the bonding region between steel and concrete. The bonding stress between bar and concrete can be determined by means of the equilibrium of the reinforced con-crete element illustrated in Figure 12. For a steel bar with diameter φ, we have:
(11)
A
d
A
dx
d
c
c
s
s
If we neglect the contribution of the tensioned concrete and sub-stitute the steel area by the value of the circular section, we get:
(12)
4
dx
d
s
Starting from Equation (12) and from the proiles shown in Figure 11, the average numerical bonding stress (fb,n), shown in Table 6, was determined. As well as the maximum numerical strength, this bond-ing stress represented approximately 70% of the average bondbond-ing stress determined in the tests. In this igure, it can be seen that the stresses distribution for the model with bonding length equal to 5φ presents a decay that is approximately linear, which proves that the
Figure 11 – Tensile stress distribution in the bars of 10 mm diameter
Model without fibers, bonding length equal to 10
- stresses inModel without fibers, bonding length equal to 5
– stresses in MPaA
B
bonding stress in this case can be considered constant. In the model with bonding length equal to 10φ, there is an accentuated loss of stress in the bar from the beginning of the bonding part and then an approximately linear decay in the remainder of the bonding part. This shows the change in the bonding stress distribution when the anchorage length is higher than the basic anchorage length. The same behavior can be observed in Figure 13, which shows the prin -cipal tensile stresses for both models at the moment of maximum numerical strength. A higher concentration of the tensile stress at the beginning of the bonding part can be noted for the model with bond-ing length equal to 10φ, while in the model with bonding length equal to 5φ, the principal tensile stress was distributed along the bonding part. This proves that the bonding length equal to 10φ was in fact higher than the bar’s basic anchorage length.
Table 6 also shows the shear stress measured in the interface ele-ment between the bar and the concrete for the maximum numerical strength (fbm). This stress was, on average, 36% higher than the aver -age numerical strength (fb,n) of the model with bonding length equal to 5φ. This shows that in fact, in the tests where the bar is pulled out, in localized regions of the bar, the bonding stress can reach values high-er than its avhigh-erage bonding stress. In the models with bonding length equal to 10φ, the bonding stress at the interface (fbm) was almost equal to the average numerical bonding stress (fb,n), which means there is a lower stress concentration at the interface with the bar when the bond-ing length is higher than the basic anchorage length.
4. Conclusions
This article treated the inluence of steel ibers on the bonding stress between straight steel bars and concrete, as well as the inluence of these same ibers on the splitting strength of the con -crete cover. The main conclusions obtained are:
n From the test with specimens with a 10 mm bar and length
equal to 5 cm (5φ), it can be concluded that the ibers do not inluence the bonding stress between the steel bar and the con
-crete. Upon analysis of the normalized bonding stress, obtained through the relation between the bonding stress and the split-ting tensile strength of the concrete, it can be concluded that it was reduced by up to 45% due to the addition of the steel ibers.
n One of the objectives of this article was to evaluate the minimum anchorage length of the bars when they are embedded in the ibrous concrete, for which were executed the tests with bond -ing length equal to 10φ. From these tests, it can be concluded that an anchorage length of only 10φ was suficient to improve the bar’s anchorage, taking into account that they reached the steel’s yield stress before being pulled out. Due to the higher bonding length, in this test the steel ibers showed a positive inluence, taking into account that with 2% ibers the bars fail without being pulled out from the concrete.
n In general, the expressions used to evaluate the basic anchor-age length of the steel bars that are present in the Brazilian and European standards for reinforced concrete structures, proved to be useful to determine the anchorage length of the bars em-bedded in the ibrous concrete, if in these expressions the ten -sile strength of the ibrous concrete is used.
n The ibers had signiicant inluence on the increase of the split -ting strength of the concrete cover. With the addition of 2% i -bers, the bar of 20 mm diameter and concrete cover equal to 3.25φ managed to reach the yield stress of the steel before the failure by splitting. This represented an increase of 157% in the splitting strength of the concrete when compared to the same bar embedded in concrete without ibers.
n The average bonding stress determined by means of the com-puter model was approximately 30% lower than the average bonding stress determined in the test, due to the excessive cracking of the concrete at the interface with the bar. However, the modeling of the bars with bonding length equal to 5 cm (5φ) indicated a positive inluence of the steel ibers on the bond -ing stress between the steel bar and the concrete. This shows that the ibers can improve the steel-concrete bonding if a good
Figure 13 – Principal tensile stress in the concrete
2
Bonding length equal to 5
– stresses in N/m 2Bonding length equal to 10
– stresses in N/m (representation of bonding part only)connection between bar and concrete can be guaranteed at the interface region between both materials.
n The tensile stress distributions in the bar, obtained from the computer modeling, showed that the bonding stress at the mo-ment of bonding failure is in fact constant along the bonding length. Furthermore, they indicated that the anchorage length equal to 10φ was in fact higher than the basic anchorage length for the concrete used in this research.
5. Acknowledgements
The authors wish to thank the company Furnas Centrais Elétricas S.A. for the inancing of this research and for making available its laboratories for executing the tests. They also wish to thank the companies Mc-Bauchemie and Arcelor Mittal for the donation of material used in the research.
6. References
[01] FUSCO, P.B. Técnicas de armar as estruturas de concreto. 1a Ed. São Paulo: PINI, 1995.
[02] HARAJLI, M. H. Numerical bond analysis using experimental derived local bond laws: a powerful method for evaluating the bond strength of steel bars. Journal of Structural Engineering, v.133, n.5,
p.695-705, 2007.
[03] RILEM-FIP-CEB. Bond test for reinforcing steel: 1-Beam test (7-II-28 D). 2-Pullout test (7-II-128): Tentative recommendations. RILEM Journal Materials and Structures, v.6, n.32, p.96-105, 1973.
[04] REHM, G. AND ELIGEHAUSEN, R. Bond of Ribbed Bars under High Cycle Repeated Loads. ACI Journal, v.76, n. 2, p.297-309, 1979.
[05] ROSTÁSY, F. S.; HARTWICH, K. Bond deformed reinforcing bar embedded in steel ibre reinforced concrete. The International Journal of Cement and Lightweight Concrete, v.10, n.3, 1988.
[06] ALMEIDA FILHO, F. M.; EL DEBS, M. K.; EL DEBS, A. L. H. C.. Bond-slip behavior of self-compacting c oncrete and vibrated concrete using pull-out and beam tests. Materials and Structures, V. 41, n. 6,
p. 1073-1089, 2008.
[07] ALMEIDA FILHO, F. M.; EL DEBS, M. K.; EL DEBS, A. L. H. C.. Evaluation of the bond strength behavior between steel bars and High Strength Fiber
Reinforced Self-Compacting Concrete at early ages. In: Tailor Made Concrete Structures. Walraven and Stoelhorst (eds). 2008. Taylor & Francis Group, London. p. 445-451.
[08] DANCYGIER, A. N.; KATZ, A.; WEXLER, U.. Bond between deformed reinforcement and normal and high-strength concrete with and without ibers. Materials and Structures, v.43, n. 6, p. 839-856, 2010.
[09] DANCYGIER, A. N.; KATZ, A.. Bond over direct support of deformed rebars in normal and high strength concrete with and without ibers. Materials and Structures, V. 45, n. 1-2 , p. 265-275, 2012. [10] LORRAIN, M. ; BARBOSA, M. P. ; SILVA FILHO,
L.C.P. . Estimation of compressive strength based on
Pull-Out bond test results for on-site concrete quality control. IBRACON Structures and Materials Journal, v. 4, n. 4, p. 582-591, 2011.
[11] DE LARRARD, F.; SCHALLER, I.; FUCHS, J.. Effect of the Bar Diameter on the Bond Strength of Passive Reinforcement in High-Performance Concrete. ACI Materials Journal, V. 90, n.4, p. 333-339, 1993. [12] HAMZA, A. M.; NAAMAN, A. E.. Bond Characteristics
of Deformed Reinforcing Steel Bars Embedded in SIFCON. ACI Materials Journal, V. 93, n. 6, p. 1-11, 1996. [13] DESNERCK, P.; DE SCHUTTER, G.; TAERWE,
L.. Bond behaviour of reinforcing bars in self-compacting concrete: experimental determination by using beam tests. Materials and Structures, V. 43, Supplement 1, p. 53-62, 2010.
[14] EZELDIN, A. S.; BALAGURU, P. N.. Bond behavior of normal and high-strength iber reinforced concrete. ACI Materials Journal, V. 86, n. 5, p. 515-524, 1989. [15] BENTUR, A.; MINDESS, S. Fibre reinforced cementitious
composites. Elsevier Applied Science, London, 1990. [16] HARAJLI, M. H.; SHALLOUKH, K. A. Effects of ibers
on developments / splice strength of reinforcing bars in tension. ACI Materials Journal, v.94, n.4, p.317-324, 1997.
[17] HARAJLI, M. H.; HAMAD, B.; KARAM, K. Bond-slip response of reinforcing bars embedded in plain and iber concrete. Journal of Materials in Civil Engineering, v.14, n.6, p.503-511, 2002.
[18] HARAJLI, M. H.; GHARZEDDINE, O. Effect of steel ibers on bond performance of steel bars in NSC and HSC under load reversals. Journal of Materials in Civil Engineering, v.19, n.10, p.864-873, 2007.
[19] DANCYGIER, A. N.; KATZ, A. The Combined Effect of Concrete Strength and Geometric parameters on Concrete-Reinforcement Bond. In: 8th
INTERNATIONAL SYMPOSIUM ON UTILIZATION OF HIGH-STRENGTH AND HIGH-PERFORMANCE CONCRETE. S1-1-3, Tokyo, Japan, p.357-362, 2008. [20] CEB – COMITÉ EURO-INTERNATIONAL DU BETÓN.
CEB-FIP MODEL CODE 1990. Design Code, Thomas Telford, London, 1998.
[21] HARAJLI, M. H.; HOUT, M. A.; JALKH, W. Local bond stress-slip behavior of reinforced bars embedded in plain and iber concrete. ACI Materials Journal, v.92, n.4, p.343-353, 1995.
[22] ABNT – ASSOCIAÇÃO BRASILEIRA DE NORMAS TÉCNICAS. NBR NM 67: Concreto – Determinação da consistência pelo abatimento do tronco de cone, Rio de Janeiro, 1998.
[23] ABNT – ASSOCIAÇÃO BRASILEIRA DE NORMAS TÉCNICAS. NBR NM 47: Concreto – Determinação do teor de ar em concreto fresco – Método pressométrico, Rio de Janeiro, 2002.
[24] ABNT – ASSOCIAÇÃO BRASILEIRA DE NORMAS TÉCNICAS. NBR 9833: Concreto fresco - Determinação da Density, do rendimento e do teor de ar pelo método gravimétrico, Rio de Janeiro, 2008.
- Parte 2: Determinação do espalhamento e do tempo de escoamento - Método do cone de Abrams, Rio de Janeiro, 2010.
[26] ABNT – ASSOCIAÇÃO BRASILEIRA DE NORMAS TÉCNICAS. NBR ISO 6892: Materiais metálicos - Ensaio de tração à temperatura ambiente, Rio de Janeiro, 2002.
[27] AL-TAMIMI, A. Fibre-reinforced connections in precast concrete lat slabs. Thesis (Doctor of Philosophy). School of Civil Engineering, University of Nottingham, Nottingham, UK, 2001.
[28] ABNT – ASSOCIAÇÃO BRASILEIRA DE NORMAS TÉCNICAS. NBR 5739: Concreto - Ensaios de compressão de corpos-de-prova cilíndricos, Rio de Janeiro, 2007.
[29] ABNT – ASSOCIAÇÃO BRASILEIRA DE NORMAS TÉCNICAS. NBR 8522: Concreto - Determinação do módulo estático de elasticidade à compressão, Rio de Janeiro, 2008.
[30] FURNAS CENTRAIS ELÉTRICAS S. A.,
N° 01.008.001: Determinação do Módulo de Elasticidade e Coeiciente de Poisson, Aparecida de Goiânia, 2003, 9 p. [31] ABNT – ASSOCIAÇÃO BRASILEIRA DE NORMAS
TÉCNICAS. NBR 7222: Concreto e argamassa — Determinação da resistência à tração por compressão diametral de corpos de prova cilíndricos, Rio de Janeiro, 2010.
[32] RILEM TC-50 FMC. Determination of the fracture energy of mortar and concrete by means of three-point bend tests on notched beams. Materials and
Structures, v.18, n.106, p. 285-290, 1985. [33] BALAGURU, P. N.; SHAH, S. P. Fiber reinforced
cement composites. McGraw-Hill, International Editions, New York, 1992, 530p.
[34] ASSOCIAÇÃO BRASILEIRA DE NORMAS TÉCNICAS. NBR 6118: Projeto de Estruturas de Concreto – Procedimento. Rio de Janeiro, 2007.
[35] COMITÉ EUROPÉEN DE NORMALISATION. Eurocode 2: Design of concrete structures. European Prestandard, Brussels, Belgium, 2004.
[36] AMERICAN CONCRETE INSTITUTE. ACI 318M-08: Building Code Requirements for Structural Concrete. Farmington Hills, 2008.
[37] DANIN, A.R.. Estudo da aderência entre concreto e armadura: Análise da inluência das ibras de aço. 277 f. 2010. Dissertação (mestrado em Engenharia Civil). Programa de Pós-Graduação em Geotecnia e Construção Civil, Universidade Federal de Goiás, Goiânia, 2010.
[38] TIMOSHENKO, S. P.; GOODIER, J. N.. Theory of Elasticity. 3rd Edition. McGraw-Hill, 1970.
[39] TNO Building and Construction Research. DIANA User’s Manual: Release 9.3. Delft, Netherlands, 2008. [40] ARAÚJO, D. L. Cisalhamento entre viga e laje