The use of column capitals is one way to increase the punching strength of slab-column connections. Recommendations presented by codes
of practice for deining the geometry and checking the resistance of slab-column connections with capitals are not comprehensive, with few experimental studies available on the topic. This paper discusses important aspects of the historical development of mushroom slabs and also presents experimental results of 4 tests, with 1 test in a reference lat slab and 3 tests in mushroom slabs with circular column capitals. These
results are compared with theoretical results estimated using Eurocode 2 (2004) and NBR 6118 (2007). They were also compared with a series
of non-linear inite element analysis in order to get insight of the stress distribution and of the failure mechanism of mushroom slabs.
Keywords: mushroom slab, punching shear, reinforced concrete, column capitals.
O uso de capitéis é uma das formas de se aumentar a resistência à punção de ligações laje-pilar. As recomendações normativas para a deinição da geometria e veriicação da resistência última de ligações com capitéis são pouco abrangentes, sendo poucas as pesquisas ex
-perimentais disponíveis sobre o tema. Este artigo discute aspectos relevantes do desenvolvimento histórico das lajes cogumelo e apresenta
resultados de 4 ensaios experimentais, sendo 1 laje lisa de referência e 3 lajes cogumelo com capitéis de seção circular. Estes resultados são
comparados com as estimativas das normas EUROCODE 2 (2004) e NBR 6118 (2007) e com modelos numéricos não-lineares a im de se
compreender melhor a distribuição das tensões e o mecanismo de ruptura de lajes cogumelo.
Palavras-chave: lajes cogumelo, punção, concreto armado, capitel.
Experimental and numerical analysis of reinforced
concrete mushroom slabs
Análise experimental e numérica de lajes cogumelo
de concreto armado
A. F. LIMA NETO a [email protected]
M. P. FERREIRA b [email protected]
D. R. C. OLIVEIRA c [email protected]
G. S. S. A. MELO d [email protected]
a Professor, Faculdade de Engenharia Civil, Universidade Federal do Pará, Campus de Tucurui, [email protected], Tucurui, Pará, Brasil. b Professor, Faculdade de Engenharia Civil, Universidade Federal do Pará, [email protected], Belém, Pará, Brasil.
c Professor, Faculdade de Engenharia Civil, Universidade Federal do Pará, [email protected], Belém, Pará, Brasil.
d Professor, Departamento de Engenharia Civil e Ambiental, Universidade de Brasília, [email protected], Brasília, Distrito Federal, Brasil.
Abstract
1. Introduction
Flat slabs are distinguished from conventional beam-and-slab loors
because they are supported directly on columns. This structural sys-tem is easier to be constructed because forms and reinforcement are simple, which may generate economic gains due to reductions
in the construction time. The main disadvantage of this structural
system is the possibility of punching shear, which is a brittle local failure that may spread and lead the whole structure to ruin through
progressive collapse. To improve the ductility and to increase the
bearing capacity of a slab-column connection it is common the use
of shear reinforcements like stud rails, bent-up bars or double-head
-ed studs. Another alternative is to increase the effective depth of
the slab by using column capitals or drop panels, what reduces the shear stresses in slab-column connections. These elements may
also increase its ductility as the punching strength approaches the
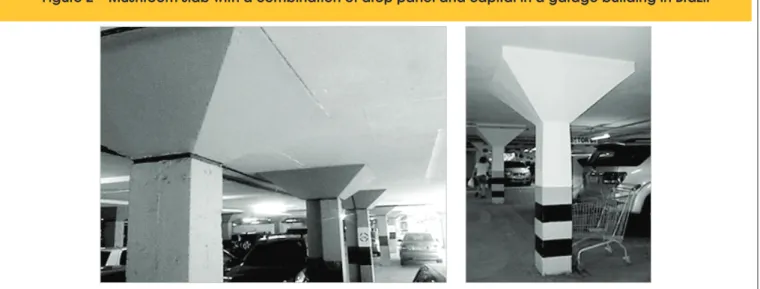
lexural resistance of the slab. Figure 1 shows some possibilities for
slab-column connections and Figure 2 presents a mushroom slab used in a garage building in Brazil.
1.1 Historic
Flat slabs were developed probably independently in the early XX century by different engineers. In the U.S.A. C. A. P. Turner was responsible for demonstrating the eficiency and reliability of the
system (Gasparini [1]). In Europe Robert Maillart, a Swiss engineer
more famous for his works with bridges, is believed to be the inven
-tor of lat slabs (Furst and Marti [2]),but credits are also given to
Arthur F. Loleit, a Russian engineer (Kierdorf [3]).
At that time one of the biggest challenges was to determinate the
stresses in loors with slabs supported directly on columns, without
Figure1 – Systems slabs without beams
Flat slab
Mushroom slab (drop panel)
A
C
Mushroom slab (column capitals)
Mushroom slab (drop panel + capital)
B
plexity. Also, the quality of predicted results didn’t justiied its use
instead of the simpler empirical methods presented by codes of
practice. Yet this method is still one of the most signiicant contribu
-tions ever made to the subject.
1.2 Research signiicance
Many experimental researches have been developed, mostly fo
-cused at evaluating the contribution of different types of shear rein
-forcement in the punching resistance of lat slabs. Few experimen
-tal results are available about the contribution of column capi-tals
or drop panels (Wey [8] and Hueste at al. [9]) and those available are more focused in evaluating the ductility of slab-column con
-nections in case of earthquakes (cyclic loading). Design recom -mendations presented by codes of practice for mushroom slabs
are supericial and strongly inluenced by tests on footings. Thus, it is evident the importance of providing experimental results on the behavior and strength of mushroom slabs.
1.3 Methodology
This paper presents the results of four experimental tests, one of
a lat slab tested as reference and three tests in mushroom slabs
with circular column capitals. Experimental results are compared
with theoretical values obtained using recommendations of NBR 6118 [10], EUROCODE 2 [11] and of the Critical Shear Crack
Theory as presented by Muttoni [12]. Results of a computational
analysis using nonlinear FEA commercial software MIDAS are also presented in order to better understand the behavior and failure
mechanism of mushroom slabs.
2. Theoretical methods for estimation
of punching resistance
2.1 NBR 6118 (2007)
NBR 6118 [10] recommends that the punching resistance of
mushroom slabs must be checked in three regions of the slab-any beams. It was common to observe signiicant variations in the
lexural reinforcement ratio between different patented systems. According to Melo [4], in 1911 the irst structural accident was reg
-istered in a building with lat slabs. It was the collapse of Prest-o-Lite building in the U.S.A., where a local punching failure led the whole building to ruin, evidencing the need for research on the behavior and resistance of slab-column connections.
The irst experimental study that provided information for the de -sign of slab-column connections was performed by Talbot [5],
which in fact tested concrete footings and observed that in many
cases they failed by punching forming a truncated failure cone with
faces tilted around 45 degrees(inluenced by the high thickness of the footings). He also noticed at that time that the lexural rein
-forcement ratio could signiicantly inluence the ultimate punching strength, which was later observed by Richart [6].
Only in 1960 it was presented the irst theoretical model to explain
the punching failure mechanism and predict the ultimate strength of slab-column connections. This model was presented by Kinnunen
and Nylander [7] and was based on experimental observations ob
-tained after conducting an extensive experimental program. The authors observed that the portion of the slab outside the failure
surface showed rigid body rotations and created a model aiming
to satisfy the forces equilibrium (see Figure 3a). In this model, the
slab segments are treated as rigid bodies supposedly supported
on a conical imaginary shell conined between the column and the shear crack.
Under load, each segment rotates around a point of rotation (CR)
and is supported by the forces shown in Figure 3b, with the internal forces being a function of rotation (ψ) of the slab. According to the authors failure occurs when a point in the bottom surface of the
slab, located vertically below the root of the shear crack reaches a
critical radial strain (εcto) at the same time that the tangential strains in concrete and in the imaginary conical shell reach characteristic
ultimate strain for concrete. This model was initially developed for the case of axisymmetric reinforcement, but as in practice lexural
reinforcement are arranged orthogonally, Kinnunen and Nylander [7] presented changes to the model. The method was always
con-sidered dificult to use in practice, due to its high level of com
strength of the compression strut around the column, using the control perimeter u0. It should also be checked the diagonal column connection. The maximum resistance of the
connec-tion should be checked using Equaconnec-tion 1 which evaluates the
B
A
tensile strength of concrete in the area inside and outside the column capital, in control perimeters u1 and uout, using Equa
-tions 2 and 3, with the effective depth of the slab in each case
considered as shown in Figure 4.
(1)
max
0,27
1 0R v c H
V
f u d
Where:
(
)
1
1
250
v
f
cα
= −
, with fc in MPa; u0 is the column perimeter in mm;dH is the effective depth of the slab in the ends of the column in mm
(see Figure 4).
(2)
,in
1/3 1 t
0,18 1 200
100
c c a
R
V
d
f
u d
Where:
ρ is the geometric lexural reinforcement ratio expressed by x y
ρ= ρ ρ⋅ ;
ρx and ρy are the lexural reinforcement ratios in orthogonal direc -tions x and y;
fcis the compressive strength of concrete in MPa (fc ≤ 50 MPa); u1 is the length of a control perimeter taken 2·d from the column faces, in mm. For slabs without column capitals it is calculated as
(
C
d
)
u
1=
π
⋅
+
4
⋅
and for slabs with column capitals it is calcu-lated asu
1=
ð
⋅
[
C
+
4
⋅
(
d
+
h
H)
]
;da is the effective depth as shown in Figure 4 in mm.
(3)
d
f
u
d
V
R,c,ext
,0
18
1
200
100
c 13
out
Where:
d is the effective depth of the slab in mm;
uoutis the length of a control perimeter taken 2·d from the ends of capital and calculated as
u
out=
ð
⋅
(
C
+
2
⋅
l
h+
4
.d
)
;lHis the distance between the edge of the capital and the column face, in mm.
In cases where lH ≤ 2·(dH – d), designers have to check only the resistance in the control perimeter uout. When 2·(dH – d) < lH ≤ 2·dH,
resistance should be checked only in the control perimeter u1. If lH > 2·dH it is necessary to check the resistance in both uoutand u1.
Figure 4 – Control perimeters recommended by NBR 6118 [10]
Mushroom slab
BB
Flat slab
A
Figure 5 – Control perimeters recommended by EUROCODE 2 [11]
Mushroom slab
BB
Flat slab
2.2 Eurocode 2
EUROCODE 2 [11] assumes that the punching strength of lat slabs with column capitals or drop panels must be checked in three control perimeters as shown in Figure 5. This means that it must be checked
the maximum shear strength of the slab-column connection, using
Equation 4, and that the tensile diagonal strength inside and outside the capital or drop panel should be checked using Equations 5 and 6.
(4)
0,3
1
250
c 0R max c
f
V
f
u d
Where:
fc is the compressive strength of (fc ≤ 90 MPa); u0 is the column perimeter in mm;
d is the effective depth of the slab, in mm.
(5)
H c
H
f
u
d
V
3
1�
int
Rc,
0
,
18
100
Where:
ξH is the size effect, taken as
ξ
H=
1
+
200
(
d
+
h
H)
≤
2
,
0
for afailure surface inside the column capital, with d and hH in mm;
ρ is the geometric lexural reinforcement ratio expressed by
, where ρx and ρy are the lexural reinforce -ment ratios in orthogonal directions x and y, considering only bars within a region away 3∙d from the faces of the column;
u1 is the length of a control perimeter taken 2·d from the column faces, in mm;
dH is the effective depth of the slab in the ends of the column faces, in mm; hH is the thickness of the capital, in mm.
(6)
d
u
f
V
Rc,ext
0,18
3100
c
out�
Where:
uout is the length of a control perimeter taken 2·d from the ends of capital, in mm.
2.3 Critical shear crack theory (CSCT)
Muttoni [12] idealized his theory based on the idea that the punch-ing resistance decreases with increaspunch-ing rotation of the slab.
Such behavior may be attributed to formation of a critical shear crack that propagates along the slab thickness cutting the com -pression strut, which transmits shear forces to the column (see
Figure 6). With increasing load the shear crack trends to open, reducing the eficiency of the shear transfer mechanisms and eventually leading to a punching shear failure. According Muttoni and Schwartz [13] the opening of this crack is proportional to the
product ψ·d (see Figure 6), but the transmission of shear forces
along the critical crack depend on the roughness of the concrete failure surface. The inluence of the roughness of concrete sur -face can be assessed in terms of the maximum aggregate size used in concrete. Based on these concepts Muttoni [12] proposed that the punching strength of a slab failing by diagonal tensile can
be obtained using Equation 7.
(7)
و
int
0
2
3 1 20
H
c
Rk,c,
H
g
g
u d
f
V
d
d
d
Where:u1 is the length of a control perimeter taken d/2 from the column faces, in mm;
dH is the effective depth of the slab in the ends of the column faces,
in mm;
fc is the compressive strength of concrete, in MPa; ψ is the slab rotation;
dg0 is a reference diameter of the aggregate admitted as 16mm;
dg is the maximum diameter of the aggregate used in the concrete slab, in mm.
The rotation ψof the slab is expressed by Equation 8.
(8)
ىﻮ
1,5
s ys Es flex
f
r
V
d E
V
Where:
rs is the distance between the axis of the column and the line of
contra lexure of moments;
rq is the distance between the axis of the column and the load line;
rc is the radius of the circular column or the equivalent radius of a
rectangular column;
fys is the yield stress of the tensile lexural reinforcement;
Es is the modulus of elasticity of the tensile lexural reinforcement;
VE is the applied force;
2
s flex R q cr
V
m
r
r
π
= ⋅ ⋅ ⋅
−
; 21
2
ys R ys cf
m
f
d
f
ρ
ρ
⋅
= ⋅ ⋅ ⋅ −
⋅
.It is also necessary to check the strength for the case of a failure
occurring in the outside of the column capitals, calculated using
Equation 9.
(9)
g g ck out Rk,c,extd
d
d
f
d
u
V
020
1
3
2
Where:uout is the length of a control perimeter taken d/2 from the ends of the capital, in mm;
d is the effective depth of the slab, in mm.
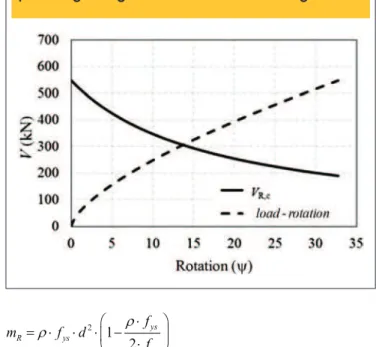
With VE, ψ and VR,c is possible to draw a graph with two curves.
The first is a curve that expresses the theoretical load-rota
-tion behavior of the slab. The second curve expresses the
strength reduction of the slab due to the increase of
rota-tion. The point of intersection of these two curves express
the punching strength of a slab-column connection. Figure 10 illustrates this graph.
Figure 7 – Graphic representation of the
punching strength determination according to CSCT
Table 1 – Experimental variation of the slabs
Slab
l (mm)
Hd (mm)
ρ
(%)
Ratio
h :l
H Hh (mm)
Hf (MPa)
cC (mm)
LC1
LC2
LC3
LC4
-1:2
1:3
1:4
-110
165
220
250
55
-
111,5
1,04
112,5
1,03
110,5
1,05
3. Experimental program
A series of four experimental tests was carried in the civil engineer
-ing laboratory of Federal University of Para in order to evaluate the
behavior and strength of reinforced concrete lat slabs with col
-umn capitals (mushroom slabs). One was a reference lat slab and
the other three slabs had circular column capitals. The slabs were
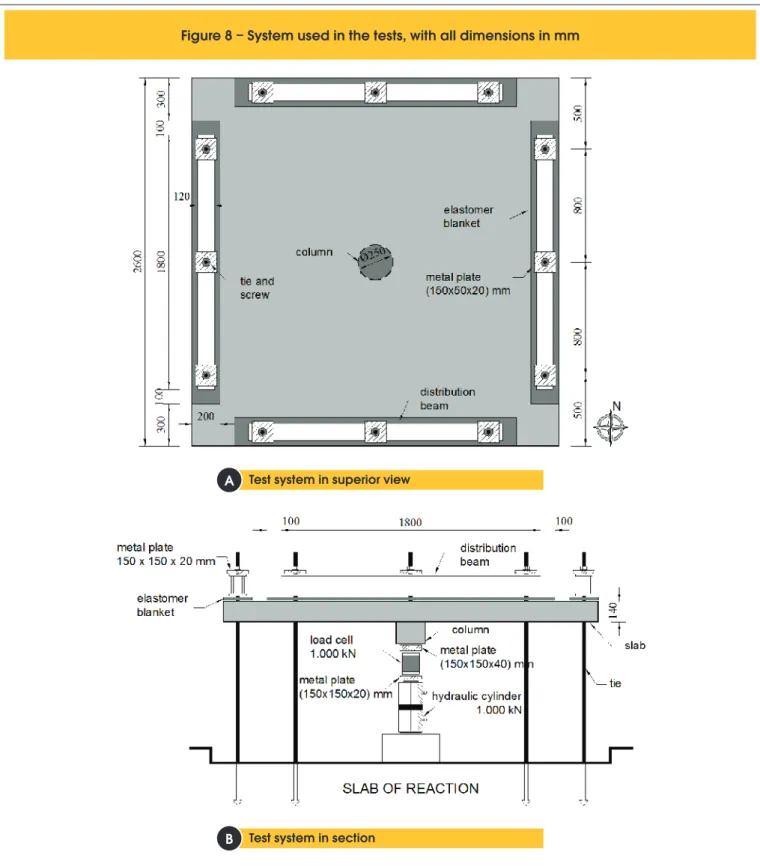
square with sides of 2,600 mm and were 140 mm thick supported
on circular central column stubs with diameter of 250 mm. The
Figure 8 – System used in the tests, with all dimensions in mm
Test system in superior view
Test system in section
A
lexural reinforcement used was the same for all the slabs being
formed by 12.5 mm bars spaced at each 105 mm in x direction and 12.5 mm bars spaced at each 115 mm in the y direction. The
con-crete cover was 15 mm in the upper face and 10 mm the bottom of the slabs. This series of tests has as main variable the slope of the
column capitals, adopting relations between hH:lHof 1:2, 1:3 and
1:4, in order to assess their inluence on the behavior and strength
of slabs. Table 1 shows the characteristics of the tested slabs. The slabs were subjected to symmetrical loading as shown in Figure 8.
Compressive strains in the concrete surface were measured us -ing strain gauges placed in the region around the slab-column connection. The gauges were positioned in tangential and radial directions, as shown in Figure 9, in which it is possible to notice
that the gauges position varied according to the geometry (slope)
of the capitals. The monitoring of strains was more intense in the edges of the capitals which are critical areas in terms of stress concentration.
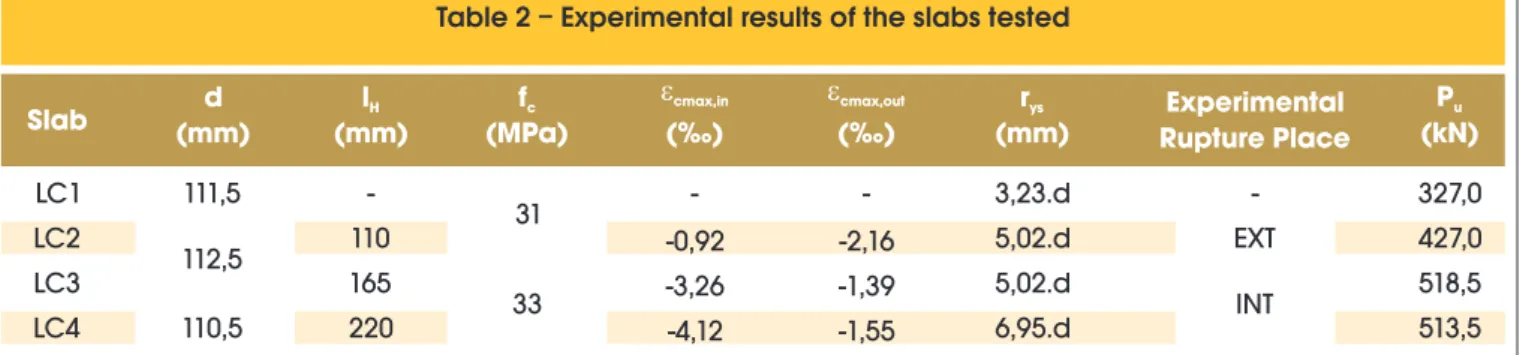
Table 2 shows test results where it is possible to observe a varia -tion in the failure load of slabs up to 58.5% (LC1 to LC3). This
variation can be attributed to the addition and the subsequent in -crease in capitals, once the slab LC1 has capital and the slabs
LC2, LC3 and LC4 had their capitals added and varying its thick -ness/length ratio of 1:2 to 1:4. Tests showed an increase of 30% of the failure load of slab LC1 to LC2, which had the smaller column
capital, with 1:2 ratio, as recommended by the EUROCODE 2 [11]
and NBR 6118 [10].In the case of slab LC3, which had a ratio of 1:3
Figure
9 – Strain gages fixed in the bottom surface of slabs
Table 2 – Experimental results of the slabs tested
Slab
(mm)
d
l
H
(mm)
(MPa)
f
c
cmax,in(‰)
cmax,out(‰)
(mm)
r
ys
Rupture Place
Experimental
(kN)
P
u
LC1
111,5
-
31
-
-
3,23.d
-
327,0
LC2
112,5
110
-0,92
-2,16
5,02.d
EXT
427,0
LC3
165
33
-3,26
-1,39
5,02.d
INT
518,5
between the thickness and the length of the capital, the increase in
the failure load was of 21% in comparison to slab LC2 and 58% if
compared to slab LC1. However, slab LC4, which had the biggest column capital, didn’t show improvements in the ultimate punching
strength if compared to slab LC3.
Regarding the strains in concrete, it is observed that near the column face, slabs LC3 and LC4 presented higher compressive strains than slab LC2.This behavior was different considering the compressive strains in the outside of the column capitals, where
slabs LC2 presented higher strains than the others. These differ-ences are in agreement with the position of the failure surface
ob-served after tests. Slab LC2 failed in the outside of the columns
capital whereas slabs LC3 and LC4 failed inside the capitals. The
use of column capitals was also beneicial in terms of ductility. Ten
-sile strains measured in the lexural bars showed that in the case
of slab LC1 only two bars yielded before failure, which results in a yield radius (rys) of 3.23·d. For slabs LC2 and LC3 the yield radius rys was of 5.02·dand for slab LC4 almost all monitored bars yielded before failure, resulting in a yield radius rys of 6.95·d.
4. Computational analysis
Experimental tests are fundamental for the development and im
-provement of theoretical methods. However, the complete under
-standing of the behavior and failure mechanisms may be ham -pered because of displacements and strains results are restricted to the points of the experimental model in which gauges were
in-stalled. An eficient methodology to complement the analysis of ex
-Figure10 – Numerical modeling axisymmetric (Menetrey [15])
Experimental model of one of the slabs tested by Kinnunen and Nylander
Numeric model of theslab tested by Kinnunen and Nylander
Elements used in numerical models
Quadratic axisymmetric element
Ring element
Bar element
A
B
Model of slab LC1
A
Modelof slab LC2
B
Modelof slab LC3
C
Model of slab LC4
perimental results and is to carry computational non-linear inite el
-ement analysis, which after calibration may return comprehensive results. This topic presents results from nonlinear inite element analysis carried using commercial software MIDAS FEA. Axisym -metric computational models were generated using as reference analyzes made by Ferreira [14], Menétrey [15] and Trautwein [16]. In these analyses authors adapted the geometry and the reinforce-ment of slabs in order to use axisymmetric models. Flexural re-inforcement which were originally placed in orthogonal arrange-ments were adjusted and changed to axisymmetric reinforcement formed by rings and by radial bars, as shown in the Figure 10. Comparisons between experimental and computational results pre-sented by Ferreira [14] and Menétrey [15] indicate that the axisym-metric theoretical models present load-displacement response stiffer
than what is observed in tests with experimental models with orthogo -nal reinforcement. According to the authors, these results indeed
de-scribe the expected behavior once axisymmetric reinforcement are more effective than orthogonal reinforcement in terms of bending and cracking. They use results from Kinnunen and Nylander [7] as
ent lexural behavior, the ultimate punching resistance of slabs with
orthogonal or axisymmetric reinforcement are similar. Therefore,
axi-symmetric computational analyses are valid and may provide a better
understanding of the punching shear failure mechanism.
Based on literature, the input data used in the computational
non-linear analysis to deine the properties of concrete and steel were: Poisson’s ratio of the concrete νc = 0,15; compressive strength of concrete fc = 32 MPa; modulus of elasticity of concrete Ec = 27
GPa; Fixed Total Strain Crack Model; Effect of lateral cracking ac
-cording to Vecchio and Collins [17];Coninement effect neglected; basic value of fracture energy for a maximum aggregate size of 9.5
mm Gf0 N.mm/mm2 = 0.0259; compressive fracture energy G c = 10
N.mm/mm2 ; modulus of elasticity of steel E
s = 200 GPa, Poisson’s
ratio of the steel νs = 0.30; Yield stress of steel fys = 550 N/mm2.
The fracture energy was calculated using Equation 10.
(10)
7, 0
0
cmf
f
G
f
f
G
Displacements of slab LC1
Displacements of slab LC3
A
C
Displacements of slab LC
Displacements of slab LC4
B
(11)
f
f
f
cm
'
c
Where:
Gf0is the basic value of fracture energy determined as a function of the aggregate size;
fcmis the average compressive strength of concrete (Equation 11); fcm0is assumed as 10 MPa.
The load was considered as a 50 mm displacement applied at 100
mm from the edges of the slab into 160 load steps. The equilibrium between external and internal force vectors was veriied using the Newton-Raphson method, which is an incremental iterative pro
-cedure. An energy based convergence criterion was used with a tolerance value of 1∙10−3. The concrete compressive behavior was described with a parabolic hardening and softening relationship
proposed by Feenstra[18]. The unconined uniaxial tensile stress– strain diagram was assumed to be linear in tension until cracking. After cracking it was assumed that the tensile stress decreases
exponentially as a function of strain in the direction normal to the
crack. More details are available in Lima Neto [19].
4.1 Slab without column capital
A parametric investigation was performed in order to establish the ideal reinement for the inite elements mesh, for the tensile
strength of concrete (fct) and for the shear retention factor (βc).
Figure 11 presents the optimal inite elements mesh used in the
computational models of tested slabs. For the tensile strength of
concrete and the shear retention factor were used values of 1.85 MPa and 0.12, respectively. Figure 12a presents the load-displace
-ment curves for experi-mental and computational models. As ex
-pected, the computational models were stiffer in terms of lexural
response but the ultimate punching shear strength for both models were similar. The ultimate strength of experimental model was 327
kN and the computational failed with 309 kN (difference of 5.5% as
shown in Table 3). The distribution of the normal stresses of Figure
13a show the formation of 2 strut compressed, the most signiicant being that may have generated the tensile stresses which allowed
the opening of the rupture surface. Just as concentrated
compres-sive stresses near the binding slab-column value above the com
-pressive strength of the concrete, that may have generated the
crushing of concrete at this point and thus made possible rupture by punching. Note also that the approximated radius to appear-ance of rupture supposed cone on the upper face of the slab, from the face of the column would be close to that found experimentally
(2.8·d).
Figure 14a shows radial tangential cracks in 3 different areas of the slab. The irst crack is in the projection of the column edges and
is formed in the early load stages mainly due to stresses caused
by lexure. The second tangential crack appears in advanced load stages and is supposed to be formed by lexure and shear stress
-es. This crack develops towards the column edges and may even
-tually divide the original fan strut into two mains prism struts. The third radial crack was observed immediately after the peak load
during the computational analysis and may indicate the formation
of the critical shear cracks that leads to a punching shear failure.
Assuming that this third radial crack represents the failure surface,
it is possible to see that it would form a 24º angle with the
horizon-tal, similar to inclination of the failure surface observed after test,
which was of 23º.
Figure 15a and 15b present comparisons between computational and experimental results for strains in the concrete surface of slab
LC1. It is possible to observe that in case of tangential strains there
is consistency between computational (C1N and C2N) and
experi-mental (C1 and C2) results. However, for the case of radial strains,
computational (C3N and C4N) and experimental results (C3 and
C4) were consistent only for initial load stages but differed signii -cantly for the ultimate load stage. In experimental tests radial strain
gauges registered tensile strains, what in fact was not observed in
the computational analyzes.
4.2 Slabs with column capitals
The inite elements mesh was reined for analyzes of slabs with
column capitals as shown in Figure 11. Minor changes in the
ad-opted values of the tensile strength of concrete and of the shear retention factor were also necessary in order to improve the quality
of computational results. Therefore, for slab LC2 were adopted fct =
1.75 MPa and βc = 0.15. For slab LC3 were adopted fct = 1.72 MPa and βc = 0.16 and for the slab LC4 were used fct = 1.85 MPa and βc = 0.15.Computational models of slabs with column capitals also showed a stiffer load-displacement response if compared to
ex-perimental results. However, peak loads of computational models were similar to failure loads observed on tests as show in Table 3. The LC3 slab, with a slope of 1:3, showed a rupture of 518.5 kN
experimental and numerical analysis model of a loading capacity
of 456.5 kN, namely, a difference of 12%, but with proper behavior and rupture mode close to what was observed in laboratory. It also highlights that there was a gain in load capacity compared to previ
-ous slabs, provided by the increase of the capital, and was also observed a surface of rupture inside the capital, as happened with the slabs tested. The loading to slab LC4 was 513.5 kN experi
-mental and numerical of 457.3 kN, namely, the strength capacity of
the slab shaped was 11% lower than experimental. Note that the
slab with a 1:4 slope capital did not present improvement in load
capacity when compared with the slab slope of 1:3 (LC3), as was
observed experimentally.
In Figure 13b it is observed to the slab LC2 in the last step load,
forming a compressed strut, starting from the outer edge of the capital on the underside of the slab to the top surface of the same.
Probably this strut compressed generated tensile stresses which
enable the opening of the collapse cone, since the underside of
the slab, the edge of the slab with capital realizes a compressive stress values above the compressive strength of the concrete ad -opted for the slab. Thus, there is an indication that this rupture, as
was observed in the laboratory, has been starting at outside edge of the capital with the slab. Figures 13c and 13d is perceived, as in the previous model, which models of the slabs LC3 and LC4 present the development of a strut compressed with tensile stress on your back.
Stress Max on the rupture load of the slab model LC1 and the angle of the rupture surface experimental
Stress Max on the rupture load of the slab model LC2 and the angle of the rupture surface experimental
Stress Max on the rupture load of the slab model LC3 and the angle of the rupture surface experimental
Stress Max on the rupture load of the slab model LC4 and the angle of the rupture surface experimental
A
B
C
Cracks of the slab LC1 referring to rupture
Cracks of the slab LC2 referring to rupture
Cracks of the slab LC3 referring to rupture
Cracks of the slab LC4 referring to rupture
A
B
C
probably started in connection of the capital with the column. It
is observed that the rupture surface, starting at the column face, may have reached a radius of approximately 489 mm, the LC3 slab model, near to 3.2·(d + hH) found in the laboratory, and 558 mm, the LC4 model slab, this being also near the experimental
(4·(d+hH)).
In Figure 14b is noted tangential cracks in the upper face of the
LC2 slab model, already stabilized more or less the same locations
were observed where the higher radial strain and the appearance
of probable rupture surface, with an inclination of approximately
22º, noting that the experimental presented variation between 20º and 24º. In Figures 14c and 14d is observed the tangential cracks
of the LC3 slab model, on the upper face, already stabilized more
or less the same locations were observed where the higher radial
strains on LC2, and the appearance of probable rupture surface, with an inclination of approximately 22°, highlighting that the
ex-perimental presented variation between 20º and 24º. The model slab LC4 has a greater amount of tangential cracks compared to previous models, including cracks occurring in the internal re
-gions capital. These internal cracks can be attributed to the greater length of the capital used in this model, causing cracks that be -fore appeared just at the end, entered the boundaries thereof. It is
observed that the tangential cracks occurred in the same regions where appeared high tangential strains, as observed in previous slabs, even the rupture surface, showing a projection with an incli -nation of approximately 19°.
In Figure 15 there is a comparison between the strains of the con-crete, experimental (C1, C2, C3, C4, C5, C6 and C7) and numeri-cal models (C1N, C2N, C3N, C4N, C5N, C6N and C7N) for slabs with capital (LC2, LC3 and LC4). In general, it is clear that the tan-gential strain (see Figures 15c, 15e and 15g) of numerical models
approached the experimental, thus conirming the good behavior
of the models in the analysis of slabs. Thus, there is again a
ten-dency of the slabs present higher values of strain at the points
where the appearance of the identiied rupture surface. Note also
that the strain of the numerical models tend to be slightly smaller
than the experimental for the same loading level, which can be at -tributed to the axisymmetric distribution of the reinforcement, which
makes models stiffer in relation to the slabs. For radial strain (see Figures 15d, 15f and 15h), as observed in the slab without capital (LC1), are perceived near deformations, between the experimental
and numerical modeling, in the early stages of loading, but with
discordant values for the same level of loading in the last steps of
load. Except for radial strains in the slab LC2 which showed similar between the numerical models (C5N and C4N) and experimental
(C4 and C5), for the same load level, especially in relation to strain
inside the capital, near the face column.
5. Evaluation of calculus methods
The Table 3 shows the rupture loads seen in the experiments (Pu)
and the rupture loads estimated by the recommendations of EU
-ROCODE 2 [11] and NBR 6118 [10] (VRc), and the location of the rupture surface, since these could occur inside (internal) or out-side (external) of the area corresponding to the capitals. For ex-perimental rupture loads observes values near of the rupture loads estimated by the recommendations of ECUROCODE 2 [11]. The
the capital, and it was revealed experimentally that capitals with in
-clination above of 1:3 has its contribution to the punching strength
reduced. Almost all slabs had a relation Pu/VRc near to 1.0, with the exception of the slab LC4. Regarding the NBR 6118 [10], there is rupture loads, mostly the loads near encountered by estimates
EUROCODE 2 [11], with the exception of the loads concerning slabs that have capitals with inclination higher than 1:2 (LC3, LC4).
In spite of recommendations presented similar formulations, it is noted that the limits for the use thereof are different, when referring to the control perimeter after all NBR 6118 [10] is independent of the perimeter length of the capital, and must be always respected
the ratio 1:2 on the thickness thereof, thereby forcing an angle of
26.6º from the column face. Therefore, applying the limits found in the code, it is noticed that the slabs with capital inclination of 1:3
and 1:4, the control perimeter to be used has a length of 2·dH and
thickness with effective depth d, and thus the estimated values are
presented somewhat conservative. Regarding the rupture surfac
-es was observed that the NBR 6118 [10] showed good r-esults, be
-cause their estimates coincide with the rupture surfaces observed experimentally (see Figure 16). The estimates by EUROCODE 2 [11], to the rupture site was determined using the equality between
formulations VRc,int and VRc,ext. With this equality is possible to deter
-mine the equivalent value of lH (circular capital) that has the limit between these two rupture modes. Thus, experimentally, the slabs had to rupture just outside the capital with inclination 1:2, initially
agreeing with the code (EUROCODE 2 [11]), however, for slabs
an inclination higher than 1:2, the rupture occurred in an internal
region of the capital, diverging from what was estimated.
The Table 3 shows a comparison between the experimental rup-ture loads and the estimated ruprup-ture loads by the CSCT. It is
ob-served that the estimated loads presented in all the slabs, some conservative values regarding experimental loads, the ratio Pu/Vcsct shows an average of 1.32. It is noticed that the more conserva
-tive value was observed in the slab LC3, with capital of 165 mm in length, and less conservative in slabs without capital or capital with inclination 1:2. Related to the place of rupture is observed that
the estimates showed good results. It is emphasized that the slab LC2, with an inclination of 1:2, although the rupture mode assigned thereto, the slab has a proximity between the two rupture modes
possible with difference of about 5 kN between the internal rupture
load and external rupture load of the capital.
6. Conclusions
In the analysis of experimental rupture loads was used normative and theoretical recommendations developed about it. In the pres
-ent work were used the recommendations of EUROCODE 2 [11], the NBR 6118 [10] and the Critical Shear Crack Theory. Then we observe that the estimates for the rupture load EUROCODE 2 [11]
(VRc) had good results, with values close to the experimental rela-tion with Pu/VRc around 1.0, except for the slab LC4. Once the code
in question considers the contribution the increase in load capac
-ity the capital, even to inclination the capital above of 1:3, a fact that has not been veriied experimentally. Regarding the estimate
for the rupture site, the slabs with an inclination of 1:2 showed
external rupture, whichever is provided by the code, but for the
inter-Tangential strains in the slab LC1
Tangential strains in the slab LC3 Tangential strains in the slab LC2
Tangential strains in the slab LC4 A
E C
G
Radial strains in the slab LC1
Radial strains in the slab LC3 Radial strains in the slab LC2
Radial strains in the slab LC4 B
F D
H
Load (kN)
Load (kN)
Load (kN)
Load (kN)
Load (kN)
Load (kN)
Load (kN)
LC1 and LC2, but with conservative values in relation to slabs LC3 and LC4. As for the location of the rupture surface appearance the code showed good estimates for all slabs. Regarding the CSCT
was observed conservative results, because of the theory that uses a perimeter of control with a radius of 0.5·d from the column face and the capital limit. The ratio between the experimental and rupture loads estimated by the CSCT (Pu/Vcsct) had an average of 1.32. It is observed that the estimated for LC3 was close to slab
LC4, which indicates a better assessment as to the contribution the capital for relations hH:lH of 1:3 and 1:4. One can also be seen that in relation to the rupture surface, this theory had good results, but
it is observed in the slab LC2 a balance between the internal and external rupture loads, with a difference of about 5 kN.
The computational models showed greater stiffness compared to experimental, with lower displacements for the same
load-ing level, as expected, since the reinforcement of the numerical
model was axisymmetric and the experimental arranged
orthogo-nally. However, regarding the rupture surface, the strains in the
concrete and the rupture loads realize good results in computer models of experimental relation to mainly the slabs LC1 and LC2, that showed 5% difference between the experimental and numer-ical loads. Also shown as approaching to the inclination of rupture
surface computational with what was observed experimentally, thus conirming the eficiency of the model. For the slabs LC3 and LC4 presented differences in average by 10% from numeri -cal and experimental rupture loads, as well as good approxima-tion for rupture surface.
7. Acknowledgements
The authors would like to thank the CNPq and CAPES for inan -cial support.
8. References
[01] GASPARINI D. A., Contributions of C. A. P. Turner to development of reinforced concrete lat slabs
1905–1999. Journal of Structural Engineering, 2002, 128, No. 10, 1243–1252.
[02] FURST, A., MARTI, D., Robert Maillart’s design approach for lat slabs. Journal of Structural Engineering,
1997, No. 123(8), 1102–1110.
[03] KIERDORF, A., Early Mushroom Slab Construction in Switzerland, Russia and the U.S.A. - A Study in Parallel Technological Development, In: Proceedings
of the Second International Congress on Construction
History, vol II, pp 1793 – 1807. Cambridge Construction History Society, Cambridge University, 2006.
[04] MELO, G. S. S. A., Behavior of Reinforced Concrete Flat Slabs after Local Failure. PhD Thesis, Polytechnic
of Central London, London, England, 1990, 214p. [05] TALBOT, A. N., Reinforced Concrete Wall Footings
and Column Footings. Engineering Experiment Station,
University of Illinois, Urbana, Bulletin No. 67, Mar.
1913, 114p.
[06] RICHART, F. E., Reinforced Concrete Wall and Column
Footings. ACI Journal, Proceedings, V. 45, No. 10,
Concrete Slabs Without Shear Reinforcement. Transactions of the Royal Institute of Technology,
No. 158, Stockholm, Sweden, 1960, 112 pp.
[08] WEY, E. H., 1991. Seismic response of slab-column
connections with shear capitals.PhD Thesis, Rice University. Houston, Texas.
[09] HUESTE, M. B. D., BROWNING, J., LEPAGE, A. and WALLACE, J. W., Seismic Design Criteria for
Slab-Column Connections, ACI Structural Journal, 2007; 104(4): 448–11.
[10] ASSOCIAÇÃO BRASILEIRA DE NORMAS TÉCNICAS. NBR 6118 – Projeto de Estruturas de Concreto. Rio de
Janeiro, 2007.
[11] EUROCODE 2, Design of Concrete Structures – Part
1-1: General Rules and Rules for Buildings, CEN, EN 1992-1-1, Brussels, Belgium, 2004, 225 pp.
[12] MUTTONI, A., Punching Shear Strength of Reinforced Concrete Slabs without Transverse Reinforcement,
ACI Structural Journal, V. 105, No. 4, July-Aug. 2008, pp. 440-450.
[13] MUTTONI, A., and SCHWARTZ, J., Behaviour of Beams and Punching in Slabs without Shear Reinforcement, IABSE Colloquium, V. 62, Zurich,
Switzerland, 1991, pp. 703-708.
[14] FERREIRA, M. P. (2010). Punção em Lajes Lisas de
Concreto Armado com Armaduras de Cisalhamento e
Momentos Desbalanceados. Tese de Doutorado em Estruturas e Construção Civil, Publicação E.TD – 007 A/10 Departamento de Engenharia Civil e Ambiental, Universidade de Brasília, Brasília, DF, 275p.
[15] MENETREY, Ph., Relationship between lexural and
punching failure. ACI StructuralJournal, 1998;
95(4): 412–9.
[16] TRAUTWEIN, L. M., 2001. Punção em Lajes
Cogumelo de Concreto Armado com Armadura de Cisalhamento Tipo “Stud Interno” e Tipo “Estribo
Inclinado”. Dissertação de Mestrado, Publicação 001 A/2001, Departamento de Engenharia Civil e Ambiental, Universidade de Brasília, Brasília, DF, 165p.
[17] VECCHIO, F. J., COLLINS, M.P., The Modiied
Compression Field Theory for Reinforced Concrete
Elements Subjected To Shear. Proceedings V. 83,
No. 2, Mar.-Apr. 1986, pp. 219-231
[18] FEENSTRA, P. H., Computational Aspects of Civil Engineering, Delft University of Technology, Delft,
Netherlands, 1993, 149 p.
![Figure 4 – Control perimeters recommended by NBR 6118 [10]](https://thumb-eu.123doks.com/thumbv2/123dok_br/18860297.417817/5.892.65.831.170.408/figure-control-perimeters-recommended-by-nbr.webp)
![Figure 6 – Adaptations in the critical shear crack theory as presented by [12]](https://thumb-eu.123doks.com/thumbv2/123dok_br/18860297.417817/6.892.458.830.324.406/figure-adaptations-critical-shear-crack-theory-presented.webp)