ISSN 0104-6632 Printed in Brazil
www.abeq.org.br/bjche
Vol. 32, No. 01, pp. 269 - 281, January - March, 2015 dx.doi.org/10.1590/0104-6632.20150321s00001715
Brazilian Journal
of Chemical
Engineering
ADSORPTION OF THE DYE REACTIVE BLUE 5G
IN RETORTED SHALE
R. Lambrecht
1, M. A. S. D. de Barros
1, P. A. Arroyo
1, C. E. Borba
2*and E. A. da Silva
21
Chemical Engineering Department, State University of Maringá, Av. Colombo 5790, CEP: 87020-900, Maringá - PR, Brazil.
Phone: + (55) (45) 3379 7092; Fax: + (55) (45) 3379 7000 E-mail: [email protected]
2
Chemical Engineering Department, State University of the West of Paraná, Faculty Street 645, La Salle Garden, CEP: 85903-000, Toledo - PR, Brazil.
(Submitted: February 21, 2012 ; Revised: March 19, 2014 ; Accepted: March 21, 2014)
Abstract - In this study the influence of the volumetric flow rate and feed concentration was investigated for the adsorption of the reactive dye Blue 5G. Experiments were carried out in a bed packed with retorted shale,
at 30 oC. The ranges investigated were flow rate 2 -10 mL/min and the feed concentration 13-105 mg/L.
Mathematical models were used to represent the dynamic sorption. The double resistance model considers the effects of the axial dispersion and the mass transfer resistance of the external film and inside the particles. As a result, the mass transfer coefficient of the external film and the internal mass transfer coefficient were estimated. The Thomas model was used to simulate the experimental data. In this model the fitted parameter was the adsorption kinetic constant. The first model provided an acceptable representation of the dynamic uptake of the reactive dye Blue 5G.
Keywords:Mathematical modeling; Packed bed; Reactive dye; Adsorption; Shale.
INTRODUCTION
The contamination of natural waters is one of the greatest problems confronting contemporary society. The textile industry is notable among the industries that produce effluents with high pollution loads, commonly composed of organic molecules and com-plex salts (Koyuncu and Topacik, 2003). The envi-ronmental problems caused by dyeing effluents are even more serious when unfixed or non-degraded dyes from conventional treatment processes are dis-charged, since they have a potentially high environ-mental impact on water bodies due to their toxicity (Maurya et al., 2006).
There are around 10,000 different industrial dyes and pigments, totaling an annual world consumption
of 700,000 tons (Pearce et al., 2003), 26,500 tons of
which are consumed in Brazil (Guaratini and Zanoni, 2000). Reactive Blue 5G is one of the main dyes used in dyeing facilities since it is used in the pro-duction of blue denim.
The environmental problems related to the tex-tile industry are numerous and well documented
(Mahmoodi et al., 2010a; Mahmoodi et al., 2010b;
Gottipati and Mishra, 2010; Lima et al., 2007; Epolito
et al., 2005). Besides the removal of organic loads, blue color removal is one of the main objectives in the treatment of textile effluents.
have been used to remove dyes such as Reactive Blue 5G and other compounds from effluents. The physicochemical processes include chemical oxida-tion (with chlorine, peroxide, or ozone), coagulaoxida-tion, flocculation, precipitation, membranes, ion exchange, and adsorption (Dizge et al., 2008).
The process of adsorption in activated carbon-packed beds is an effective method of decolorization (Rozzi et al., 1999; Jain and Sikarwar, 2009). In fact, this dynamic process has been widely used as it combines advantages such as reduced space, simple operation, treatment of large volumes of effluent, significant yield, large range of feed concentrations
and easy scaling-up (Valdman et al., 2001; Silva et
al., 2002). Besides studying activated carbon-packed
beds, research has also been focused on investigating the use of residues as alternative sorbents, seeking to reduce both the sorbent production and disposal costs. Alternative sorbents include sawdust, fruit bagasse, eucalyptus bark, and chitosan (Crini, 2005), as well as retorted shale, which is produced from burning shale (bituminous rock) in the absence of the oxygen (Lee, 1991). Shale sub-products have been investigated, although scarcely, and the promising use of these materials for the removal of organic
molecules has been reported (Tütem et al., 1998;
Al-Qodah, 2000).
The design of retorted shale-packed beds requires information on the removal capacity of the sorbent and the mass transfer effects, which are evaluated through the breakthrough curves. The breakthrough curves are influenced by the equilibrium conditions and several other parameters, mainly temperature, volumetric flow rate and particle diameter (Koprivanac
et al., 2005).
One of the requirements in scaling-up packed beds is a mathematical model that accurately repre-sents the experimental data. Several mathematical models have been successfully used to represent the dynamic dye uptake and these include the Bohart and Adams, Thomas, and Yoon-Nelson models (Rozada
et al., 2003; Lin et al., 2004; Ahmad and Hameed, 2010). Although the good performance of shale oil ash as a dye adsorbent has been successfully pre-dicted through the BDST (Bed Depth Service Time) model (Al-Qodah and Lafi, 2003), few results which take into account the mass transfer mechanism have been reported. Therefore, the main objective of this study was to evaluate a mathematical model that represents the adsorption of Reactive Blue 5G in retorted shale. The mathematical model investigated considered the intraparticle and film mass transfer.
The influence of volumetric flow and feed concen-tration on the sorption mechanism was investigated and the accuracy of the model is discussed.
MATERIAL AND METHODS
Adsorbent
All experiments were carried out using a Petrosix (a Petrobras subsidiary) retorted shale sample. The sample was also submitted to a sieving classification.
Reactive Blue 5G Dye
Dye solutions were prepared with a commercial sample manufactured by Texpal Química Industry. The concentration of dye in each solution (13-105 mg/L) was determined by UV/Vis spectroscopy in the 350-1000 nm wavelength range on a Shimadzu UV-Visible spectrophotometer (UV - 1601PC) at 610 nm, which was experimentally determined. This wavelength is in agreement with results reported in Batzias and Sidiras (2004).
Fixed-Bed Column Assays
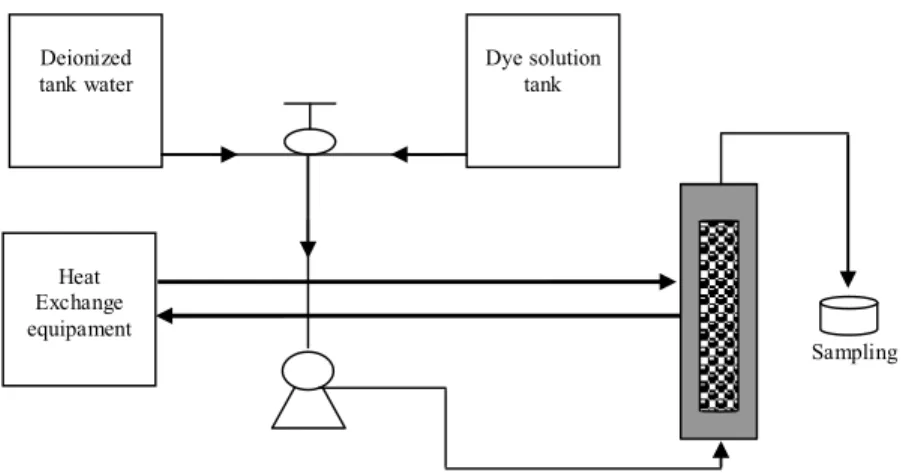
The adsorption unit is shown in Figure 1. The module consisted of a stock solution reservoir and a deionized water reservoir, which was used to ho-mogenize the bed and stabilize the flow rate. A Cole Parmer peristaltic pump fed the column (ID of 1.01 cm) that contained the packed bed and was kept
at a constant temperature of 30 oC. Runs were carried
out using an up-flow process and outlet samples were carefully taken at regular running times. Analy-sis of the dye concentration of each sample allowed
the plotting of the breakthrough (C/C0 versus time)
curves.
Five runs with a feed concentration of 35 mg/L were carried out using different flow rates (2.0; 4.0;
6.0; 8.0 and 10.0 mL/min) at 30 oC. In each run
per-formed the inlet solution percolated a packed bed of 7.264 g of retorted shale. The total packed bed height (L) was 9.5 cm. From the breakthrough curves ob-tained it was possible to determine the flow rate that minimized the mass transfer resistances.
Adsorption of the Dye Reactive Blue 5G in Retorted Shale 271
Deionized tank water
Heat Exchange equipament
Dye solution tank
Sampling
Figure 1: Scheme of the experimental module.
Calculation of the Column Adsorption Capacity and the Length Of Unused Bed (LUB)
The amount of dye removed by the adsorbent was calculated from experimental breakthrough curves using the mass balance:
* 0 0
0 0
1 t
out L
s
Q C C V C
q dt
m C m
(1)
where q* is the amount of dye which has been
re-moved when equilibrium is reached (mg/g), Q is the
volumetric flow (L/min), C0 is the feed
concentra-tion, ms is the mass of adsorbent, Cout is the dye
concentration at the column outlet, VL is the bed
volume and ε is the bed porosity. The bed porosity
was determined as methodology presented by Borba
et al. (2006).
The integral in Equation (1) was solved numeri-cally by the trapezoid rule, using the experimental data obtained from the breakthrough curves.
A plot of q* against C0 for the ten experimental runs using different feed concentrations generated the dynamic isotherm (isotherms obtained through
breakthrough data – Ernest Jr., 1997; Gazola et al.,
2006). The Langmuir parameters were then esti-mated through a nonlinear fitting method (Ostroski
et al.; 2009).
When a favorable isotherm is observed, the con-centration profile in the mass- transfer zone acquires a wave shape that does not change as the zone moves
through the bed. The LUB is obtained as related in
Geankoplis (2003).
MATHEMATICAL MODELING
In this study, the process of dye removal in a packed bed filled with retorted shale was modeled through two models. The first one assumes that the adsorption process can be described by a pseudo second-order rate expression and was developed by Thomas (1944). The second model assumes internal and external mass transfer limitations. Both models consider the following assumptions related to the operating conditions: constant column void fraction, constant physical properties of the solid and fluid phases, and isothermal and isobaric process condi-tions.
Thomas Model
The Thomas model considers the following as-sumptions: axial and radial dispersion in the packed bed column is negligible, the adsorption rate is de-scribed by Langmuir kinetics and intraparticle diffu-sion and external resistances are negligible.
On the basis of these assumptions, the mass bal-ance of the dye concentration in the fluid phase is described by:
0
, , ,
0 B
C z t q z t C z t u
t t z
(2)
where C is the concentration of dye in the bulk
liquid phase (mg/L), q is the average concentration
of the dye in the adsorbent (mg/g), B is the density of the bed (g/L), is the porosity of the bed, t is the time (min) and z is the bed height (cm).
process can be described by a pseudo second-order rate expression given by:
max
,
, , ,
a d
q z t
k q q z t C z t k q z t t
(3)
where kais the adsorption kinetic constant (L /mg min), d
k stands for the desorption kinetic constant (min-1)
and qmax is the maximum adsorption capacity (mg/g).
At equilibrium, q/t = 0 and Eq. (3) is simpli-fied to give the Langmuir isotherm:
* * max
*
1
q bC q q
bC
(4)
where qmax is the Langmuir isotherm parameter for
the maximum adsorption capacity (mg/g), b is the
Langmuir equilibrium constant parameter isotherm
(L/mg) and CC* at equilibrium.
The Langmuir constant can be defined as the ratio between the adsorption and desorption rate constants (b = ka/kd). Hence, Eq. (3) can be rewritten as follows:
max
,
, , a ,
a
q z t k
k q q z t C z t q z t
t b
(5)
The initial conditions of the fluid phase concen-tration and of the average concenconcen-tration of adsorbed dye in the solid phase are, respectively:
,0 0C z (6)
,0 0q z (7)
The boundary condition suggested by Amundson (1948) are:
0
0 0
0,
0
t C t
C t
(8)
The analytical solution to the Thomas model is obtained after solving Equations (2) and (3) with the initial conditions provided by Eqs. (6)-(7) and the boundary conditionsof Eq. (8), as reported elsewhere (Thomas, 1944; Borba et al., 2008).
The parameter ka of the Thomas model was
ob-tained by fitting the experimental breakthrough data using UVMIF in the Fortran IMSL subroutines Therefore, ka is obtained through the minimization of the objective function:
2 exp mod
0 0
1
n
z L z L
OBJ i
C C
F
C C
(9)where n is the number of experimental data points,
exp
z L
C is the experimental dye concentration when
z = L and C modz L is the dye concentration, calculated by the model, when z = L.
Double Resistance Model
In this study, a more realistic model that con-siders double limitation effects was applied to de-scribe the dynamic removal of dye in the packed bed. The main assumptions in the mathematical modeling of the adsorption of the reactive dye in the packed bed were: solid/fluid interface equilibrium can be represented by the Langmuir isotherm, external film and intraparticle mass transfers occur and a linear driving force describes the concentration profile inside the particles.
Based on the above-mentioned assumptions, the mass balance of the dye in the fluid phase can be described by:
0
2
2
, , 1 ,
, 0 B
L
C z t C z t q z t
u
t z t
C z t D
z
(10)
where DL is the axial dispersion coefficient in the
liquid phase (cm2/min).
The mass transfer equations for the dye concen-tration in the external liquid film and for dye adsorp-tion onto the solid particles are, respectively:
,
*
, F
B
q z t K
C z t C t
(11)
,
*
, S
q z t
K q z t q t
(12)
where KF is the mass transfer volumetric coefficient
in the external liquid film (min-1), KS is the volumetric
mass transfer coefficient of the adsorbent (min-1),
*
C is the dye concentration in the liquid phase at
equilibrium (mg/L) and q* is the dye concentration
Adsorption of the Dye Reactive Blue 5G in Retorted Shale 273
Equation (12) considers that the mass transfer driving force varies linearly with the concentration of the dye sorbent. It is an approximation of the Fick law and is called the linear driving force model, which was originally proposed by Glueckauf and Coates (1947). This model has been successfully
applied to describe the adsorption of dye (Chuang et
al., 2003) from aqueous solution and organic
com-ponents from the gas phase (Dantas et al., 2011;
Otero et al., 2005).
The variables q* and C* are related by the
Langmuir isotherm. The mathematical expression of the Langmuir isotherm for a monocomponent system is represented by Eq. (4).
The mass transfer volumetric coefficient in the
adsorbent (KS) can be expressed as a function of the
local concentration of the dye in the fluid phase (Crank, 1979).
0
1 1
S S
local
K K
AC
(13)
where Clocal is the local concentration of the dye in the liquid phase.
The initial conditions of this model are given by Eqs. (6) and (7). The boundary conditions are written as suggested by Danckwerts (1953).
0 0
,
0, L
C z t
D u C t C
z
at z0 (14)
, 0C z t z
at zL (15)
In this study, the double resistance model was used in two different ways. First, the mass transfer coefficient in the solid phase is local-concentration independent. Secondly, the mass transfer coefficient in the solid phase is a function of the local concen-tration, as described in Eq. (13).
The mathematical models were solved using the finite volume method (Maliska, 1995). The system of partial differential equations was discretized in the
axial coordinate z. This generated a set of ordinary
time differential equations. These equations were solved according to the respective initial conditions by the subroutine DASSL in the Fortran code (Petzold, 1982).
Three groups of parameters are identified in the mathematical models. The first is related to the ex-perimental data. Parameters such as B, and u0 are examples. The second group includes the parameter
L
D , estimated as a function of the empirical
equa-tions. Finally, the third group considers some
pa-rameters estimated through the non-linear adjustment of the models to the experimental data and the least squares criterion. Parameters such as qmax, b, KF,
S
K , KS0, and A are good examples of the third group. More specifically,KF, KS, KS0 and A were obtained from the experimental data for the breakthrough,
whereas qmax and b were calculated from the
equi-librium data.
The axial dispersion coefficient was estimated according to (Ruthven, 1984):
0 0
20 1
2
L m
p p
D D
u d u d
(16)
where Dm is the molecular diffusivity of the dye in
water (cm2/min) and dp the particle diameter of the adsorbent (cm).
Parameter Identification Method
In this study, the model parameters were esti-mated in the non-linear fitting procedure using the experimental data and least squares statistical method to form the objective function (criterion). The values for the model parameters (KF, KS, KS0,
A) were obtained during the search for the minimum
of the objective function represented by Eq. (9). In the search procedure, the optimization method of Nelder and Mead (1965), in Fortran code, was used.
RESULTS AND DISCUSSION
Adsorbent
Samples used in the sorption process had an aver-age particle diameter of 0.22 mm, according to the sieving procedure.
Dynamic Adsorption
In order to obtain the dynamic isotherm, break-through curves at various flow rates were obtained. The saturation points were 1500, 790, 600, 480 and 200 min for the volumetric flows rates of 2, 4, 6, 8 and 10 mL/min, respectively. The lengths of unused
bed (LUB) are given in Table 1. It can be seen that
the LUB increased with the flow rate. When the flow
rate increases, the residence time in the bed decreases,
which results in lower bed utilization (Ko et al.,
a specific sorbent/sorbate system in which the resi-dence time is sufficient for the dye uptake without significant external resistance (Geankoplis, 2003).
Because the LUB was the shortest at 2 mL/min, this
was assumed to be the operational condition that best minimized the mass transfer resistances.
Table 1: LUB as a function of flow rate. T = 30 oC,
mads = 7.264 g.
Q (mL min-1)
LUB (cm)
2.00 4.27 4.00 5.91 6.00 5.87 8.00 6.53 10.00 6.49
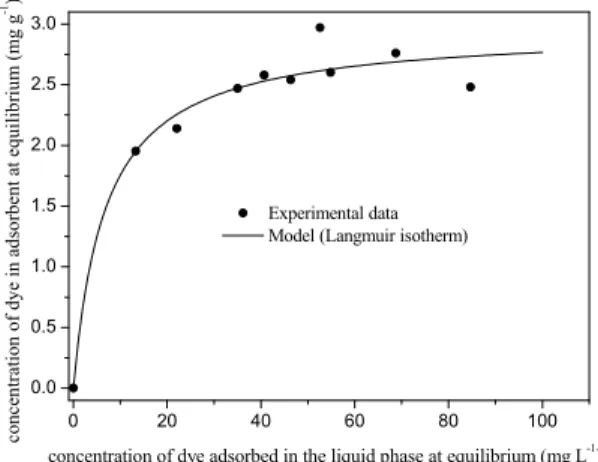
The experimental equilibrium data for the dye ad-sorption and the Langmuir isotherm models are shown in Figure 2. The values for the fitted
parame-ters of the Langmuir model were: qmax = 2.955 mg/g
and b = 0.146 L/mg. The average deviation between
the experimental and calculated data for the dye up-take capacity was 3.59% and the determination coef-ficient was 0.9840. Since this coefcoef-ficient is close to unity, it indicates a good fit between the model and the experimental data.
0 20 40 60 80 100
0.0 0.5 1.0 1.5 2.0 2.5 3.0
conc
en
tra
tion
of dy
e in ad
so
rbe
n
t at
e
qui
lib
riu
m
(m
g g
-1)
concentration of dye adsorbed in the liquid phase at equilibrium (mg L-1) Experimental data
Model (Langmuir isotherm)
Figure 2: Isotherm of dye adsorption on retorted
shale – Experimental data and Langmuir Model. T =
30 oC, mads = 7.264 g, Q = 2 mL min-1.
Modeling of the Breakthrough Curves- Effect of Volumetric Flow Rate
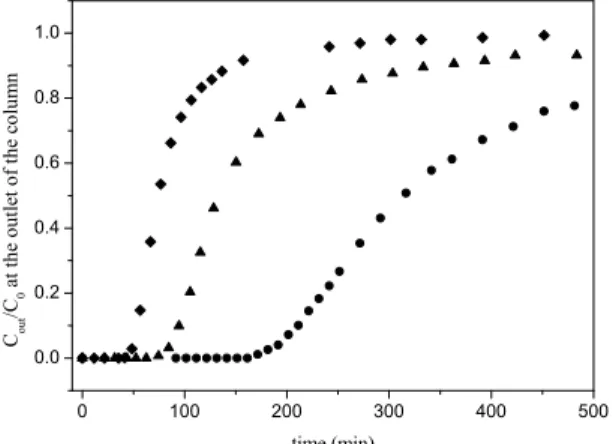
As expected, an increase in the flow rate resulted in a shorter time being required to reach the break-point. Moreover, when the flow rate was higher, the breakthrough curve was steeper. This effect can be observed in Figure 3.
0 200 400 600 800
0.0 0.2 0.4 0.6 0.8 1.0
Cout
/C
0
in
t
h
e ou
tl
et of
co
lu
m
n
time (min)
Q = 2 mL/min Q = 10 mL/min
Figure 3: Effect of flow rate on the breakthrough curve. T = 30 oC, mads = 7.264 g, (●) 2 mL min-1, (▲) 10 mL min-1.
The packed-bed characteristics necessary for the model applications were: B = 954.9 g/L, dL = 1.01 cm
and = 0.50. The values for the dispersion
coeffi-cients required for the double resistance model were calculated by applying Eq. (21). The molecular diffusion coefficient of the dye in water was
5 2
1.33 10 cm / min . This coefficient was
calcu-lated by the Wilke–Chang equation (Miyabe and Isogai, 2011). The values for the axial dispersion coefficients are presented in Table 2.
Table 2: Axial dispersion coefficient calculated as a function of the volumetric flow. T = 30 oC, mads =
7.264g.
Q (mL min-1)
DL
(cm2 min-1)
2.00 0.53
4.00 1.06
6.00 1.60
8.00 2.09
10.00 2.59
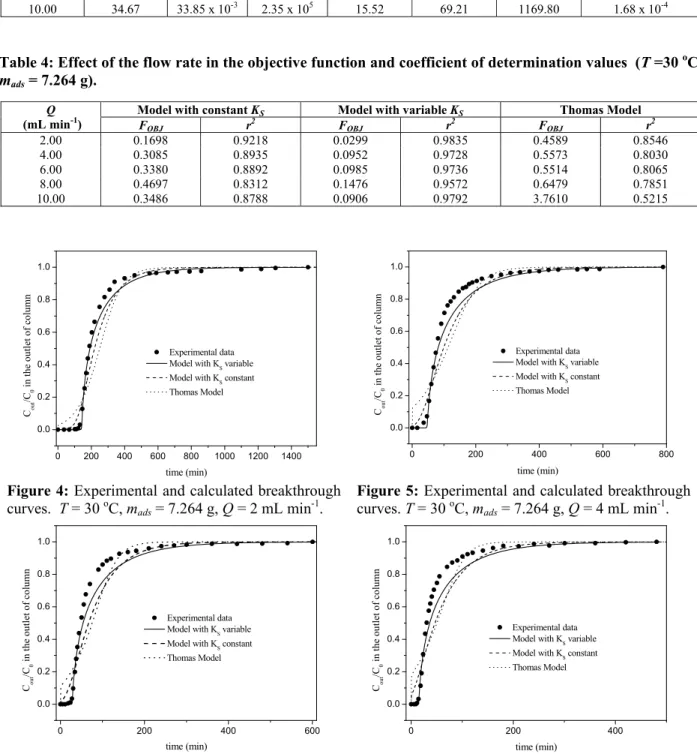
Table 3 presents the fitted parameters of the Thomas and double resistance models in which the volumetric mass transfer coefficient is expressed as a constant in the solid phase and as a function of the local concentration of the dye in the liquid phase.
The values of the objective function and the determination coefficient for each experimental condition are presented in Table 4. The low values for the objective function and the high values for the determination coefficient of the double resistance
model, with variable KS as a function of the local
Adsorption of the Dye Reactive Blue 5G in Retorted Shale 275
Table 3: Effect of the flow rate in the fitted parameters of the models (T = 30 oC, mads = 7.264 g).
Q (mL min-1)
C0 (mg L-1)
Model parameters with constant KS
Model parameters with variable KS
Thomas Model parameters KS
(min-1)
KF
(min-1)
KS0
(min-1)
A KF
(min-1)
ka
(L mg-1 min-1)
2.00 34.26 10.94 x 10⁻³ 2.74 x 10⁵ 15.95 72.71 754.00 4.38 x 10⁻⁴
4.00 35.06 14.00 x 10⁻³ 2.56 x 10⁵ 16.69 78.13 782.80 6.33 x 10⁻⁴
6.00 34.03 19.57 x 10⁻³ 5.61 x 10⁵ 17.03 77.73 876.20 1.11 x 10⁻³
8.00 34.73 21.64 x 10⁻³ 5.30 x 10⁵ 16.95 72.73 1013.20 1.41 x 10⁻³
10.00 34.67 33.85 x 10⁻³ 2.35 x 10⁵ 15.52 69.21 1169.80 1.68 x 10⁻⁴
Table 4: Effect of the flow rate in the objective function and coefficient of determination values (T =30 oC,
mads = 7.264 g).
Q (mL min-1)
Model with constant KS Model with variable KS Thomas Model
FOBJ r
2
FOBJ r
2
FOBJ r
2
2.00 0.1698 0.9218 0.0299 0.9835 0.4589 0.8546 4.00 0.3085 0.8935 0.0952 0.9728 0.5573 0.8030
6.00 0.3380 0.8892 0.0985 0.9736 0.5514 0.8065
8.00 0.4697 0.8312 0.1476 0.9572 0.6479 0.7851 10.00 0.3486 0.8788 0.0906 0.9792 3.7610 0.5215
0 200 400 600 800 1000 1200 1400
0.0 0.2 0.4 0.6 0.8 1.0
Cout
/C
0
in the
ou
tl
et
of c
o
lu
mn
time (min)
Experimental data Model with KS variable Model with KS constant Thomas Model
0 200 400 600 800
0.0 0.2 0.4 0.6 0.8 1.0
Cou
t
/C
0
i
n
t
h
e o
u
tl
et
o
f co
lu
m
n
time (min)
Experimental data Model with KS variable Model with KS constant Thomas Model
Figure 4: Experimental and calculated breakthrough curves. T = 30 oC, mads = 7.264 g, Q = 2 mL min-1.
Figure 5: Experimental and calculated breakthrough curves. T = 30 oC, mads = 7.264 g, Q = 4 mL min-1.
0 200 400 600
0.0 0.2 0.4 0.6 0.8 1.0
Cout
/C
0
in the
ou
tl
et
of c
o
lu
mn
time (min)
Experimental data Model with K
S variable Model with KS constant Thomas Model
0 200 400
0.0 0.2 0.4 0.6 0.8 1.0
Cout
/C
0
in the
ou
tl
et
of c
o
lu
mn
time (min)
Experimental data Model with KS variable Model with KS constant Thomas Model
Figure 6: Experimental and calculated break-through curves for T = 30 oC, mads = 7.264 g, Q = 6 mL min-1.
0 100 200 300 0.0
0.2 0.4 0.6 0.8 1.0
Cou
t
/C0
in
th
e o
u
tl
et o
f co
lu
m
n
time (min)
Experimental data Model with KS variable Model with KS constant Thomas Model
Figure 8: Experimental and calculated breakthrough curves for T = 30 oC,
mads = 7.264 g, Q = 10 mL min-1. Changes in the double resistance model with
variable KS were as expected and the values are
given in Table 4. The values for the parameter KF
increased with increasing flow rates, while KS is
flow-rate independent.
Effect of Feed Concentration
As expected, an increase in the feed concentration resulted in a shorter time being required to reach the breakpoint, indicating a lower treated volume. Moreover, when the feed concentration was higher, the breakthrough curve was steeper, as a conse-quence of a higher mass transfer between the fluid and solid phases. This effect can be observed in Figure 9.
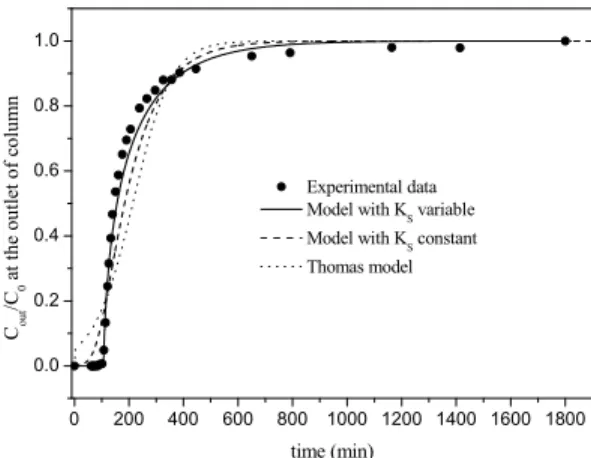
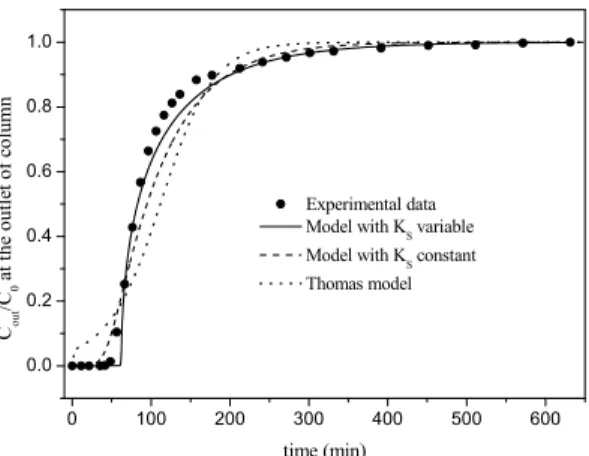
The experimental and simulated results for the breakthrough data for different feed concentrations are shown in Figures 10-19. The values for the fitted
parameters are given in Table 5. The values of the objective function and determination coefficient, for each experimental condition analyzed are presented in Table 6. It can be observed that the values for the
double resistance model with variable KS showed the
best fit for the experimental breakthrough data. Also,
the changes in the numerical values of variable KS
when the double resistance model was considered were as expected.
It was noted that KS increased with increasing
feed concentration, while the KF values were
feed-concentration independent. According to Ko et al.
(2001), the driving force for the mass transfer in the adsorption is determined by the differences in the local concentration between the phases. This ex-plains the better performance of the model when the mass transfer coefficient for the adsorbent was con-sidered to be function of the local concentration of the dye in the liquid phase.
0 100 200 300 400 500
0.0 0.2 0.4 0.6 0.8 1.0
Cout
/C
0
at
th
e o
u
tlet
o
f t
h
e c
o
lu
mn
time (min)
Figure 9: Effect of feed concentration on the breakthrough curve. T = 30 oC,
Adsorption of the Dye Reactive Blue 5G in Retorted Shale 277
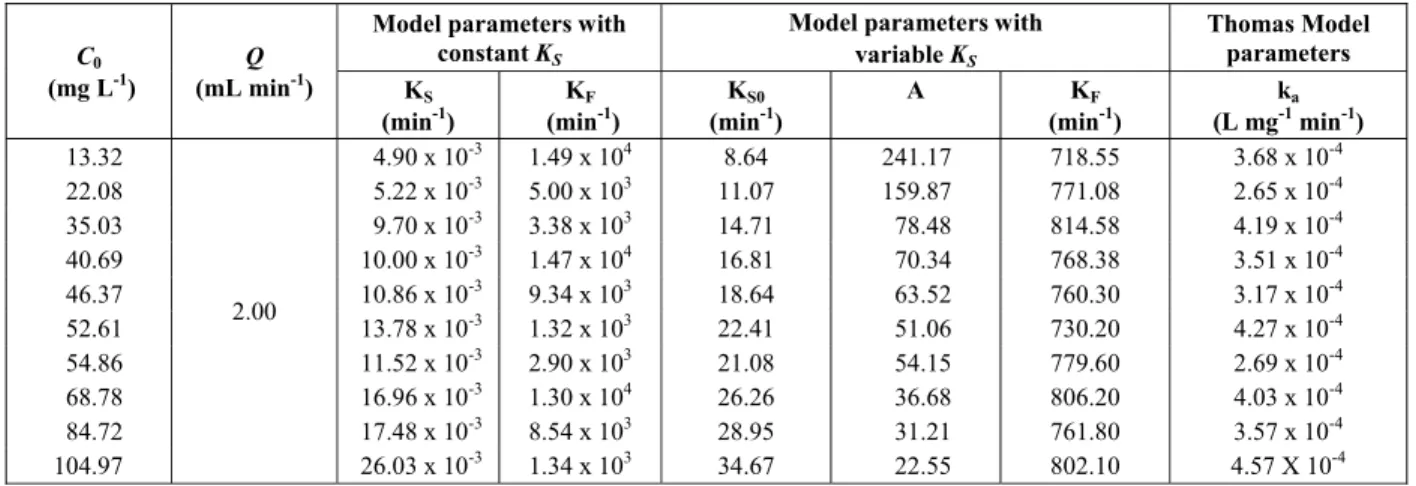
Table 5: Effect of the feed concentration in the fitted parameters of the models (T = 30 oC, mads = 7.264 g).
C0 (mg L-1)
Q (mL min-1)
Model parameters with constant KS
Model parameters with variable KS
Thomas Model parameters
KS (min-1)
KF (min-1)
KS0 (min-1)
A KF
(min-1)
ka (L mg-1 min-1) 13.32
2.00
4.90 x 10⁻³ 1.49 x 10⁴ 8.64 241.17 718.55 3.68 x 10⁻⁴
22.08 5.22 x 10⁻³ 5.00 x 10³ 11.07 159.87 771.08 2.65 x 10⁻⁴
35.03 9.70 x 10⁻³ 3.38 x 10³ 14.71 78.48 814.58 4.19 x 10⁻⁴
40.69 10.00 x 10⁻³ 1.47 x 10⁴ 16.81 70.34 768.38 3.51 x 10⁻⁴
46.37 10.86 x 10⁻³ 9.34 x 10³ 18.64 63.52 760.30 3.17 x 10⁻⁴
52.61 13.78 x 10⁻³ 1.32 x 10³ 22.41 51.06 730.20 4.27 x 10⁻⁴
54.86 11.52 x 10⁻³ 2.90 x 10³ 21.08 54.15 779.60 2.69 x 10⁻⁴
68.78 16.96 x 10⁻³ 1.30 x 10⁴ 26.26 36.68 806.20 4.03 x 10⁻⁴
84.72 17.48 x 10⁻³ 8.54 x 10³ 28.95 31.21 761.80 3.57 x 10⁻⁴
104.97 26.03 x 10⁻³ 1.34 x 10³ 34.67 22.55 802.10 4.57 X 10⁻⁴
Table 6: Effect of the feed concentration in the objective function and coefficient of determination values (T = 30 oC, mads = 7.264 g).
C0 (mg L-1)
Model with constant KS Model with variable KS Thomas Model
FOBJ r
2
FOBJ r
2
FOBJ r
2
13.32 0.5724 0.8061 0.1362 0.9591 0.1101 0.9645 22.08 0.3713 0.8592 0.0690 0.9612 0.8712 0.8007 35.03 0.1924 0.9156 0.0206 0.9856 0.5100 0.8174 40.69 0.2751 0.8978 0.0333 0.9733 0.6516 0.7974 46.37 0.2376 0.9011 0.0328 0.9773 0.5421 0.8378 52.61 0.0660 0.9703 0.0310 0.9789 0.2399 0.9132 54.86 0.2264 0.9017 0.0289 0.9809 0.5095 0.8232 68.78 0.0687 0.9654 0.0074 0.9905 0.2764 0.8915 84.72 0.1283 0.9623 0.0334 0.9725 0.4381 0.8367 104.97 0.0391 0.9862 0.0136 0.9845 0.2101 0.9023
0 200 400 600 800 1000 1200 1400
0.0 0.2 0.4 0.6 0.8 1.0
Cout
/C
0
a
t th
e out
le
t of
c
o
lu
m
n
time (min)
Experimental data Model with KS variable Model with KS constant Thomas model
0 200 400 600 800 1000 1200 1400 1600 1800 2000
0.0 0.2 0.4 0.6 0.8 1.0
Cout
/C
0
a
t th
e out
le
t of
c
o
lu
m
n
time (min)
Experimental data Model with KS variable Model with KS constant Thomas model
Figure 10: Experimental and calculated break-through curves. T = 30 oC, mads = 7.264 g and C0 = 13.32 mg L-1.
0 200 400 600 800 1000 1200 1400 0.0
0.2 0.4 0.6 0.8 1.0
Cout
/C
0
a
t t
he
out
le
t of c
olum
n
time (min)
Experimental data Model with KS variable Model with KS constant Thomas model
0 200 400 600 800 1000 1200 1400 1600 1800
0.0 0.2 0.4 0.6 0.8 1.0
Cout
/C
0
a
t t
he
out
le
t of c
olum
n
time (min)
Experimental data Model with KS variable Model with KS constant Thomas model
Figure 12: Experimental and calculated break-through curves. T = 30 oC, mads = 7.264 g and C0 = 35.03 mg L-1.
Figure 13: Experimental and calculated break-through curves. T = 30 oC, mads = 7.264 g and C0 = 40.69 mg L-1.
0 200 400 600 800 1000 1200 1400
0.0 0.2 0.4 0.6 0.8 1.0
Cout
/C
0
a
t t
he
out
le
t of c
olum
n
time (min)
Experimental data Model with K
S variable Model with KS constant Thomas model
0 200 400 600 800 1000 1200 1400
0.0 0.2 0.4 0.6 0.8 1.0
Cout
/C
0
a
t t
he
out
le
t of c
olum
n
time (min)
Experimental data Model with KS variable Model with KS constant Thomas model
Figure 14: Experimental and calculated break-through curves. T = 30 oC, mads = 7.264 g and C0 = 46.37 mg L-1.
Figure 15: Experimental and calculated break-through curves. T = 30 oC, mads = 7.264 g and C0 = 52.61 mg L-1.
0 200 400 600 800 1000 1200
0.0 0.2 0.4 0.6 0.8 1.0
Cout
/C
0
a
t t
he
out
le
t of c
olum
n
time (min)
Experimental data Model with KS variable Model with KS constant Thomas model
0 200 400 600 800 1000 1200
0.0 0.2 0.4 0.6 0.8 1.0
Cout
/C
0
a
t t
he
out
le
t of c
olum
n
time (min)
Experimental data Model with K
S variable Model with KS constant Thomas model
Figure 16: Experimental and calculated break-through curves. T = 30 oC, mads = 7.264 g and C0 = 54.86 mg L-1.
Adsorption of the Dye Reactive Blue 5G in Retorted Shale 279
0 100 200 300 400 500 600
0.0 0.2 0.4 0.6 0.8 1.0
Cout /C0
a
t
the
out
le
t o
f c
o
lu
mn
time (min)
Experimental data Model with KS variable Model with KS constant Thomas model
0 100 200 300 400 500 600
0.0 0.2 0.4 0.6 0.8 1.0
Cout /C0
a
t
the
out
le
t o
f c
o
lu
mn
time (min)
Experimental data Model with KS variable Model with KS constant Thomas model
Figure 18: Experimental and calculated break-through curves. T = 30 oC, mads = 7.264 g and C0 = 84.72 mg L-1.
Figure 19: Experimental and calculated break-through curves. T = 30 °C, mads = 7.264 g and C0 = 104.97 mg L-1.
CONCLUSIONS
In this study the adsorption of Reactive Blue 5G on a packed bed was investigated using retorted shale as the adsorbent. The Langmuir isotherm model ade-quately described the experimental equilibrium data. The dye adsorption process was influenced by the volumetric flow rate, as well as by the feed concen-tration. It was concluded that 2 mL/min was the best flow rate as it minimizes the mass transfer resis-tances. An increase in feed concentration decreased the mass transfer resistance because it provided a greater driving force.
Based on the simulation results it can be con-cluded that the double resistance model with at solid mass transfer coefficient that is a function of the local concentration of the dye in the liquid phase best represented the dynamic dye adsorption. In addition, the model appears to be a very useful tool for phe-nomenological studies as well as for process optimi-zation and packed bed design of the system studied herein.
NOMENCLATURE
A fitted parameter of Eq. (15) L mg-1
b Langmuir isotherm parameter L mg-1
C concentration of dye in the bulk
liquid phase
mg L-1
0
C concentration of dye in the feed mg L-1
out
C concentration of dye at the
column outlet
mg L-1
local
C local concentration of the dye
in the liquid phase
mg L-1
*
C concentration of dye in the
liquid phase at equilibrium
mg L-1
L
D axial dispersion coefficient in
the liquid phase
cm2 min-1
m
D molecular diffusivity of the
dye in water
cm2 min-1 p
d particle diameter of the
adsorbent
cm
t
H total bed height cm
a
k adsorption rate constant L mg-1 min-1
d
k Desorption rate constant min-1
F
K volumetric mass transfer
coefficient in the external liquid film
min-1
S
K volumetric mass transfer
coefficient of the adsorbent
min-1
0
S
K volumetric mass transfer
coefficient of the adsorbent
min-1 s
m mass of adsorbent g
q average concentration of the
dye in the adsorbent
mg g-1 b
q amount of dye which has been
removed when the
breakthrough point is reached
mg g-1
max
q maximum adsorption capacity
(Langmuir isotherm parameter)
mg g-1
*
q amount of dye which has been
removed when equilibrium is reached
mg g-1
0
u interstitial velocity cm min-1
t time coordinate min
b
t breakthrough time min
z space coordinate cm
Greek Letters
porosity of the bed
B
density of the bed g L-1
REFERENCES
Ahmad, A. A., Hameed, B. H., Fixed-bed adsorption of reactive azo dye onto granular activated carbon prepared from waste. Journal of Hazardous Mate-rials, v. 175, 298-303 (2010).
Al-Qodah, Z., Adsorption of dyes using shale oil ash. Water Research, v. 17, 4295-4303 (2000).
Al-Qodah, Z., Lafi, W., Adsorption of reactive dyes using shale oil ash in fixed beds. Journal of Water of Supply: Research and Technology-AQUA, v. 52, 189-198 (2003).
Amundson, N. R., A note on the mathematics of adsorption in beds. Journal of Physical and Col-loid Chemistry, v. 52, 1153-1157 (1948).
Batzias, F. A., Sidiras, D. K., Dye adsorption by cal-cium chloride treated beech sawdust in batch and fixed-bed systems. Journal of Hazardous Mate-rials, 114, 167-174 (2004).
Borba, C. E., Guirardello, R., Silva, E. A., Veit, M. T., Tavares, C. R. G., Removal of nickel(II) ions from aqueous solution by biosorption in a fixed bed column: Experimental and theoretical break-through curves. Biochemical Engineering Jour-nal, 30, 184-191 (2006).
Borba, C. E., Silva, E. A., Fagundes-Klen, M. R., Kroumov, A. D., Guirardello, R., Prediction of the copper (II) ions dynamic removal from a me-dium by using mathematical models with analyti-cal solution. Journal of Hazardous Materials, v. 152, 366-372 (2008).
Chuang, C. L., Chiang, P. C., Chang, E. E., Modeling VOCs adsorption onto activated carbon. Chemos-phere, v. 53, 17-27 (2003).
Crank, J., The Mathematics of Diffusion. Clarendon Press, Oxford (1975).
Crini, G., Non-conventional low-cost adsorbents for dye removal: A review. Bioresource Techonol-ogy, v. 97, 1061-1085 (2005).
Danckwerts, P. V., Continuos flow systems: Distri-bution of residence times. Chemical Engineering Science, v. 2, 1-13 (1953).
Dantas, T. L. P., Luna, F. M. T., Silva Jr., I. J., Torres, A. E. B., de Azevedo, D. C. S., Rodrigues, A. E., Moreira, R. F. P. M., Modeling of the fixed-bed adsorption of carbon dioxide and a carbon dioxide-nitrogen mixture on zeolite 13X. Brazilian Journal of Chemical Engineering, v. 28(3), 533-544 (2011). Dizge, N., Aydiner, C., Demirbas, E., Kobya, M.,
Kara, S., Adsorption of reactive dyes from aque-ous solutions by fly ash: Kinetic and equilibrium studies. Journal of Hazardous Materials, v. 150, 737-746 (2008).
Ernest Jr., M. V., Whitely, R. D., Ma, Z., Linda Wang, N. H., Effects of mass action equilibria on fixed-bed multicomponent ion-exchange dynamics. Ind. Eng. Chem. Res., v. 36, 212-226 (1997).
Epolito, W. J., Lee, Y. H., Bottomley, L. A., Pav-lostathis, S. G., Characterization of the textile anthraquinone dye Reactive Blue 4. Dyes and Pigments, v. 67, 35-46, (2005).
Gazola, F. C. Pereira, M. R., Barros, M. A. S. D.,
Silva, E. A., Arroyo, P. A., Removal of Cr3+ in
fixed bed using zeolite NaY. Chemical Engi-neering Journal, v. 117, 253-261 (2006).
Geankoplis, C. J., Transport Process and Unit Op-erations. PTR Prentice Hall, USA (1993).
Gottipati, R., Mishra, S., Application of biowaste (waste generated in biodiesel plant) as an adsorb-ent for the removal of hazardous dye – methylene blue – from aqueous phase. Brazilian Journal of Chemical Engineering, v. 27(2), 357-367 (2010). Glueckauf, E., Coates, J. J., Theory of
chromatogra-phy part IV: The influence of incomplete equilib-rium on the front boundary of chromatograms and on the effectiveness of separation. Journal of American Chemical Society, 1315-1321 (1947). Guaratini, C. C. I., Zanoni, M. V. B., Dye textile.
New Chemical, v. 23, 1-21 (2000).
Jain, R., Sikarwar, S., Adsorptive removal of Eryth-rosine dye onto activated low cost de-oiled mus-tard. Journal of Hazardous Materials, v. 164, 627-633 (2009).
Ko, D. C. K., Porter, J. F., Mckay, G., Film-pore diffusion model for the fixed-bed sorption of copper and cadmium ions onto bone char. Water Research, v. 35, 3876-3886 (2001).
Koprivanac, N., Kusic, H., Vujevi, D., Peternel, I., Locke, B. R., Influence of iron on degradation of organic dyes in corona. Journal of Hazardous Materials,v. 117, 113-119 (2005).
Adsorption of the Dye Reactive Blue 5G in Retorted Shale 281
Lima, R. O. A., Bazo, A. P., Salvadori, D. M. F., Rech, C. M., Oliveiram D. P., Umbuzeiro, G. A., Mutagenic and carcinogenic potential of a textile azo dye processing plant effluent that impacts a drinking water source. Mutation Research, v. 626, 53-60 (2007).
Lin, S. H., Juang, R. S., Wang. Y. H, Adsorption of acid dye from water onto pristine and acid-acti-vated clays in fixed beds. Journal of Hazardous Materials, v. 113, 195-200 (2004).
Mahmoodi, N. M., Hayati, B., Arami, M., Textile
dye removal from single and ternary systems us-ing date stones: Kinetic, isotherm, and thermody-namic studies. Journal of Chemical Engineering
Data, v. 55,4638-4649 (2010b).
Mahmoodi, N. M., Hayati, B., Arami, M., Mazaheri, F., Single and binary system dye removal from colored textile wastewater by a dendrimer as a polymeric nanoarchitecture: Equilibrium and ki-netics. Journal of Chemical Engineering Data, v. 55, 4660-4668 (2010a).
Maliska, C. R., Transferência de Calor e Mecânica dos Fluidos Computacional. Livros Técnicos e Científicos, Editora S. A., Rio de Janeiro (1995). (In Portuguese).
Maurya, N. S., Mittal, A. K., Cornel, P., Rother, E., Biosorption of dyes using dead macro fungi: Ef-fect of dye structure, ionic strength and pH. Bio-resource Technology, v. 97, 512-521 (2006). Miyabe, K., Isogai, R., Estimation of molecular
dif-fusivity in liquid phase systems by the Wilke-Chang equation. Journal of Chromatography A, v. 1218, 6639-6645, 2011.
Nelder, J. A., Mead, A., Simplex method for func-tion minimizafunc-tion. Computer Journal, v. 7, 308-315 (1965).
Ostroski, I. C., Barros, M. A. S. D., Silva, E. A., Dantas, J. H., Arroyo, P. A., Lima, O. C. M., A comparative study for the ion exchange of Fe(III) and Zn(II) on zeolite NaY. Journal of Hazardous
Materials, v. 161, 1404-1412 (2009).
Otero, M., Zabkova, M., Rodrigues, A. E., Com-parative study of adsorption of phenol and sali-cylic acid from aqueous solution onto nonionic polymeric resins. Separation and Purification Technology, v. 45, 86-95 (2005).
Pearce, C. I., Lloyd, J. R., Guthrie, J. T., The re-moval of color from textile wastewater using whole bacterial cells: A review. Dyes Pigments, v. 58, 179-196 (2003).
Petzold, L. R., A description of DASSL: A differen-tial/algebric equation system solver. STR-SAND 82-8637, Livermore (1982).
Rozada F., Calvo, L. F., García, A. I., Martín-Villa-corta, J., Otero, M., Dye adsorption by sewage sludge-based activated carbons in batch and fixed-bed systems. Bioresource Technology, v. 87, 221-230 (2003).
Rozzi, A., Malpei, F., Bonomo, F., L., Bianchi, R., Textile wastewater reuse in northern Italy. Water Science Technology, v. 39, 121-128 (1999). Ruthven, D. M., Principles of Adsorption and
Ad-sorption Process. John Wiley & Sons, New York (1984).
Silva, E. A., Cossich, E. S., Tavares, C. R. G., Cardozo, L., Guirardello, R., Modeling of copper (II)
bio-sorption by marine alga Sargassum sp. in fixed
bed column. Process Biochemistry, v. 38, 791-799 (2002).
Thomas, H. C., Heterogeneous ion exchange in a flowing system. Journal of American Chemical Society, v. 66, 1664-1666 (1944).
Tütem, E., Apak, R., Ünal, Ç. F., Adsorptive re-moval of Chlorophenols from water by bitumi-nous shale. Water Resources, v. 8(32), 2315-2324 (1998).
Valdman, E., Erijman, L., Pessoa, F. L. P., Leite, S. G. F., Continuous biosorption of Cu and Zn by
im-mobilized waste biomass Sargassum sp. Process