In vitro evaluation of force degradation of elastomeric
chains used in Orthodontics
André Weissheimer1, Arno Locks2, Luciane Macedo de Menezes3, Adriano Ferreti Borgatto4, Carla D’Agostini Derech5
How to cite this article: Weissheimer A, Locks A, Menezes LM, Borgatto AF, Derech CA. In vitro evaluation of force degradation of elastomeric
chains used in Orthodontics. Dental Press J Orthod. 2013 Jan-Feb; 18(1):55-62.
Submitted: May 13, 2009 - Revised and accepted: October 2, 2010
» The authors report no commercial, proprietary or inancial interest in the prod-ucts or companies described in this article.
Contact address: Carla D’Agostini Derech
Av. Rio Branco, 333/306 - Centro - CEP: 88.015-201 - Florianópolis/SC – Brazil E-mail: [email protected]
Objective:To analyze the in vitro force degradation of four diferent brands of elastomeric chains: American
Ortho-dontics, Morelli, Ormco and TP Orthodontics. Methods: The sample consisted of 80 gray elastomeric chains that were divided into four groups according to their respective manufacturers. Chain stretching was standardized at 21 mm with initial force release ranging from 300 g to 370 g. The samples were kept in artiicial saliva at a constant tem-perature of 37°C and the degradation force was recorded at the following time intervals: initial, 1, 3, 5, 7 and 9 hours, and 1, 7, 14, 21, 28, and 35 days. Results: There was a statistically signiicant diference between the groups regarding the force degradation, mainly within the irst day, as a force loss of 50-55% was observed during that time in relation to the initial force. The force delivered at 35 days ranged from 122 g to 148 g. Conclusion: All groups showed force degradation over time, regardless of their trademarks, a force loss of 59-69% was observed in the irst hour compared to baseline. However, because the variation in force degradation depends on the trademark, studies such as the present one are important for guiding the clinical use of these materials.
Keywords: Elastomers. Shear bond strength. Biomedical and dental materials.
1 PhD Student in Orthodontics, PUC-RS.
2 Professor of Orthodontics, UFSC.
3 Professor of Orthodontics, PUC-RS.
4 Professor of Statistics, UFSC.
5 Professor of the Specialization Course in Orthodontics, UFSC.
Objetivo:analisar, in vitro, a degradação de força, ao longo do tempo, de elastômeros das marcas comerciais American
Or-thodontics, Morelli, Ormco e TP Orthodontics. Métodos: a amostra constituiu-se de 80 segmentos de elastômeros em cadeia fechada na cor cinza, divididos em quatro grupos, conforme o fabricante. A distensão foi padronizada em 21mm, com liberação de força inicial variando de 300 a 370g de força. As amostras foram mantidas em saliva artiicial em temperatura constante de 37oC, e a força avaliada nos seguintes intervalos: inicial, 1h, 3h, 5h, 7h, 9h, 1 dia, 7 dias, 14 dias, 21 dias, 28 dias
e 35 dias. Resultados: houve diferença estatisticamente signiicativa na degradação de força entre os grupos avaliados, sendo que no primeiro dia houve perda de 50 a 55% em relação à força inicial. Os valores médios de força em 35 dias variaram de 122 a 148g. Conclusão: todas as marcas comerciais apresentaram degradação de força ao longo do tempo, sendo que na primeira hora a perda de força esteve entre 59 e 69% da força inicial. Porém, como existe variação dessa degradação depen-dendo da marca comercial, estudos como esses são importantes para orientação do uso desses elastômeros.
INTRODUCTION
Elastomers are materials that have the ability to quickly return to their original size after substan-tial deformation, acting similarly to the coil spring. They are structurally classified as polymers, i.e., ma-terials which are characterized by the formation of a repeating chain with simpler chemical structure. Since they are thermoplastic, it is possible to create devices with different shapes.5
They are widely used in promoting dental move-ment, correction of rotations, midline discrepancies, space closure, canine distalization and dental arch constriction.1,4,6 The main advantages are: They are
easy to handle, patient cooperation is not required, and they are comfortable, hygienic and economic.4,7
However, the forces released by these materials are unstable and alter due to time, the addition of dyes, chain coniguration (open or closed), pre-stretch, speed and amount of stretch, the oral environment, saliva, enzymes, changes in Ph, exposure to light, air, water, ozone, oxidants, food, chemical hygiene and the physi-cal action of chewing and tooth brushing.8,11,13,15,16,18-22,25
In Orthodontics, synthetic elastomers are poly-mers based on polyurethane, with superior physico-chemical properties than those derived from natural rubber. The derivatives of polyurethane elastomers, after chemical reaction which causes polymerization, present as a shapeless mass, with polymeric chains presenting relatively weak forces of attraction be-tween them. The vulcanization process is then used to improve the mechanical properties of the material through the lateral union between chains by covalent cross-linking. Thus, three-dimensional structures are formed, converting the flexible product into a resis-tant material, elastic, with lower solubility to organic solvents and greater resistance to deterioration by heat, light and natural aging. Another phenomenon responsible for improving the final properties of these materials is assigned to tie points distributed along the polymer formed by linear chains, called cross vir-tual chains.17 These chains are non-covalent chemical
bonds formed within the same molecule or between different molecules. Chemically are referred to as hydrogen bonding and van der Waals forces.10 What
makes this information important is the fact that the power assigned to the material, which is from virtual cross-links, is not obtained by the addition of loads
as in conventional rubber, but chemically determined by the internal composition of materials. This inter-nal composition is determined by the technology, the refinement of the technique and the quality of raw materials used in the manufacture of this material.17
Therefore, the final quality of the elastomer critically depends on the manufacturing process, which makes the conduction of periodic surveys essential to verify the quality and the physical properties behavior of the elastomeric chains available on the market.
Therefore, the objective of this study was to evalu-ate in vitro the magnitude of the force degradation of
different elastomeric chains of four trademarks.
MATERIAL AND METHODS
Eighty gray elastomeric chain segments were eval-uated in the closed configuration, divided into four groups of different brands, each with 20 segments:
» Am Group (Memory chain; ref.: 854-252, American Orthodontics, Sheboygan, WI, USA);
» Mo Group (Short gray Rubber chain, ref.: 60.05.501 - Morelli, Sorocaba, SP, Brazil); » Or Group (Power chain generation II, ref.:
639-0001, Ormco Corporation, Glendora, CA, USA) and
» TP Group (E-chain, ref.: 383-050, TP Ortho-dontics Inc, La Porte, IN, USA).
It was standardized that the elastomeric chain seg-ments were drawn to a distance of 21 mm, producing average initial force of 318.85 g/f. Thus, the required number of links in each elastomeric chains to produce such strength, varied according to the manufacturer (Table 1). However, the stretching of elastomeric seg-ments in the chain did not exceed 50% of its original length because they can generate excessive forces.15
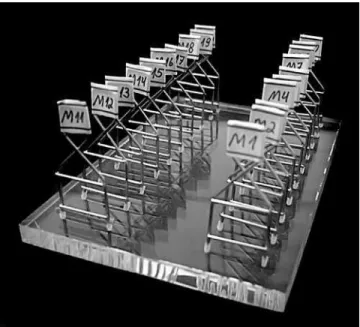
To assess the behavior of the elastomeric chains, a universal mechanical testing machine (Instron Cor-porate - Norwood, MA, USA) was configured to stretch the elastomeric chains with a constant speed of 50 mm / min to the distance of 21 mm. Each seg-ment of the elastomer was pulled to the ends of the machine and stretched to 21 mm. After 15 seconds, the time needed for stabilization of the material, the initial force value was recorded.
Next, the samples were carefully transferred to the maintainer device, which returned to the acrylic plate and immersed in artificial saliva at 37 °C (98.6 °F).
For subsequent measurements, the universal test-ing machine was programmed to maintain ixed at 21 mm the distance between their edges (Fig 2). Next, the elastomers were placed on the device, and the force values were recorded ater 5 seconds.7 Again the
elas-tomeric chains were transferred to the maintainer, and stored under the conditions described above, until the next measurement. Besides the initial measurement, the samples were evaluated at intervals of 1, 3, 5, 7, 9 and 24 hours, and 7, 14, 21, 28 and 35 days.
The 15 seconds waiting to record the initial force was adopted as a result of luctuations in the value of the force ater the initial stretching of the elastomeric chains. Ater that time, the force value remained sta-ble allowing its registration. During the revaluation of elastomeric chains, the time required to stop the force stabilization was 5 seconds.
To assess the diferent behaviors of the elastomeric chain according to the time, we used the Analysis of Variance (ANOVA), according to a completely ran-domized design with factorial arrangement and further tested the normal distribution of data. The F test was
Table 1 - Characterization of sample groups, with the number of links before stretching, original length without stretching (in millimeters), amount of stretching (in millimeters and in percentage), till the extent of 21 mm.
Group Number of links Initial (mm) Stretching (mm/%)
Am 5 14.5 6.5/44.8
Mo 7 17.5 3.5/20.0
Or 5 14.5 6.5/44.8
TP 6 15.5 5.5/35.4
Figure 1 - Maintainer devices, attached to an acrylic plate, with tips ixed at a distance of 21 mm.
used to determine diferences between groups in the time interval. To compare the averages two by two in the analyzed time, the Tukey test was used, comple-mented by the Scott-Knott test, to avoid ambiguity due to the large amount of time in the analysis. For both tests, p ≤ 0.05 was considered statistically signiicant.
RESULTS
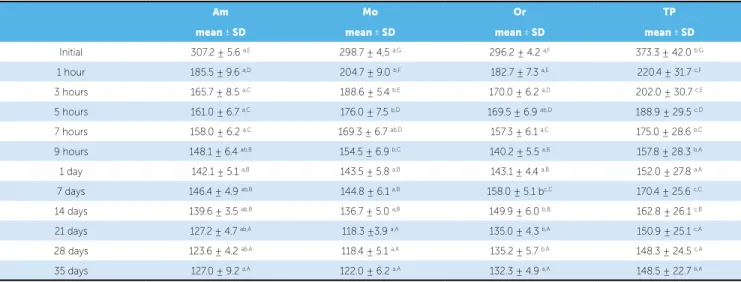
The average values of the forces released by elas-tomeric chain group Am, Mo, Or and TP during the 35 days of the experiment are shown in Table 2. In general, the greater degradation of force occurred during the first day. From that on, the level of force continued to decrease, but slowly and gradually un-til the end of the third week. From the 21st to 35th days, there were no statistically significant changes (p ≤ 0.05) in the force release.
At the end of the experiment, elastomers from the TP Group had the highest average force (148.5 g) it was statistically significant (p ≤ 0.05) when compared to groups Am, Mo and Or. However, it’s noted that the average initial force of the TP Group was also higher than the other groups.
It was noticed that on the first day of evaluation, there was no difference between groups, but this fea-ture did not stand, for example, within one assess-ment week the average force is equal between the groups Am, Mo, Or and differ from the TP group, which is maintained up to 28 days of evaluation.
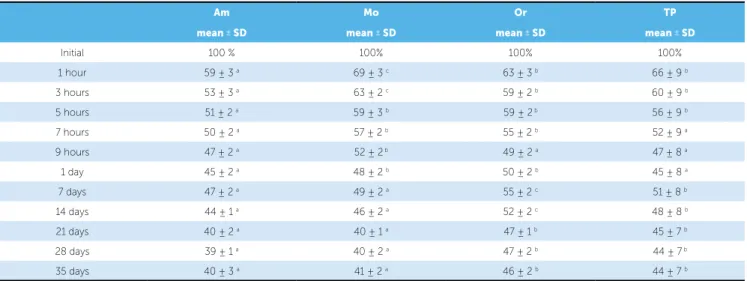
Given the initial force discrepancy of TP Group and to facilitate the understanding, the force degradation was also examined as a percentage of the initial strength in each time interval, irrespective of the initial value of the force in grams (Table 3). Considering that in the begin-ning, the absolute force values amounted to 100%. The data showed that ater 1 h, the percentage of strength re-maining ranged between 59% to 69%, ending up at the end of the irst day with values in the order 45% to 50%. The remaining force found in day 21st was 40-45% de-pending on the group. At the end of the experiment, groups TP and Or had the highest percentage of force remaining, with no diferences between them, while the lowest percentage of initial force were found in groups Mo and Am. There was no statistically signiicant difer-ence between the groups Mo and Am.
DISCUSSION
The specification of the polyurethane used as raw material in the processing of elastomeric chains is not provided by the manufacturer, therefore the physical properties of these materials is only available through published studies.2,4,6,7,11,14,16,20,21,22
The frequency and diversity in the methodology of these studies provides the clinician an important param-eter of quality, perhaps the only one, supplying data to make the best choice in purchasing the product, among the many trademarks, and once that is in clinical use, to know the physical behavior of the material you are using.
Table 2 - Mean (g) and standard deviation of the forces in each time period of four groups tested.
Am Mo Or TP
mean ± SD mean ± SD mean ± SD mean ± SD Initial 307.2 ± 5.6 a,E 298.7 ± 4,5 a,G 296.2 ± 4.2 a,F 373.3 ± 42.0 b,G
1 hour 185.5 ± 9.6 a,D 204.7 ± 9.0 b,F 182.7 ± 7.3 a,E 220.4 ± 31.7 c,F
3 hours 165.7 ± 8.5 a,C 188.6 ± 5.4 b,E 170.0 ± 6.2 a,D 202.0 ± 30.7 c,E
5 hours 161.0 ± 6.7 a,C 176.0 ± 7.5 b,D 169.5 ± 6.9 ab,D 188.9 ± 29.5 c,D
7 hours 158.0 ± 6.2 a,C 169.3 ± 6.7 ab,D 157.3 ± 6.1 a,C 175.0 ± 28.6 b,C
9 hours 148.1 ± 6.4 ab,B 154.5 ± 6.9 b,C 140.2 ± 5.5 a,B 157.8 ± 28.3 b,A
1 day 142.1 ± 5.1 a,B 143.5 ± 5.8 a,B 143.1 ± 4.4 a,B 152.0 ± 27.8 a,A
7 days 146.4 ± 4.9 ab,B 144.8 ± 6.1 a,B 158.0 ± 5.1 bc,C 170.4 ± 25.6 c,C
14 days 139.6 ± 3.5 ab,B 136.7 ± 5.0 a,B 149.9 ± 6.0 b,B 162.8 ± 26.1 c,B
21 days 127.2 ± 4.7 ab,A 118.3 ±3.9 a,A 135.0 ± 4.3 b,A 150.9 ± 25.1 c,A
28 days 123.6 ± 4.2 ab,A 118.4 ± 5.1 a,A 135.2 ± 5.7 b,A 148.3 ± 24.5 c,A
35 days 127.0 ± 9.2 a,A 122.0 ± 6.2 a,A 132.3 ± 4.9 a,A 148.5 ± 22.7 b,A
The optimal force required for space closure in or-thodontics is controversial. Ren et al19 published a
me-ta-analysis study of optimal force for tooth movement and concluded that there is no scientiic evidence as to recommend the optimal force level in orthodontic practice. The few studies in humans suggest that the magnitude of force required for the body movement of the canines ranging from 100 to 350 g for mechan-ics with friction and approximately 60 g mechanical friction-free.19 In the present work an initial force of
approximately 300 g was selected because according to the literature,1,4,14,21,23 during the irst 24 hours the
highest rate of force decay would occur (ranging from 45% to 75%), and thus the remaining force level would be consistent with the movement of the canines.
Commonly, orthodontic consultations occur every 3 or 4 weeks, when the replacement of the elastomeric chain happens. Thus, most studies2,12,21 evaluated the
behavior of these materials for a period of 28 days. However, the return of the patient, in certain cases may be in a larger interval. Therefore, this study evalu-ated the behavior of elastic chains for ive weeks, to complement the data already existing in the literature.
The null hypothesis that the elastomeric ligatures remain dimensionally stable and do not lose strength during the stretch was rejected based on the results of this experiment.
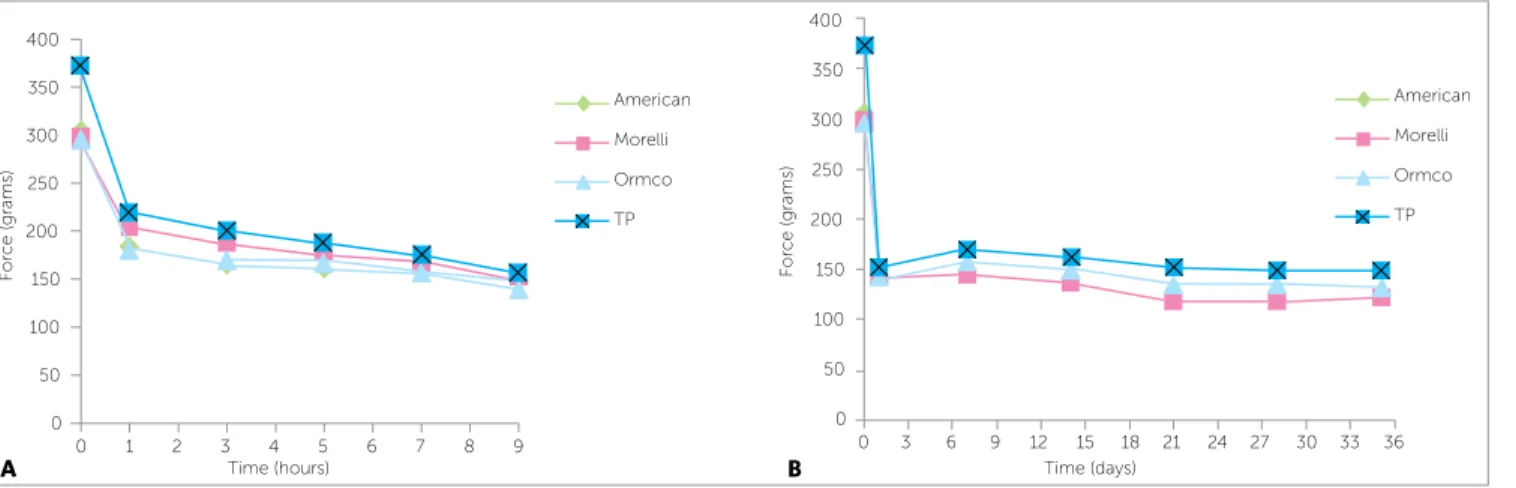
The behavior of the elastomers in groups Am, Mo, Or, and TP during the first 9 hours and 5 weeks of
this experiment can be seen in Figures 3 and 4. All the samples showed a similar degradation curve, vary-ing only in intensity accordvary-ing to the tested group.
The results demonstrated that the highest level of force degradation occurred during the first day of the experiment, especially in the first hour in all groups (Table 3, Figs 3 and 4), which is in agreement with other studies.1,3,9,12,14,23,24
In general, the initial loss of strength during the first hour ranged from 31 to 41%. In the first 24 hours the loss of strength was between 50 and 55% (Table 3, Fig 4). The literature reports similar re-sults with a decrease of strength ranging from 50% to 75% during the first day.1,4,14,21,23 From the first 24
hours on, the level of force continued to decrease, but slowly and gradually until the third week, where it remained almost constant. Because of this, it seems prudent to pre-stretch the elastomeric chains prior to clinical application.
The fact that the TP group has shown the high-est average ultimate force (148 g) probably happened because the group had the greatest force at the be-ginning when compared to other groups. In addition, TP group showed the highest average of the initial forces, differing from the other groups (p ≤ 0.05), and a great variability in the values of these forces at the beginning, which was evidenced by the large stan-dard deviation (42 g) groups when compared to the groups Am (5.6 g), Mo (4.5 g) and Or (4.2 g).
Table 3 - Mean and standard deviation of the percentage of the initial period of time in each of the four groups tested.
In the rows, mean followed by the same letters do not difer signiicantly (p > 0.05) by Scott-Knott test.
Am Mo Or TP
mean ± SD mean ± SD mean ± SD mean ± SD
Initial 100 % 100% 100% 100%
1 hour 59 ± 3 a 69 ± 3 c 63 ± 3 b 66 ± 9 b
3 hours 53 ± 3 a 63 ± 2 c 59 ± 2 b 60 ± 9 b
5 hours 51 ± 2 a 59 ± 3 b 59 ± 2 b 56 ± 9 b
7 hours 50 ± 2 a 57 ± 2 b 55 ± 2 b 52 ± 9 a
9 hours 47 ± 2 a 52 ± 2 b 49 ± 2 a 47 ± 8 a
1 day 45 ± 2 a 48 ± 2 b 50 ± 2 b 45 ± 8 a
7 days 47 ± 2 a 49 ± 2 a 55 ± 2 c 51 ± 8 b
14 days 44 ± 1 a 46 ± 2 a 52 ± 2 c 48 ± 8 b
21 days 40 ± 2 a 40 ± 1 a 47 ± 1 b 45 ± 7 b
28 days 39 ± 1 a 40 ± 2 a 47 ± 2 b 44 ± 7 b
Figure 3 -A) Force degradation in the irst 9 hours. B) Force degradation during 35 days of the experiment.
Figure 4 -A) Percentage of initial force during the irst 9 hours. B) Percentage of the initial force during 35 days of the experiment.
It is important to mention that even using elasto-meric chains with similar characteristics, i.e. num-ber of links, cut by the same operator, stretched the same distance for the same period of time, elastomers from TP Group showed great variability in initial force values (300 g to 434 g). Similar findings were found in another study, where we observed standard deviation of 39.5 g of the initial forces in elastomers from TP Orthodontics.12
Groups Or and TP showed the same amount of force decay in percentage terms, from the beginning to the end of the experiment. Thus, although the Group TP had larger initial and final strength, when compared to Oregon, there was no statistical differ-ence in the amount of force decay in proportion to their initial strength (Table 3).
De Genova et al6 found on the 21st day of the
study, percentages of remaining force of Ormco elas-tomers (39%) and TP Orthodontics (49%) who keep similar to those found in the present work, where the values for the group Or were 47% and Group TP of 45%. However, Jossel et al12 found a higher
percent-age of force remaining on the 28th day (TP 78%, 68% Ormco; American 58%) than those found in this study, possibly because of the methodology used by the authors, the elastomers were maintained in room temperature and not at 37° C, which may have contributed to the decreased strength deterioration.
The results showed that by the end of the experi-ment, groups TP and Or had the highest percent-age of initial force while Mo and Am groups had the lowest. No statistical difference in the percentage of
400 80 80 90 90 100 100 400 350 70 70 350 300 60 60 300 250 50 50 250 200 40 40 200 150 30 30 150 100 20 20
0 1 2 3 4 5 6 7 8 9 0 3 6 9 12 15 18 21 24 27 30 33 36
100
0
0 0
0
0 1 2 3 4 5 6 7 8 9 0 3 6 9 12 15 18 21 24 27 30 33 36
American American American American Morelli Morelli Morelli Morelli Ormco Ormco Ormco Ormco TP TP TP TP A A B B Time (hours)
Time (hours) Time (days)
Time (days) For c e (grams) P er c entage o
f initial f
or c e P er c entage o
f initial f
initial force was demonstrated, between the groups Mo and Am at the end of the evaluation. However, it should be considered that the samples of the Mo Group stretched only 20% of its original length while the Am Group was drawn at 44.8% (Table 1). Ac-cording to the literature,25 the greater the stretching,
the greater the deterioration of the strength. The smallest stretch, and consequently lower plastic de-formation of Mo Group sample compared to the Am Group sample, may have contributed to the similar performance between these groups. Therefore, Mo-relli’s elastomeric chains that stretch above 20% may have further deterioration of strength.
In the study by Araujo and Ursi,2 initial forces were
used ranging from 178 to 249 g whereas in the present work initial forces from 296 to 374 g were used. The use of lower initial forces may have contributed to the authors inding less degradation of strength. However, elastomers creating lower initial forces, although under less degradation, tend to produce lower inal strengths. Ater four weeks the absolute values of force obtained by Araújo and Ursi2 (Morelli 72 g, Ormco 68 g, TP
114g) were lower than those found in this study (Mo-relli 118g, Ormco 135g, TP 148g). Considering that both studies were performed in vitro, where there is less
degradation of force in the oral cavity,3 it is questioned
whether lower forces would be clinically compatible with canine tooth movement.
Measuring the clinically used force of an elasto-mer with a precision instrument is strongly advisable when using any commercial brand. In the case of TP Orthodontics elastomers, the high standard deviation does not disqualify it for clinical use, because the deg-radation of force standard is similar when compared to the other ones tested, but the difference of the ini-tial strength with the same number of links is man-datory for measurement in all its clinical application.
Therefore, since the raw material used and the manufacturing process of the elastomer is not avail-able, it is important to know the theoretical material published in the literature and to measure routinely the applied force.
CONCLUSION
1. Andreasen GF, Bishara S. Comparison of alastik chains to elastics involved with intra-arch molar-to-molar forces. Am J Orthod. 1971;60(2):200-1.
2. Araujo FB, Ursi WJ. Estudo da degradação de força gerada por
elásticos ortodônticos sintéticos. Rev Dental Press Ortod Ortop Facial. 2006;11(6):52-61.
3. Ash JL, Nikolai RJ. Relaxation of orthodontic elastomeric chains and modules in vitro and in vivo. J Dent Res. 1978;57(5-6):685-90. 4. Baty DL, Storie DJ, von Fraunhofer JA. Synthetic elastomeric chains: a
literature review. Am J Orthod Dentofacial Orthop. 1994;105(6):536-42.
5. Billmeyer FW. Textbook of polymer science. 3rd ed. New York: John
Wiley & Sons; 1984.
6. De Genova DC, McInnes-Ledoux P, Weinberg R, Shaye R. Force
degradation of orthodontic elastomeric chains: a product comparison study. Am J Orthod. 1985;87(5):377-84.
7. Eliades T, Eliades G, Silikas N, Watts DC. In vitro degradation of polyurethane orthodontic elastomeric modules. J Oral Rehabil. 2005;32(1):72-7.
8. Ferriter JP, Meyers CE Jr, Lorton L. The efect of hydrogen ion
concentration on the force-degradation rate of orthodontic polyurethane chain elastics. Am J Orthod Dentofacial Orthop. 1990;98(5):404-10.
9. Hershey HG, Reynolds WG. The plastic module as an orthodontic
tooth-moving mechanism. Am J Orthod. 1975;67(5):554-62.
10. Huget EF, Patrick KS, Nunez LJ. Observations on the elastic behavior of a synthetic orthodontic elastomer. J Dent Res. 1990;69(2):496-501. 11. Jefries CL, von Fraunhofer JA. The efects of 2% alkaline glutaraldehyde
solution on the elastic properties of elastomeric chain. Angle Orthod. 1991;61(1):25-30.
12. Josell SD, Leiss JB, Rekow ED. Force degradation in elastomeric chains. Semin Orthod. 1997;3(3):189-97.
13. Kovatch JS, Lautenschlager EP, Apfel DA, Keller JC. Load extension time behavior of orthodontic alastiks. J Dent Res. 1976;55(5):783-6.
REFERENCES
14. Lu TC, Wang WN, Tarng TH, Chen JW. Force decay of elastomeric chain - a serial study. Part II. Am J Orthod Dentofacial Orthop. 1993;104(4):373-7.
15. Matta ENR, Chevitarese O. Avaliação laboratorial da força liberada por elásticos plásticos. Rev SBO. 1997;3(4):131-6.
16. Matta ENR, Chevitarese O. Deformação plástica de elásticos ortodônticos em cadeia: estudo in vitro. Rev SOB. 1998;3(5):188-92.
17. Morton M. Rubber technology. 3rd ed. Londres: Chapman & Hall; 1995. 18. Nattrass C, Ireland AJ, Sherrif M. The efect of environmental factors
on elastomeric chain and nickel titanium coil springs. Eur J Orthod. 1998;20(2):169-76.
19. Ren Y, Maltha JC, Kuijpers-Jagtman AM. Optimum force magnitude for orthodontic tooth movement: a systematic literature review. Angle Orthod. 2003;73(1):86-92.
20. Stevenson JS, Kusy RP. Force application and decay characteristics of untreated and treated polyurethane elastomeric chains. Angle Orthod. 1994;64(6):455-64.
21. Taloumis LJ, Smith TM, Hondrum SO, Lorton L. Force decay and deformation of orthodontic elastomeric ligatures. Am J Orthod Dentofacial Orthop. 1997;111(1):1-11.
22. Teixeira L, Pereira B do R, Bortoly TG, Brancher JA, Tanaka OM, Guariza-Filho O. The environmental inluence of Light Coke, phosphoric acid, and citric acid on elastomeric chains. J Contemp Dent Pract. 2008;9(7):17-24.
23. von Fraunhofer JA, Cofelt MT, Orbell GM. The efects of artiicial saliva and topical luoride treatments on the degradation of the elastic properties of orthodontic chains. Angle Orthod. 1992;62(4):265-74. 24. Wong AK. Orthodontic elastic materials. Angle Orthod. 1976;46(2):196-205. 25. Young J, Sandrik JL. The inluence of preloading on stress relaxation of