ISSN 0104-6632 Printed in Brazil
www.abeq.org.br/bjche
Vol. 33, No. 01, pp. 203 - 214, January - March, 2016 dx.doi.org/10.1590/0104-6632.20160331s20140032
Brazilian Journal
of Chemical
Engineering
NUMERICAL PREDICTION OF BUBBLE SIZE
AND INTERFACIAL AREA CONCENTRATION IN
THE LIQUID BATH OF AN ENTRAINED-FLOW
COAL GASIFIER
Xuan Wu
1,2*, Haiguang Li
1, Lijuan He
2and Wenfei Wu
11
Inner Mongolia Key Laboratory of Integrated Exploitation of Bayan Obo Multi-Metallic Resources, Inner Mongolia University of Science and Technology, Baotou 014010, China.
2School of Energy and Environment, Inner Mongolia University of Science and Technology,
Baotou 014010, China. Phone: + 86-15247250833 E-mail: [email protected]
(Submitted: August 30, 2014 ; Revised: March 8, 2015 ; Accepted: April 28, 2015)
Abstract - A CFD-ABND coupling model was used to study the flow characteristic of gas-liquid two-phase flow in the process of gas passing through the liquid bath of a water-coal-slurry entrained-flow gasifier. In this model, an average bubble number density (ABND) approach was employed and merged with the two-fluid
model. A two-phase version of the RNG k-ε turbulence model was used for the liquid and gas, respectively.
Comparisons of computational results with experimental data are done. The results show that the gas gathers along the outer wall of the cooling pipe and rises. The higher turbulent kinetic energy of gas and liquid, the larger bubble and the higher interfacial area concentration exist mainly near the exit and outer wall of the cooling pipe. The existence of a separator inserter is very helpful to strengthen the turbulence between gas and liquid; this can reduce the bubble diameter and increase the interfacial area effectively.
Keywords:Gasifier; Bubble flow; Numerical simulation; Bubble size; Interfacial area.
INTRODUCTION
Gasification technology of coal occupies a very important position in clean coal technology systems. The gasifier is the core of the entire coal-gasification technology. As shown in Figure 1, the cooling cham-ber of a coal-water-slurry entrained-flow gasifier has improved a lot in structure and it is mainly composed of a cooling ring, cooling pipe, and liquid bath (Jin et al., 2007). In the gasifier, the high temperature gas passes from the gasification chamber to the cooling chamber. In the cooling chamber, there is a process of gas passing through a liquid bath (Zhao et al., 2003). In the world, because of the confidentiality of gasifier patented technology, very little research on
the mechanism of multiphase flow in the entrained-flow gasifier can be found in the literature. Currently, some experts in China are devoted to basic research on large-scale and efficient entrained-flow gasifica-tion technology.
Brazilian Journal of Chemical Engineering
working conditions. However, numerical simulation can play an effective role in discussing its inherent mechanism and make a qualitative or quantitative description. The algebraic stress model has been built to do simulation research on the process of gas going through the liquid bath in the quenching cham-ber of a Texaco gasifier by using eddy diffusion the-ory (Gong et al., 2003). However, the bubble sizes are assumed to be uniform and the bubble breakup and coalescence are ignored in this model, so the bubble size and its distribution characteristics in the liquid bath cannot be given. A simulation research was conducted using VOF model (Xie et al., 2007) to study the gas-liquid flow characteristics and gas with attached-water problems caused by the syn-thetic gas going through the liquid bath in the quenching chamber of the Texaco gasifier. Although the simulation results have shown the macroscopic behavior characteristics of bubbles, it is difficult to make a quantitative description of the characteristics of bubbles by using this model.
Figure 1: Schematic diagram of a coal-water-slurry entrained-flow gasifier
The gas that enters into the liquid in the form of a single bubble or a jet has the possibility to breakup into small bubbles under the influence of turbulent eddy and small bubbles can also coalesce into large bubbles. The bubble breakup and coalescence can change the bubble size, which affects the distribution of the gas void fraction and the interfacial area be-tween gas and liquid. The stability of the equipment and the transfer of momentum, heat and mass be-tween the gas and liquid in the cooling chamber will be significantly affected by the bubble size and the interfacial area. So, the bubble size and the total in-terfacial area are essential parameters for gas-liquid two-phase flow characteristics.
The Multiple Size Group (MUSIG) model is es-tablished based on the group balance theory. The bubbles are divided into different groups according to their different sizes and velocities of bubbles are assumed to be uniform in this model. The bubble breakup and coalescence have been considered in this model, so it can predict the distribution of the bubble size. As a result, it is widely applied (Yeoh et al., 2004; Montante et al., 2008; Song et al., 2008; Yang et al., 2007).But the MUSIG model needs to include the additional equations to solve the bubble size and the change of the bubble number for each group. The additional amount of computational time and resources required may diminish its applicability for practical and engineering usage (Sherman, et al., 2007; 2007; Yeoh, et al., 2006). By comparison, the average bubble number density (ABND) transport equation is established by applying the number den-sity function method based on a bubble population balance model. The ABND model uses an average variable to describe the bubble distribution, such as the bubble number density or interfacial area (Yeoh et al., 2006). Therefore, its calculation cost is lower than the MUSIG model. The ABND model is ideal since the calculation requires that only one equation be solved in this model (Sherman et al., 2007).
Following our previous work (Wu et al., 2009), the main focus in this paper is directed towards ex-ploiting the capability of the ABND model in model-ing the flow characteristics of gas-liquid two-phase flow in the process of gas passing through a liquid bath. A CFD-ABND mathematical model is set up to do the coupling calculation of the two-fluid models and the ABND model. In this model, the bubble breakup and coalescence behavior and the distribu-tions of bubble size and interfacial area are consid-ered to perform quantitative analysis. This study will provide the theoretical foundation revealing the regu-larity of heat and mass transfer between gas and liquid in the liquid bath of the cooling chamber.
MATHEMATICAL MODELS
described by the bubble population balance model. The key features of these models are briefly described as follows.
The establishment of the physical model is based on the cold experimental device of the cooling cham-ber of a gasifier. In this work, the main studies are the characteristics of gas-liquid flow along the height and radial direction in the liquid bath. So the physi-cal model is simplified and becomes a two-dimen-sional axisymmetric physical model as shown in Figure 2. The main geometric dimensions are given in Table 1.
Figure 2: Physical model of the simulation
Table 1: Geometric parameters of the physical model.
Geometry parameters Values
Radius of the chamber R (m) 0.24
Radius of the cooling pipe R′(m) 0.075 Space between grid plates Δh (m) 0.15 Height of the static liquid level H (m) 0.75
Turbulence Two-Fluid Model
The two-fluid model was used to describe the gas-liquid turbulent flow in the process of gas pass-ing through the liquid bath in the coolpass-ing chamber. The q-phase mass conservation equation can be ex-pressed as follows:
q q
q q qi
0i
ρ α u
t x
(1)
The q-phase momentum conservation equation is:
q q qi
q q qi qj
q q q ij i
qi qj qi q effq
j j i
qj q effq
i j
p
ρ α u ρ α u u α ρ α g
t x x
u u
F α μ
x x x
u 2
α μ
3 x x
(2)
The gas and liquid holdup have the following formula:
1
g l
α α (3)
where ρ is the density of the q-phase, α is the phase holdup, ui is the average velocity in the i direction, μeff is the effective viscosity. Fqiis the source of the force between gas and liquid. The subscripts g, l are gas phase and liquid phase respectively. During the simulation process, we used the RNG k-ε turbulence model to solve the turbulence equation of each phase to describe the two-phase turbulent flow.
q q q
q q q qi
iq
q k effq q k q q q
j j
k ρ α k u
t x
k
α a μ α G α ρ ε
x x
(4)
q q q
q q q qi
i
2
q q q
q effq 1ε q k 2ε q q
j j q q
ρ α u
t x
ε ε
α a μ C α G C α ρ
x x k k
(5)
where Gk is the turbulent kinetic energy caused by the average velocity gradient. ak and aεare inverse
effective turbulent Prandtl numbers for k and ε re-spectively.
2
C is given by
3
μ 0
2 2ε 3
C ρη 1 η/η
C C
1 βη
(6)
where η0=4.38, β=0.012, C1ε=1.42, C2ε=1.68.
The Momentum exchange between the two-phases can be shown as the following:
( D L M)
lg gl gl gl gl
Brazilian Journal of Chemical Engineering
The momentum exchange caused by drag force can be expressed as the following (Krishna et al., 2003):
3
( )
4
g L D
gl D g l g l
g
F C u u u u
d
(8)
where CD is the coefficient of interphase drag force. Based on the Schiller-Naumann model, CDit can be expressed as the following,
2
4 1
3
l g D
l g l
C gd
u u
(9)
When the bubbles rise rapidly in the liquid, there must be a larger velocity gradient in the liquid flow field, which makes the pressure along the direction of velocity gradient of the bubbles' two sides differ-ent. Thereby, the lift force is vertical to the direction of the relative velocity of bubbles and liquid flow fields are generated by the bubbles. The lift force of the bubbles can be expressed in terms of the slip velocity of the two phases and the curl of the liquid phase velocity as (Deen, et al., 2001).
( ) ( )
L
gl L l g l l g l
F C u u u (10)
where CL is the coefficient of lift force. According to Drew et al. (1987),we obtain the following equation,
(1.0 2.78[0.2, ])
L Lo g
C C (11)
where CLo = 0.5 and [ ] is defined as the minimum value.
The virtual mass force of the bubble can be ex-pressed by the following equation (Krishna et al., 2003).
( g )
M l
gl VM l g l
du du
F C
dt dt
(12)
where CVM is the coefficient of the virtual mass force. In this work, CVM=0.5, according to Buwa's recommendation (Buwa et al., 2002).
The Average Bubble Number Density (ABND) Transport Equation
In multiphase systems, the bubble population bal-ance model is the common method used to describe
the bubble size distribution and its behavior, such as breakup and coalescence (Ramkrishna, et al., 2002). We can use this model to do the simulated calcula-tion for the bubble size distribucalcula-tion in the gas-liquid system and to investigate systematically the effects that bubble breakup and coalescence make on bubble size distribution. The average bubble number density transport equation can be expressed as the following equation (Fleischer, et al., 1996).
( , , )
( g ( , , )) ( , , )
n V x t
u n V x t G V x t t
(13)
where n V,x,t
is the average bubble number den-sity, which describes the distribution of bubble num-ber in attribute space V, position spacexand time space t. G V,x,t
is the source term of bubble inter-action, which is defined as:
CO BR PHn n n
G V,x,t (14)
where nCO is the change of bubble number density
due to bubble coalescence. nBR is the change of bub-ble number density due to bubbub-ble breakup. nPH is the change of bubble number density due to phase change. In this work, phase change is ignored according to the assumptions above.
The Interfacial Area Concentration (IAC) Trans-port Equation
Suppose that the bubble size is described by the bubble Sauter diameter.
6 g
s gl
a d
A
(15)
where, since the bubble shape is not a regular sphere, the shape factor of the bubble a is introduced; and a=0.8 according to Wang et al. (2001).
Bubble number density can be defined as:
3
3 3 2
1 ( , , )
36 / 6
g gl
s g
A n V x t
d a
(16)
2 2
3
36 3
gl gl g
g gl g g
g
g CO BR
gl
A A α
u A u α
t α t
α π
A
(17)
where the interfacial area concentration (IAC) is an important parameter of the internal geometric struc-ture of gas-liquid flow. This parameter can also char-acterize the effective area of mass, momentum and energy transfer between gas and liquid (Takashi, et al., 2001; Takashi, et al., 2006). This shows that the bubble number density transport equation and gas-liquid interfacial area concentration transport equa-tion are interrelated. We can calculate the local inter-facial area concentration between gas and liquid according to the local gas void fraction and the bub-ble size. A model is used to describe the behavior of bubble breakup and coalescence in the bubble num-ber density transport equation (Wei et al., 2004).
The Bubble Coalescence Model
For the isothermal gas-liquid flow, the bubble coa-lescence is caused by the random collision between bubbles due to liquid turbulent flow (Yeoh et al., 2006).The collision between bubbles occurs because the instantaneous velocities of bubbles are different, and some of them will coalesce. Collision frequency and coalescence efficiency between bubbles decide their disappearance velocity. So, the bubble coales-cence model can be described by the following equa-tion (Wei et al., 2004).
1/3 22 1 11/3
3
exp co cr
g CO
co
g co g cr
C We / We
ε α
C
g α C α We / We
d
(18)
where the Critical Weber number Wecr=1.24, and the coefficients are Cco1=2.86, Cco2 =1.922 and Cco3=1.017.
The number We is given by
2/3l s s
2ρ εd d
We
σ
(19)
The Bubble Breakup Model
When describing the bubble breakup process, we need to show the given bubble breakup rate and bub-ble size distribution at the same time. The bubbub-ble breakup mechanisms include several different kinds, such as turbulent vortex-body collision, liquid flow
field shear and large bubble surface instability. In the general gas-liquid system, the main bubble breakup mechanism is caused by turbulent vortex-body colli-sion. So the bubble breakup model can be expressed by the following equation (Wei et al., 2004).
1/3
1 11/3
2 1
exp
1 1
g g
BR br
cr
br g cr
ε
C
d
We We
C α We / We
(20)
where the coefficients Cbr1 and Cbr2 are equal to 1.6
and 0.42, respectively. The value of the critical We-ber numWe-ber is the same as above.
NUMERICAL PROCEDURE
Brazilian Journal of Chemical Engineering
distributed structuring grid system was used. The uniform mesh enhanced stability and precision of results in numerical simulation. In order to check whether the grid size had an effect on the simulation result, we chose three different uniform grid systems for the 2D model, namely 30×100, 48×125 and 60×135, to do the tentative calculation. Figure 3 shows the simulation results of the radial distribution of local average gas void fraction at 0.7 m height of the liquid bath under 0.2 m/s superficial gas velocity in the liquid bath. After comparing the calculation results, we found that the calculation results of the latter two grids are very similar.
1.0 1.5 2.0 2.5 3.0
0.2 0.4 0.6 0.8 1.0
u
g=0.2m/s y=0.3m
r/R'
g
as vo
id
fracti
o
n
30×100
48×125
60×135
Figure 3: Effect of grids on the radial distribution of the gas void fraction.
This confirms that the numerical solution did not
depend on the characteristics of the mesh size. Therefore, we chose the grid of size 60×135 in the following analysis and calculation.
EXPERIMENTAL DETAILS
It is necessary to verify the models and computa-tional schemes by comparison of the model predic-tions with the experimental data. Figure 4 schema-tizes the laboratory scale cooling chamber of coal-water-slurry entrained-flow gasifier (He, 2005; Wu, 2007). The cooling chamber is made of organic glass. The air-water two-phase system is used in the experiment. The double conductivity probes are used in the determination of the local gas void fraction, the local bubble size and the interfacial area concen-tration. The method of average Sauter diameter is used to determine the local bubble size with the dou-ble conductivity probes. The interfacial area concen-tration can be obtained by using the frequency of bubbles, the velocity of bubbles and the velocity fluctuation of bubbles, which are determined by the double conductivity probes. A grid plate is used as the separator inserter in the current experiments. The diameter of the grid plate is 0.48 m. The average pore size of the grid plate is 0.05 m. According to experiment, three grid plates are arranged in the liquid bath. The space between grid plates is Δh =0.15 m. The comparisons of the model predictions with the experimental data are giving in the following.
1. roots blower
2. valve
3. gas flowmeter
4. air inlet
5. air outlet
6. water inlet
7. water flowmeter
8. valve
9. water pump
10. flume
11. liquid bath
12. air outlet
13. cooling pipe
14. liquid level
15. parallel conductance
probe
16. A/D conversion module
17. acquisition card
18. computer
RESULTS AND DISCUSSION
Initially, the flow characteristic of gas-liquid flow in the liquid bath without the grid plates was studied. The distribution of the average bubble Sauter diame-ter and the indiame-terfacial area concentration in the liquid bath are shown in Figure 5. Maximal bubbles and interfacial area concentration appear near the outer wall of the cooling pipe. But the bubble diameter and the interfacial area concentration is quite low in the region away from the cooling pipe. Small bubbles appeared near the liquid level surface due to liquid recirculation.
(a) average Sauter diameter (m)
(b) interfacial area concentration (m-1) Figure 5: Nephogram of bubble diameter and IAC in the liquid bath without grid plates. (H=0.75 m, ug=0.5 m/s, ρg=1.225 kg/m3, ρl=998.2 kg/m3, t=12 s)
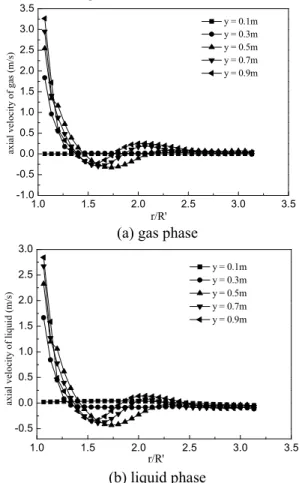
Figure 6 shows the distribution of the average ve-locity of the gas and liquid phases at different cross-sections along the y-direction. The gas velocity is greater than the liquid velocity due to the buoyancy force caused by the density difference. The gas ve-locity is higher near the cooling pipe than the veloci-ties in other regions of the liquid bath. In the liquid region below the exit of the cooling pipe, at y=0.1 m height, the gas velocity is almost zero. Due to the gas rising mainly along the outer wall of the cooling pipe, the gas holdup and the buoyant force action are very large in this region, and the gas has a larger rising velocity near the outer wall of the cooling pipe. The rising velocity of the gas decreases gradu-ally along the radial direction of the liquid bath. From the maximum axial velocity of different cross-sections we find that the gas velocity is accelerating all the time as a function of the buoyant force. Be-cause the viscous resistance will increase with the
increase of the gas velocity, the increase of the gas rising velocity will continue to slow down. At the height of 0.3 m, occurs the fluctuation of the numeri-cal value of the y-direction velocity of gas changes from positive to negative and then from negative to positive. This phenomenon verifies the occurrence of a circulating flow of gas at this height. The liquid is in a stationary state before the gas flows into the liquid bath along the cooling pipe. During the proc-ess of gas passing through the liquid bath, the liquid changes from quiet to flow because of the action of the force of the gas. At the same time, liquid will react to the gas. Under the interaction between gas and liquid, the velocity change of the two-phases is basically consistent. The main differences between gas-liquid velocities are generated in the region un-der the exit of the cooling pipe. Besides, the axial liquid velocity fluctuates from positive to negative periodically. It shows that the liquid generates a large reflux in this region.
1.0 1.5 2.0 2.5 3.0 3.5
-1.0 -0.5 0.0 0.5 1.0 1.5 2.0 2.5 3.0 3.5
ax
ial v
el
o
cit
y
o
f g
as (m/s)
r/R'
y = 0.1m y = 0.3m y = 0.5m y = 0.7m y = 0.9m
(a) gas phase
1.0 1.5 2.0 2.5 3.0 3.5
-0.5 0.0 0.5 1.0 1.5 2.0 2.5 3.0
axia
l v
elo
city o
f l
iq
u
id
(
m
/s
)
r/R'
y = 0.1m y = 0.3m y = 0.5m y = 0.7m y = 0.9m
(b) liquid phase
Figure 6: Average axial velocity of gas or liquid at different heights of the chamber.
Brazilian Journal of Chemical Engineering
cooling pipe. The liquid turbulence kinetic energy reaches the maximum of the cross section near the outer wall of the cooling pipe. When the gas flows out and rises along the outer wall of the cooling pipe, under the action of inertial force and viscous force, the gas that gathers near the outer wall of the cooling pipe and the liquid will have intense shear, blending and momentum exchange at the gas-liquid boundary, so that the maximum turbulent kinetic energy is generated here. At the height of y=0.3 m, gas flows out from the cooling pipe and rises. Gas velocity changes strongly in both magnitude and direction here, so higher turbulence kinetic energy is generated. At the bottom of the liquid bath, namely the region under the exit of the cooling pipe, the gas distur-bance acts weakly on the liquid, so the turbulence kinetic energy here is lower.
1.0 1.5 2.0 2.5 3.0 3.5
0.0 0.2 0.4 0.6 0.8 1.0 1.2 1.4 1.6 1.8 2.0 2.2
y = 0.1m y = 0.2m y = 0.3m y = 0.5m y = 0.7m
av
er
ag
e tu
rb
u
len
ce k
in
etic en
er
g
y
o
f
liq
u
id
(
m
2/s 2)
r/R'
Figure 7: Average turbulence kinetic energy of the liquid in the different heights of the chamber.
Figure 8 shows the radical distribution of gas void fraction under different working pressures.
The pressure has a significant influence on the gas void fraction. When P=0.1 Mpa, the gas mainly gathers near the outer wall of the cooling pipe. How-ever, the number of small bubbles in the liquid bath increases with increasing pressure. It could result in the increase of the gas void fraction in the liquid bath. When the pressure is higher, the distribution of gas void fraction tends to be uniform in the liquid bath due to the diffusion of small bubbles.
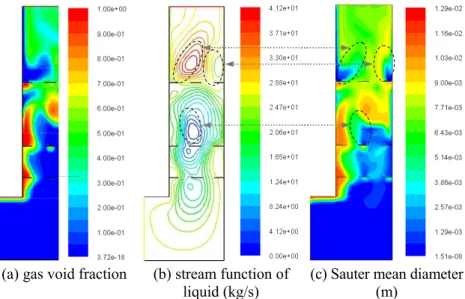
Figure 9 shows the nephogram of the gas void fraction, the stream function of liquid and the bubble diameter in the liquid bath with grid plates at different times. The existences of the grid plates strengthens the turbulence between gas and liquid, making the liquid generate refluxes at each layer between the
1.0 1.2 1.4 1.6 1.8 2.0 2.2 2.4 2.6 2.8 3.0
0.0 0.2 0.4 0.6 0.8 1.0
ug=0.7m/s y=0.45m
gas
void
fr
act
ion
r/R'
P = 0.1Mpa P = 1Mpa P = 3Mpa P = 6Mpa
Figure 8: Radical distribution of the gas void frac-tion under different working pressures.
(a) gas void fraction (b) stream function of liquid (kg/s)
(c) Sauter mean diameter (m)
Figure 9: Gas-liquid flow characteristics in the liquid bath with grid plates. (H=0.75 m, ug=0.5 m/s, ρg=1.225 kg/m
3
,ρl=998.2 kg/m
3
grid plates. The reflux enhances the turbulence inten-sity between gas and liquid. The presence of vortex exacerbates the degree of bubble breakup, and gener-ates some small bubbles. Besides, the velocities of gas and liquid are lower because of the resistance of the separators at the region near the outer wall of cooling chamber, so bubbles stagnate and coalesce gradually. At this time, the bubble coalescence plays a leading role, causing the increase of bubble size in this region. But, with the disturbance action of the grid plates, large bubbles break into small bubbles, which promote the diffusion of bubbles in the liquid bath.
Figure 10 shows the change curve of local aver-age gas void fraction αg, local average bubble diame-ter db and local average interfacial area concentration Aif with the changes of superficial gas velocity under the conditions such that y=0.34 m, r/R′=2, and the static liquid level of the liquid bath is H=0.75 m. With the increase of the superficial gas velocity, the gas void fraction increases and tends to level off gradually. The average bubble diameter increases gradually with increasing superficial gas velocity. But the change of bubble diameter tends to level off after the gas velocity increases to 0.6 m/s. In the
liquid bath, bubbles move more intensely with the increase of superficial gas velocity and the probabil-ity of bubble collision and coalescence rises, making the bubble diameter increase. However, because the turbulence between gas and liquid enhances with increasing superficial gas velocity, the vortices pro-mote bubble breakup at the same time. So, the change of average bubble diameter first increases then tends to level off gradually with the increase of superficial gas velocity. The local average interfacial area concentration in the liquid bath increases with the increase of superficial gas velocity because the increase of gas velocity enhances the turbulence and blending between gas and liquid. When the interfa-cial area concentration between gas and liquid in-creases to a certain value, this increase of interfacial area concentration tends to level off, which means that the bubble diffusion is nearing saturation in the liquid bath. The gas void fraction, the bubble diame-ter and the indiame-terfacial area concentration have the same changing trend with the increase of gas velocity. The tendency of simulated results is in good agree-ment with the experiagree-ments. The established models are proved to be reasonable.
0.1 0.2 0.3 0.4 0.5 0.6 0.7
0.00 0.05 0.10 0.15 0.20 0.25 0.30 0.35 0.40 0.45
lo
ca
l av
er
ag
e ga
s v
o
id
fr
ac
ti
o
n
superficial gas velocity(m/s)
experiment (Wu, 2007) simulation
0.1 0.2 0.3 0.4 0.5 0.6 0.7
4 5 6 7 8 9 10
lo
ca
l av
er
ag
e bu
b
b
le
di
am
et
er
(m
m
)
superficial gas velocity (m/s)
experiment (Wu, 2007) simulation
(a) gas void fraction αg (b) bubble Sauter diameter db
0.1 0.2 0.3 0.4 0.5 0.6 0.7
50 100 150 200 250 300
local average
interf
acial area
con
centration
(
m
-1)
superficial gas velocity (m/s)
experiment (Wu, 2007) simulation
(c) interfacial area concentration Aif
Brazilian Journal of Chemical Engineering
The radial distribution of the local average bubble diameter in the liquid bath is shown in Figure 11. We measured it under the condition that the static liquid level in the liquid bath is H=0.75 m, the superficial gas velocity is ug=0.5 m/s and the measuring height is y=0.34 m. Large bubbles mainly gathered near the outer wall of the cooling pipe, which is related to the distribution of gas void fraction. The average bubble diameter in the liquid bath becomes gradually smaller along the radial direction. Large bubbles are mainly concentrated near the outer wall of the cool-ing pipe. The existence of the grid plates is very help-ful to strengthen the turbulence between gas and liquid. The grid plates can reduce the bubble size near the outer wall of the cooling pipe and increase diffusion of bubbles in the liquid bath effectively. In addition, comparing the numerical simulation results and the experimental data, we can find that they show a consistent variation tendency in general.
1.0 1.5 2.0 2.5 3.0
0 2 4 6 8 10 12
lo
ca
l av
er
ag
e b
u
b
b
le d
iam
et
er
(mm)
r/R'
simulation results without grid plates simulation results with grid plates experimental results by Wu, 2007
Figure 11: Radial distribution of the local average bubble diameter in the liquid bath.
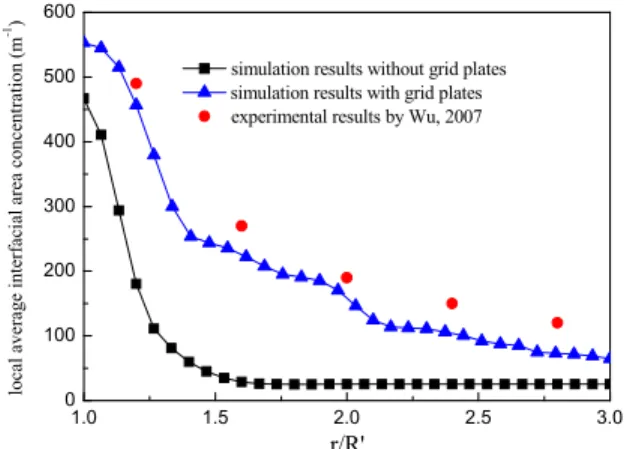
Figure 12 shows the radial direction distribution of the local average interfacial area concentration between gas and liquid in the liquid bath. The com-putational conditions are as follows: the static liquid level in the liquid bath is H=0.75 m, the gas velocity is ug=0.5 m/s and the measuring height is y=0.34 m. The highest interfacial area concentration appears near the outer wall of the cooling pipe, and then it reduces gradually and tends to level off along the radial direction. The interfacial area concentration can be used to characterize the effective size of mass, momentum and energy transfer between gas and liquid. The higher interfacial area concentration makes the turbulence between gas and liquid be-come more intense. The grid plates can effectively increase the interfacial area concentration in the liquid bath due to more intense turbulence between gas and liquid.
1.0 1.5 2.0 2.5 3.0 0
100 200 300 400 500 600
lo
cal av
er
ag
e in
ter
fac
ia
l ar
ea co
n
ce
n
tr
atio
n
(m
-1)
r/R'
simulation results without grid plates simulation results with grid plates
experimental results by Wu, 2007
Figure 12: Radial distribution of the local interfacial area concentration in the liquid bath.
CONCLUSIONS
(1)The simulation results agree well with the ex-perimental results. It shows that the present CFD-ABND model has a better performance for predict-ing the distribution of bubble size and interfacial area concentration in the liquid bath of the cooling cham-ber of a water-coal-slurry entrained-flow gasifier.
(2)The existence of the grid plates is very helpful to strengthen the turbulence between gas and liquid. This can reduce the bubble diameter and increase the interfacial area concentration effectively.
(3)The average local gas void fraction, the local average bubble diameter and the local average inter-facial area concentration initially have an increasing tendency and then tend to level off gradually along the radical direction of the liquid bath with the in-crease of superficial gas velocity. They have the same variation tendency.
(4)The bubbles with larger diameter in the liquid bath are generated in the region near the outer wall of the cooling pipe. Bubble size reduces gradually and then tends to level off along the radial direction. The higher interfacial area concentration also ap-pears near the outer wall of the cooling pipe, reduces gradually and then tends to level off along the radial direction.
NOMENCLATURE
Aif interfacial area concentration (m-1)
ak inverse effective turbulent Prandtl number for k
aε inverse effective turbulent Prandtl number for ε
d average bubble Sauter diameter (m) Fgl interphase force between gas and liquid (N) Gk turbulent kinetic energy caused by the
average velocity gradient (m2 · s-2) k turbulence kinetic energy (m2 · s-2) n bubble number density (m-3)
ug superficial gas velocity in the liquid bath (m·s-1)
R Radius of the chamber (m) R′ Radius of the cooling pipe (m)
Greek Letters
α volume fraction of gas or liquid ε turbulent dispersion rate (m2 · s-3) ρ density of gas or liquid (kg · m-3)
Superscripts
D drag force (N)
L lift force (N)
M virtual mass force (N)
Subscripts
g gas phase
l liquid phase
,
i j spatial coordinate indices
ACKNOWLEDGEMENTS
This research is supported by the National Natural Science Foundation of China (51166010), Inner Mon-golia Natural Science Foundation (2014MS0530).
REFERENCES
Buwa, V. V. and Ranade, V. V., Dynamics of gas-liquid flow in a rectangular bubble column: Experiments and single/group CFD simulations. Chemical Engi-neering Science, 57, 4715-4736 (2002).
Chen, Y. X., Wang, Y. F., Liang, T., Yao, Y. C., Liu, X. and Yu, Z. H., Characteristics of phase dis-tribution of gas-liquid two-phase flow in new
scrubbing-cooling chamber. Journal of Chemical Industry and Engineering, 59, 323-327 (2008). Deen, N. G., Solberg, T. and Hjertager, H. B., Large
eddy simulation of the gas-liquid flow in a square cross-sectioned bubble column. Chemical Engi-neering Science, 56, 6341-6349 (2001).
Drew, D. A. and Lahey, R. T., The virtual mass and lift force on a sphere in rotating and straining in viscid flow. Int. J. Multiphase Flow, 13, 113-121 (1987).
Fleischer, C., Becker, S. and Eigenberger, G., De-tailed modeling of the chemisorption of CO2 into
NaOH in a bubble column. Chemical Engineering Science, 51, 1715-1724 (1996).
Gong, X. B., Gu, Z. L., Lin, G. P., Feng, X., Yu, Y. Z. and Lin, Z. H., Numerical simulation of gas-liquid two-phase flow with reverse buoyancy in quench chamber of coal gasifier and its application. Jour-nal of Chemical Industry and Engineering, 54, 930-935 (2003).
He, B. Y., Study on multiphase flow characteristics of the new type of scrubbing-cooling chamber. Ph.D. Thesis, East China University of Science & Technology, 55-58 (2005).
Jin, G., Wang, Y. F. and Lu, W. X., Application of new structure of scrubbing cooler Chamber. Large Scale Nitrogenous Fertilizer Industry, 30, 358-360 (2007).
Krishna, R. and Baten, J. M., Mass transfer in bubble columns. Catalysis Today, 79, 67-75 (2003). Montante, G., Horn, D. and Paglianti, A., Gas-liquid
flow and bubble size distribution in stirred tanks. Chemical Engineering Science, 63, 2107-2118 (2008).
Ramkrishna, D. and Mahoney, A. W., Population balance modeling: Promise for the future. Chemi-cal Engineering Science, 57, 595-606 (2002). Sherman, C. P., Yeoh, G. H. and Tu, J. Y., On the
modeling of population balance in isothermal ver-tical bubbly flows-Average bubble number density approach. Chemical Engineering and Processing, 46, 742-756 (2007).
Sherman, C. P., Yeoh, G. H. and Tu, J. Y., On the numerical study of isothermal vertical bubbly flow using two population balance approaches. Chemi-cal Engineering Science, 62, 4659-4674 (2007). Song, Q. T., Jin, J. Q., Wu, G. Y., Lu, J. J. and Zhang,
K., Experiment and CFD simulation of bubble size distribution in 2D gas-liquid bubble column. Journal of Chemical Industry and Engineering, 59, 335-340 (2008).
Interna-Brazilian Journal of Chemical Engineering
tional Journal of Heat and Mass Transfer, 44, 1869-1888 (2001).
Takashi, H., Tao, H. L. and Jae, Y. L., Interfacial area concentration in boiling bubbly flow systems. Chemical Engineering Science, 61, 7979-7990 (2006).
Wang, T. F., Wang, J. F. and Yang, W. G., Bubble behavior in gas-liquid-solid three-phase circulat-ing fluidized beds. Chemical Engineercirculat-ing Journal, 84, 397-404 (2001).
Wei, Y., Christophe, M., Volumetric interfacial area prediction in upward bubbly two-phase flow. In-ternational Journal of Heat and Mass Transfer, 47, 307-328 (2004).
Wu, H. T., Study on vibration of scrubbing-cooling tube & gas-liquid flow property in scrubbing-cooling chamber of coal-water slurry gasifier. Ph.D. Thesis, East China University of Science & Technology, 45-48 (2007).
Wu, Q., Kim, S. and Ishii, M., One-group interfacial area transport in vertical bubbly flow. International Journal of Heat and Mass Transfer, 41, 1103-1112 (1998).
Wu, X., Li, T., Cai, J., Peng, Z. B. and Yuan, Z. L., Numerical prediction of particle number concen-tration distribution in scrubbing-cooling chamber
of entrained-flow coal gasifier. Chemical Engi-neering Journal, 149, 325-333 (2009).
Xie, H. Y. and Yuan, Z. L., Flowing characteristics and problem of entraining water about mixed gas crossing the cistern in quench chamber. Proceed-ings of the CSEE, 27, 37-41 (2007).
Xu, J., Study of flow, mass and heat transfer in quench chamber. Ph.D. Thesis, East China Uni-versity of Science & Technology, 41-45 (2005). Yang, L. X., Ba, L. M. and Li, X., The application
and comparison between two kind of gas-liquid numerical models. Journal of Engineering Ther-mophysics, 28, 93-96 (2007).
Yeoh, G. H. and Tu, J. Y., Population balance model-ing for bubbly flows with heat and mass transfer. Chemical Engineering Science, 59, 3125-3139 (2004).
Yeoh, G. H. and Tu, J. Y., Numerical modeling of bubbly flows with and without heat and mass transfer. Applied Mathematical Modeling, 30, 1067-1095 (2006).