AR
T
CILE
1 Faculdade de Odontologia de Piracicaba, Universidade Estadual de Campinas. Av. Limeira 901, Areião. 13414-018 Piracicaba SP Brasil. [email protected] 2 Faculdade de Saúde Pública, Universidade de São Paulo. São Paulo SP Brasil.
3 Departamento de Odontologia, Universidade Federal de Sergipe. Lagarto SE Brasil.
Analysis of the Unified Health System funding and expenditure
in the municipalities of the “Rota dos Bandeirantes” health
re-gion, State of São Paulo, Brazil
Abstract The national scenario of lack of resourc-es in the Brazilian Unified Health System (SUS) has led to major differences in the municipalities funding models. Thus, this study aims to analyze SUS funding and expenditure in seven cities of the Rota dos Bandeirantes health region, State of São Paulo, SP, Brazil, from 2009 to 2012. Settled ex-penditure indicators were collected from the Public Health Budgets Information System (SIOPS) for analysis, showing descriptive data with absolute and relative frequency calculations. We identified that the per capita income available for the city of Barueri is almost tenfold that of the city of Cara-picuíba, and that Barueri’s health expenditure per capita is more than double that of the regional av-erage and almost fivefold that of Carapicuíba. The Federal Government is responsible for 95.4% of all funding to municipalities. Most of the available income of the municipalities in the region include their own taxes and state transfers. All the munic-ipalities showed a significant positive trend, both for available income and health expenditure. The regional average of own revenue spent on health is 27.3%. Carapicuíba achieved a level of 37.5%, which is much higher than the minimum of 15% required by the Federal Constitution.
Key words Health care funding, Health expendi-ture, Unified Health System
João Alves dos Santos Neto 1
Áquilas Nogueira Mendes 2
Antônio Carlos Pereira 1
Sant
os N Introduction
Since the Health Reform implemented in Brazil in the midst of the 1970s and 1980s economic and political crisis, idealizers of this movement
were already faced with a funding dilemma1,2. The
Health Reform movement resulted in the estab-lishment of the Unified Health System (SUS) by the 1988 Federal Constitution and, twenty-eight
years later, its funding remains unclear1-10.
We can say that most of the structural prob-lems that plague the SUS today are related to
funding5,7,8,11,12. It is so hard to find an ideal way
to fund the health system and, in the 1990s and 2000s, this was one of the most debated and prob-lematic issues in the implementation of the SUS, and, recently, has appeared in the research agen-das with almost the same frequency as healthcare
model studies1,5,8,11.
While it is recognized that there are expendi-ture management issues, it is clear that the sys-tem that is intended to be “universal” and “com-prehensive” is operating with funding far below
the required level2,5. This situation has directly
hampered SUS municipal managers’ priority of a primary health care (PHC) policy for the imple-mentation of a new Brazilian health care model.
This policy was especially developed in the 1990s, when great efforts were made to univer-salize PHC, and this process developed over the 2000s. In 2011, the National Council of Munic-ipal Health Secretariats (CONASEMS) strength-ened its advocacy for the qualification of PHC in this system, so that it could coordinate
compre-hensive health care and develop care networks13.
However, the implementation of this guideline has faced hurdles through SUS problematic funding. The sizeable difference in the municipal collection power and the availability of resourc-es for health, combined with other factors, have made municipal public health systems totally
heterogeneous1,7,14, producing equally
hetero-geneous health regions15. Thanks to health
mu-nicipalization and decentralization, followed by the late, and still not effective effort to strengthen
health regions14,16-20, we live today a reality where
the municipality is considered the basic
organi-zational core of the system16. This situation
pro-duced a segmentation of the health system into national subsystems, a factor that influences the fragmentation of the SUS in the name of
munic-ipal autonomy16,19,20. SUS fragmentation has
gen-erated local inequities15-17 that are evident when
analyzing SUS funding and expenditure in the municipalities.
Therefore, this study analyzes SUS funding and expenditure, showing the different funding patterns and the different public health expen-diture models of the seven municipalities of the Rota dos Bandeirantes health region, State of São Paulo, from 2009 to 2012.
Methodology
This is an analytical, retrospective and cross-sec-tional quantitative study on the seven munici-palities of the Rota dos Bandeirantes health re-gion from 2009 to 2012, using secondary public domain data. The Rota dos Bandeirantes health region consists of the municipalities of Barueri, Carapicuíba, Itapevi, Jandira, Osasco, Pirapora do Bom Jesus and Santana de Parnaíba. These municipalities were characterized through the 2014 Rota dos Bandeirantes Region Health
Map21.
Data compilation and analysis was followed to analyze funding and health expenditure of
these municipalities, similar to other studies22,23,
using the results of the 2009-2012 indicators from the Public Health Budgets Information Sys-tem (SIOPS) made available by the Ministry of Health through the SUS Information Technology Department (DATASUS) on the Health Portal. Indicators used were as follows: tax revenue and legal constitutional transfers per capita; Percent-age of own tax revenue over tax revenue and legal constitutional transfers; Percentage of the Mu-nicipal Participation Fund (FPM) revenue over tax revenue and legal constitutional transfers; Percentage of Tax on Operations related to the Circulation of Goods and on the Provision of Interstate and Intercity Transport and Commu-nication Services (ICMS) revenue over tax reve-nue and legal constitutional transfers; Percentage of transfers from the federal government to the SUS over total SUS transfers; Per capita income from SUS transfers; Total expenditure on health per capita; Percentage of own resources spent on health; Percentage of personnel expenditure over total health expenditure; Percentage of ex-penditure on outsourced services – legal entities over total health expenditure and percentage of investment expenditure over total health expen-diture.
Indicators used for the analysis of munic-ipal funding and expenditure were collected by
SIOPS24. Website http://portalsaude.saude.gov.
fol-e C
ole
tiv
a,
22(4):1269-1280,
2017
lowing search strings were selected: “indicators”, “municipalities”, “consultation per stage of ex-penditure”, “2002 onwards annual” and “settled expenditure”. The budgetary data (revenues and expenses) shown in the tables and charts were deflated using the General Price Index-Inter-nal Availability (IGP-DI) of the Getúlio Vargas Foundation, converted to December 2012 values.
Results
The Rota dos Bandeirantes health region consists of the municipalities of Barueri, Carapicuíba, Itapevi, Jandira, Osasco, Pirapora do Bom Jesus and Santana de Parnaíba, which are located to the west of the metropolitan region of São Pau-lo, in a contiguous region and of geographically close municipalities, but with profound differ-ences (including demographic differdiffer-ences), with 16,238 inhabitants in Pirapora do Bom Jesus, 110,842 inhabitants in Jandira, 113,945 inhabi-tants in Santana de Parnaíba, 206,558 inhabiinhabi-tants in Itapevi, 373,358 inhabitants in Carapicuíba and 668,877 inhabitants in Osasco.
The Rota dos Bandeirantes municipalities are also different in the way they build their political and economic processes, but their interests con-verge with regard to services, trade and employ-ment, which transcend the boundaries of munic-ipalities, creating a dynamic coexistence network. Due to their own characteristics, some munici-palities are still quite dependent on jobs, health and services in general. The production of wealth generated by the region has not been equally dis-tributed among the municipalities, where areas of great purchasing power coexist with areas of extreme poverty.
The heterogeneity of the Rota dos Bandei-rantes municipalities is also evident when ob-serving the 2010 Human Development Index (HDI). Pirapora do Bom Jesus has the lowest HDI
of the region (0.727), ranking 418th in the State
of São Paulo’s municipalities ranking, followed
by Itapevi (0.735), ranking 345th, Carapicuíba
(0.749), ranking 236th, and Jandira (0.760),
rank-ing 164th, very far from Barueri and Santana de
Parnaíba, with HDIs of 0.786 and 0.814,
respec-tively, ranking 47th and 9th in the State of São
Pau-lo municipalities ranking.
When evaluating the available per capita in-come of each municipality (Table 1), which are the available funds to implement public actions and services for the population of its territory, a very large inequality is identified between
Baru-eri’s income, which is almost tenfold that of Car-apicuíba, which has the lowest available income in the region. The municipality of Santana de Parnaíba also has an available per capita income above regional average, and more than double that of Osasco that ranks third in the region in this category. Available income increased almost every year and in all assessed municipalities, with an average growth of around 30%, when com-paring to the first evaluated year (2009) with the last evaluation year (2012). In Pirapora do Bom Jesus, this available income growth was 64.27%, whereas Itapevi reported a level of 46.69%. The municipality with the lowest increase in available income was Jandira, with 12.10%.
The structure of the available income of the municipalities of the region in the period stud-ied, considering the local municipality taxes col-lected, the constitutional state transfers of the Tax on Operations related to the Circulation of Goods and on the Provision of Interstate and In-tercity Transport and Communication Services (ICMS) and the federal constitutional transfers of the Municipal Participation Fund (MPF) are shown in Table 2. It can be observed that, in the average and in all the years studied, municipali-ties of the region are highly dependent on own taxes and ICMS, and the only municipality with great FPM-dependence is Pirapora do Bom Jesus.
The percentage of Federal Government’ and State’s share in transfers to the SUS of munici-palities of the region shows the importance of these remittances in municipal health financ-ing. According to information provided by SI-OPS, in the average of the four years studied, the Federal Government’s share of SUS transfer was 95.40% compared to 4.60% of State transfers to the municipalities of the region. Federal Govern-ment-State distribution was as follows: Barueri, 98.20%-1.80%; Carapicuíba, 90.80%-9.20%; Itapevi, 86.40%-13.60%; Jandira, 99.00%-1.00%; Osasco, 97.40%-2.60%; Pirapora do Bom Je-sus, 89.00%-11.00%; and Santana de Parnaíba, 99.00%-1.00%.
In the years 2009 to 2012, the average Federal Government and State per capita transfers to the SUS of the municipalities of the region enables a better understanding of the impact of federal and state transfers directly on the service to cities residents.
Sant
os N Table 1. Available per capita income from taxes and constitutional and legal transfers, by municipality and health region, in the period from 2009 to 2012 (in Reals of Dec/2012*).
Municipalities/
Health Region 2009 2010 2011 2012
Municipal Average 2009 to 2012
Barueri 4.986,35 4.872,90 6.038,65 6.228,29 5.531,55
Carapicuíba 526,05 556,78 638,25 675,63 599,18
Itapevi 878,33 879,57 1.172,68 1.288,38 1.054,74
Jandira 1.013,81 1.067,49 1.190,16 1.136,46 1.101,98
Osasco 1.203,37 1.376,43 1.580,30 1.641,96 1.450,51
Pirapora do Bom Jesus 976,13 1.237,17 1.518,73 1.603,51 1.333,89
Santana de Parnaíba 2.809,16 2.707,02 3.113,18 3.479,95 3.027,33
Region Average 1.666,82 1.723,93 2.032,04 2.129,20 1.888,00
* Deflator IGP-DI – FGV.
Source: SIOPS.
Table 2. Level of dependence, as a percentage, of the municipalities’ available income in relation to taxes collected by the municipality, state constitutional transfers of the ICMS and the federal constitutional transfers of the FPM, by municipality and health region, in the period from 2009 to 2012.
Municipalities/ Health Region
Period
Municipal Average 2009 to 2012
2009 2010 2011 2012
Barueri
Local Taxes 43,21 46,37 46,93 48,99 46,38
ICMS 49,55 45,93 46,12 43,52 46,28
FPM 3,45 3,23 2,93 3,50 3,28
Carapicuíba
Local Taxes 29,77 31,77 35,55 37,93 33,76
ICMS 32,97 31,15 32,73 30,81 31,91
FPM 25,64 23,51 17,04 18,49 21,17
Itapevi
Local Taxes 29,85 29,15 28,99 26,81 28,70
ICMS 36,72 39,20 43,54 50,18 42,41
FPM 29,17 25,87 22,44 18,12 23,90
Jandira
Local Taxes 23,78 29,62 27,53 27,04 26,99
ICMS 39,06 39,73 38,36 40,31 39,36
FPM 29,96 22,89 26,61 27,55 26,75
Osasco
Local Taxes 56,08 55,57 53,73 52,37 54,44
ICMS 35,14 31,90 32,37 34,68 33,52
FPM 5,58 4,76 5,45 4,85 5,16
Pirapora do Bom Jesus
Local Taxes 40,69 22,82 21,89 23,90 27,33
ICMS 24,68 26,87 35,73 26,27 28,39
FPM 29,83 47,32 47,26 46,17 42,64
Santana de Parnaíba
Local Taxes 59,14 58,18 55,69 52,83 56,46
ICMS 23,56 23,84 28,18 28,75 26,08
FPM 9,23 9,30 7,91 8,89 8,83
Region Average
Local Taxes 46,10 47,63 46,96 47,13 46,95
ICMS 40,33 37,60 38,76 38,69 38,84
FPM 8,81 8,03 7,66 7,68 8,04
e C
ole
tiv
a,
22(4):1269-1280,
2017
R$ 98.40-R$ 2.63; Pirapora do Bom Jesus, R$ 127.70-R$ 18.80; Santana de Parnaíba, R$ 75.90-R$ 0.69. In the regional average, municipalities received R$ 93.30 from the Federal Government and R$ 4.34 from the State. It is worth remind-ing that data originated from SIOPS and that all these values were deflated for December 2012 to facilitate comparison between them.
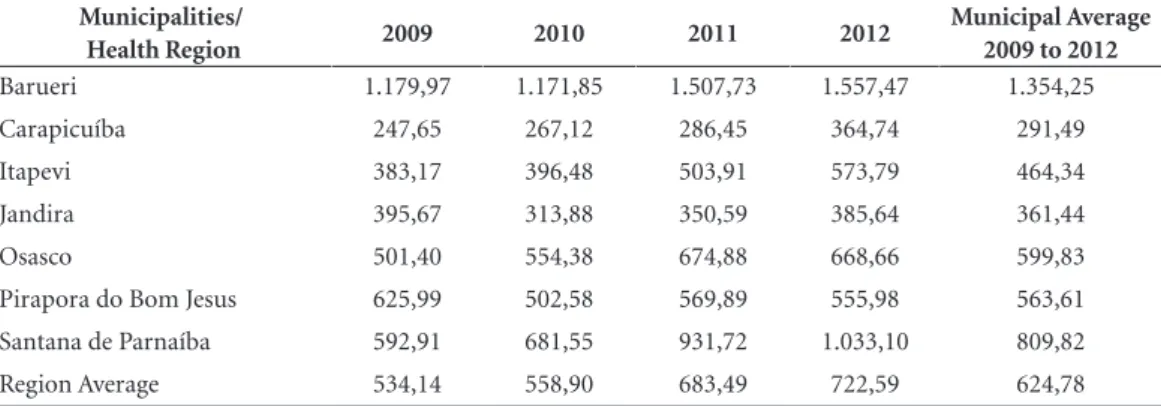
Total municipal health expenditure com-prises municipal public authority funds directly spent by the Municipal Health Secretariat and includes, besides municipal own funds, transfers from federal and state governments, since they are accounted for in the municipal budget. Table 3 shows municipalities’ total annual health ex-penditure per capita and the average of the four years studied. Worth noting is the difference be-tween the municipalities of Barueri and Santana de Parnaíba against the regional average and the remaining municipalities, as well as, with the ex-ception of Jandira and Pirapora do Bom Jesus, the increasing trend of total SUS expenditure per capita in all other municipalities analyzed.
The analysis of health expenditure with own resources (Table 4), assessed SUS expenditure ex-cluding SUS transfers from other federated enti-ties and including only municipal own resources, that is, those from municipal taxes and legal con-stitutional transfers, both shown by per capita amount and by the percentage that demonstrates compliance with the provisions of
Complemen-tary Law 141 of January 13, 201225, which
deter-mines that municipalities must spend least 15% of their tax revenues and constitutional transfers.
Table 4 shows the increasing trend of health expenditure with own resources in all
municipal-ities evaluated and the percentage spent on health through municipalities’ own revenue, evidencing the level of municipality commitment in health actions and services. Worth highlighting are the regional average, which is almost double the minimum required by law and the difference in the per capita amount of Barueri and Santana de Parnaíba compared to the remaining municipal-ities in the region, as well as the high percentage of commitment of own revenue of Carapicuíba, Itapevi, Osasco and Pirapora do Bom Jesus.
Table 5 shows the purpose of health funds’ expenditure in the municipalities of the region in the years studied. It was possible to observe that, in the regional average and in all the years studied, most funds were allocated to personnel expenses.
Discussion
SUS underfunding has been occurring since its inception, and this situation exacerbates in times of crisis, due to undefined systematic and ade-quate funding source and by drastic cuts that do not spare health when finances are tight. Ana-lyzing SUS funding and expenditure in munici-palities is a way of portraying the real situation of public financing at the source, where things happen and where the population really feels hardships of accessing public health services, and thus, exposing difficulties, differences and mod-els adopted, proposing solutions that can con-tribute to the consolidation of the SUS.
The reason for choosing the Rota dos Bandei-rantes health region for study was precisely due
Table 3. Total SUS municipal per capita expenditure, by municipalities and health region in the period from 2009 to 2012 (in Reals of Dec/2012*).
Municipalities/
Health Region 2009 2010 2011 2012
Municipal Average 2009 to 2012
Barueri 1.179,97 1.171,85 1.507,73 1.557,47 1.354,25
Carapicuíba 247,65 267,12 286,45 364,74 291,49
Itapevi 383,17 396,48 503,91 573,79 464,34
Jandira 395,67 313,88 350,59 385,64 361,44
Osasco 501,40 554,38 674,88 668,66 599,83
Pirapora do Bom Jesus 625,99 502,58 569,89 555,98 563,61
Santana de Parnaíba 592,91 681,55 931,72 1.033,10 809,82
Region Average 534,14 558,90 683,49 722,59 624,78
* Deflator IGP-DI – FGV.
Sant
os N Table 4. SUS per capita expenditure with municipal own resources and proportion of municipality’s own
revenue invested in health, by municipalities and health region in the period from 2005 to 2012 (in Reals of Dec/2012*).
Período 2009 2010 2011 2012
Municipal Average 2009 to 2012 Municipalities/
Health Region
Per capita
% Per
capita
% Per
capita
% Per
capita
% Per
capita %
Barueri 1.046,42 20,99 1.062,98 21,81 1.370,33 22,69 1.387,48 22,28 1.216,80 21,94
Carapicuíba 181,60 34,52 204,38 36,71 223,98 35,09 295,24 43,70 226,30 37,51
Itapevi 312,55 35,59 307,13 34,92 392,31 33,45 471,05 36,56 370,76 35,13
Jandira 255,05 25,16 177,19 16,6 224,29 18,85 265,72 23,38 230,56 21,00
Osasco 411,97 34,23 437,56 31,79 536,52 33,95 527,67 32,14 478,43 33,03
Pirapora do Bom Jesus 420,37 43,06 406,28 32,84 388,02 25,55 412,21 25,71 406,72 31,79
Santana de Parnaíba 522,08 18,59 603,62 22,3 845,38 27,15 920,53 26,45 722,9 23,62
Region Average 534,14 26,54 558,90 26,65 683,49 27,98 722,59 28,21 624,78 27,35
* Deflator IGP-DI – FGV.
Source: SIOPS.
to the great heterogeneity of its municipalities, their different collection patterns and the differ-ent models of public health expenditure man-agement. The period 2009-2012 was set for the study as the last completed period of municipal government management.
The analysis of the municipal available reve-nue (Table 1) and the public health expenditures (Table 3) evidences a direct relationship between both, that is, the higher the available income, the higher the public health expenditure,
corrobo-rating a study by Ferreira26. We also note a great
disparity in the available municipal income, lead-ing to heterogeneous ways of offerlead-ing services to the population, both in health and in other areas, directly reflecting in the quality of public actions and services, including in health, produc-ing islands of prosperity surrounded by misery on all sides. This heterogeneity and fragmenta-tion of the Brazilian public health system caused by the centralization of the municipality as the
basic organizational core of the system16 and by
the delay in recognizing and effecting regional-ization as the only way to integrate a system that is segmented into 5,570 municipal systems and
27 state systems14,16-19 has caused such an abyssal
inequity between municipalities and between health regions that the SUS of a municipality or a region is definitely not the same SUS of other municipalities or region.
When analyzing the level of dependence of the available income of municipalities that make up the Rota dos Bandeirantes health region (Ta-ble 2), we also note another large difference in the composition of revenue. The region has mu-nicipalities with great financial autonomy in the generation of their income and therefore greater possibility of implementing public policies, as in the case of Santana de Parnaíba, Osasco and Ba-rueri, where approximately half of revenues con-sists of own taxes, while other municipalities own taxes revenue is around 30%, thus with a reduced possibility of implementing public policies.
There are also municipalities such as Pirapo-ra do Bom Jesus, whose revenue consists of more than 42% from the Municipal Participation Fund
(FPM). Some studies22,23 point out that
FPM-de-pendence is more significant in municipalities with low numbers of inhabitants because the FPM distribution criterion is based on municipal population brackets.
Municipalities of the region are highly de-pendent on state ICMS transfers (over 25%), in all evaluated years and in all municipalities, including Pirapora do Bom Jesus, whose popu-lation is less than twenty thousand inhabitants. ICMS transfers tend to benefit densely populat-ed municipalities with a more solid economic base and greater commercial activity and service
per-e C
ole
tiv
a,
22(4):1269-1280,
2017
centages of the composition of available revenue through ICMS transfers below the regional aver-age in the municipality of Osasco, which is the most densely populated of the region, with a very solid economic base and with great commercial activity and services. This discrepancy is justified by the large tax collection capacity with own tax-es, which alone is more than half of the available income of Osasco, making the ICMS transfer
lower than the regional average, percentage wise. The Federal Government is, after the munici-pality itself, is the great financier of public health in the municipalities studied, in which more than 95% of transfers to the SUS of these municipalities derive from federal funds and less than 5% from State resources. Transfers made directly by the State Health Fund (FES) to the Municipal Health Fund (FMS) are negligible in the municipalities of
Table 5. Percentage share of personnel and third party services expenditure – legal entity, and expenditure on investments under total health expenditure, by municipalities and health region in the period from 2009 to 2012.
Municipalities/ Health Region
Period
Municipal Average 2009 to 2012
2009 2010 2011 2012
Barueri
Personnel 29,39 38,39 38,64 41,89 37,08
Outsourced 59,93 51,71 49,28 46,86 51,95
Investments 1,34 0,70 2,47 2,14 1,66
Carapicuíba
Personnel 59,42 60,27 71,60 60,01 62,83
Outsourced 9,99 7,00 7,72 9,48 8,55
Investments 2,79 1,58 4,67 8,77 4,45
Itapevi
Personnel 68,02 67,18 62,83 68,55 66,65
Outsourced 13,47 11,92 13,27 11,85 12,63
Investments 1,90 3,29 5,84 2,68 3,43
Jandira
Personnel 42,90 67,80 62,74 49,92 55,84
Outsourced 15,44 12,44 16,97 14,02 14,72
Investments 4,14 2,35 1,57 2,77 2,71
Osasco
Personnel 61,29 57,04 60,04 60,62 59,75
Outsourced 18,90 18,67 13,68 16,03 16,82
Investments 1,37 3,50 2,74 3,44 2,76
Pirapora do Bom Jesus
Personnel 54,47 53,99 57,88 62,08 57,11
Outsourced 11,41 27,21 28,97 14,69 20,57
Investments 1,37 0,95 0,95 0,31 0,90
Santana de Parnaíba
Personnel 70,65 69,93 67,41 55,87 65,97
Outsourced 14,44 15,99 17,46 24,84 18,18
Investments 1,24 2,06 5,38 8,58 4,32
Region Average
Personnel 50,99 53,74 55,39 54,79 53,73
Outsourced 30,42 26,81 24,75 25,08 26,77
Investments 1,66 2,25 3,28 3,99 2,80
Sant
os N the region; in some years and for some
munici-palities of the region, there were no transfers from
State to municipality. A study by Mendes et al.23
carried out throughout the metropolitan region of São Paulo reached the same conclusion, making it clear that fund-to-fund transfers to the SUS of municipalities through its State Health Secretariat of São Paulo (SES-SP) is not a policy of the gov-ernment of the state of São Paulo. These findings
are also corroborated by Leite et al.27, in a study
on 14 municipalities in the state of Rio Grande do Norte, which also pointed to increased share of municipalities in the composition of funds, with a negligible State participation.
It is important to take into account that SES-SP has a large structure of services managed di-rectly or through Social Health Organizations (OSS), which serve the population of the Rota dos Bandeirantes health region. However, this study could not establish SES-SP’s indirect ex-penses in the municipalities and only considered municipal expenditure directly through the FMS.
Transfers to the SUS of the municipalities also show different levels of participation of the State and the Federal Government when analyzed per capita. The average per capita SUS transfers to the municipalities of the Rota dos Bandeirantes health region in the period 2009-2012 shows that Barueri has received more funds proportionally to its population, followed by Jandira. According
to Ferreira26, SUS transfers per capita are
propor-tional to the size of the municipality, with the exception of municipalities with less than ten thousand inhabitants and that, based on this fact, large urban clusters tend to spend more in terms of health per capita. While Barueri is not small, Osasco is relatively larger in both population and installed capacity, and ranks fourth in this seg-ment. Jandira, which is second-to-last in terms of population, ranks second in transfers per capita, followed by Pirapora do Bom Jesus, whose pop-ulation is less than twenty thousand inhabitants. We need to consider that “adherence” of mu-nicipalities to policies and programs that bring federal incentives is an independent decision and has direct bearing on the level of Federal Govern-ment transfers to municipalities.
The analysis of SUS transfers per capita shows that municipalities with a smaller structure, such as Carapicuíba and Itapevi benefit from lower funds levels proportionally to their population, certainly due to the installed capacity and the production historical series of these
municipal-ities. Other authors23,27 have reached similar
con-clusions.
With regard to total health expenditure (Ta-ble 3), there was an increase of more than 35% in the region’s expenditure when comparing 2009 with 2012. This is a significant increase, con-sidering that, at the time of IBGE’s 2010 demo-graphic census, a reduced population was noted in all municipalities in the region. This increased expenditure occurs in most Brazilian
municipal-ities as already identified in another study27.
It is worth noting that the per capita expen-diture calculation considers only the official pop-ulation, without taking into account health users from other municipalities that end up using the services offered. The municipality of Barueri, which had the highest total per capita expendi-ture, due to its large service strucexpendi-ture, ends up providing care to a large number of health us-ers from neighboring municipalities, mainly through its emergency care units, and this ser-viced population is not included in the calcula-tion of its total expenditure per capita. The mu-nicipality of Carapicuíba, which had the lowest per capita health expenditure, has in the region and even within its own territory state services in place to provide care to its population, and this indirect State expenditure with the population of Carapicuíba does not appear in this account. These considerations apply to all other munici-palities, since no municipality has such a self-suf-ficient health system that it does not use any ser-vice from other municipalities or under state or federal management to provide comprehensive services to its citizens.
When assessing the percentage of expendi-ture with own revenues, that is, without consid-ering expenses with health-linked revenues, one can see the level of endeavors of municipalities to maintain their health system (Table 4). The regional average is 27.35%, but the average of the four years studied reaches 37.51% in Cara-picuíba; 35.13% in Itapevi; 33.03% in Osasco and 31.79% in Pirapora do Bom Jesus, while mu-nicipalities that evidenced the highest per capita health expenditure as Barueri committed, on av-erage, 21.94% of their own revenues, and Santa-na de ParSanta-naíba, which has the second largest per capita health expenditure in the region, commit-ted 23.62% of its own revenue.
e C
ole
tiv
a,
22(4):1269-1280,
2017
Services backed by exorbitant expenditure to the detriment of developing other essential services should be a constant concern of the public
man-ager28. Thus, public policies geared to reduce this
great pressure on budgets of municipalities that have a lower collection should be in place. One way to relieve this pressure is through increased expenditure on health by the Ministry of Health, which is the government sphere that has a con-stitutional commitment to increase its share of health expenditure, thus settling a historical debt of those who proportionately have already spent
more on health29. It is worth recalling that two
Proposals of Amendment to the Constitution Nº 143 (PEC 143) and 241 (PEC 241) are being discussed in the National Congress, which, if ap-proved, will further reduce Federal Government’s health expenditure.
This study shows that, in the regional aver-age of the four years studied, more than half of health expenditure (53.73%) was allocated to personnel and 26.77% to outsourced services. A slight increase in personnel expenses and a slight decrease in outsourcing expenses was noted be-tween 2009 and 2012 (Table 5). The analysis of health expenditure allocation according to its purpose enables to identify the management model adopted by municipal governments vis-à-vis human resources, whether own staff or out-sourced personnel. The higher share of personnel expenses indicates that the municipality adopt-ed the direct recruitment of personnel through public positions or jobs and the higher share of outsourced services indicates that the municipal-ity chose not to use direct personnel recruitment, but rather contracting outsourced companies and/or establishing partnerships with not-for-profit private entities.
It can be said that, with the exception of the municipality of Barueri, which adopted a mod-el of outsourcing of support services and part-nerships through covenants and management agreements with private entities that manage some municipal services, at least in the period analyzed, the other municipalities adopted an eminently traditional model through the estab-lishment and provision of public positions and
jobs, corroborating other studies22,23.
The reason why Barueri adopted an out-sourcing model is possibly the same as that of most Brazilian municipalities that are worried about not violating Complementary Law No.
101/200030, called the Fiscal Responsibility Law
(LRF), which limits municipal personnel ex-penses to 54% of net current revenue, at the risk
of committing public finance crimes. Bills have been submitted to National Congress to relax LRF’s limits and even to exclude resources
allo-cated to public health actions and services31 from
personnel expenses brackets.
Investment expenditure during this peri-od was very low in the municipalities of the re-gion, which shows that municipal management is allocating few resources for the acquisition of permanent assets such as medical and hospital equipment, computers, furniture, etc., as well as for the construction of new facilities or expan-sion of units within own properties. Curiously, the municipality that spent the most health funds on new investments in this period was Carapicuí-ba, with 4.45%, followed closely by Santana de
Parnaíba, with 4.32%. Other studies22,23 also
found this small share of investments in the mu-nicipalities analyzed.
Final considerations
In health policy evaluation, the municipali-ty should be vigilant for its health funding and expenditure standard. The municipal manager’s evaluation is essential, since he assumes respon-sibility for all public health actions and services within his territory, especially primary health care policy. Thus, it would be important for mu-nicipal managers to master this realm in order to ensure an evaluation of the municipal SUS to improve its results.
This article sought to evaluate municipal funding and expenditure with this purpose in mind, considering the important tool of SIOPS, little used for that purpose. As a management tool, this system supports the municipal manag-er’s decision-making with regard to allocated and spent resources to better respond to the health needs of the local population.
Based on the analysis of the seven municipal-ities in the Rota dos Bandeirantes health region, we can conclude that there are large disparities in health funding and spending, with a significant discrepancy in available income per capita and per capita health expenditure by the municipali-ties in the region. These differences show that, in addition to insufficiency, there is a poor distri-bution of available resources, making the system heterogeneous and fragmented.
Sant
os N regionalization and organization were in place
since their idealization in the Health Reform, and is provided in the Federal Constitution, however, its effective implementation has not occurred yet.
In the Brazilian federative model, where the municipality is an independent federated entity, as are State and the Federal Government, it is im-possible to conceive a regional autonomy, with-out this health region really having the tools to exercise this autonomy in the integration of the system. The system’s effective regionalization through the strengthening of health regions, with the power to network existing services in the
re-gion more efficiently and with economies of scale and scope facilitating access and achieving maxi-mum comprehensiveness within the region seems to be the only way toward a truly national SUS.
e C
ole
tiv
a,
22(4):1269-1280,
2017
Collaborations
JA Santos Neto contributed to data collection and review. AN Mendes contributed to study de-sign and final wording. AC Pereira contributed to the final wording. LR Paranhos contributed to collected data arrangement and final wording.
References
1. Espírito Santo ACG, Tanaka OY. Financiamento, gasto e oferta de serviços de saúde em grandes centros urba-nos do estado de São Paulo (Brasil). Cien Saude Colet
2011; 16(3):1875-1885.
2. Mendes A. A longa batalha pelo financiamento do SUS.
Saúde Soc. 2013; 22(4):987-993.
3. Benevides RPS. Financiamento do SUS na região
metro-politana do Rio de Janeiro nos anos 2000 [dissertação].
Rio de Janeiro: Universidade do Estado do Rio de Ja-neiro; 2010.
4. Gonçalves RF, Bezerra AFB, Espírito Santo ACG, Sousa IMC, Duarte-Neto PJ, Brito e Silva KS. Confiabilidade dos dados relativos ao cumprimento da Emenda Cons-titucional nº. 29 declarados ao Sistema de Informações sobre Orçamentos Públicos em Saúde pelos municí-pios de Pernambuco, Brasil. Cad Saude Publica 2009; 25(12):2612-2620.
5. Mendes A, Marques RM. O financiamento do SUS sob os “ventos” da financeirização. Cien Saude Colet 2009; 14(3):841-850.
6. Mendes A, Leite MG, Marques RM. Discutindo uma Metodologia para a Alocação Equitativa de Recursos Federais para o Sistema Único de Saúde. Saúde Soc. 2011; 20(3):673-690.
7. Espirito Santo ACG, Fernando VCN, Bezerra AFB. Despesa pública municipal com saúde em Pernam-buco, Brasil, de 2000 a 2007. Cien Saude Colet 2012; 17(4):861-871.
8. Marques RM, Mendes A. A problemática do financia-mento da saúde pública brasileira: de 1985 a 2008. Econ Soc. 2012; 21(45):345-362.
9. Pinheiro Filho FP, Sarti FM. Falhas de mercado e re-des em políticas públicas: re-desafios e possibilidare-des ao Sistema Único de Saúde. Cien Saude Colet 2012; 17(11):2981-2990.
10. Mendes EV. 25 anos do Sistema Único de Saúde: resul-tados e desafios. Estud Av. 2013; 27(78):27-34. 11. Santos NR. SUS, política pública de Estado: seu
desen-volvimento instituído e instituinte e a busca de saídas.
Cien Saude Colet 2013; 18(1):273-280.
12. Rosa MRR, Coelho TCB. O que dizem os gastos com o Programa Saúde da Família em um município da Bahia? Cien Saude Colet 2011; 16(3):1863-1873. 13. Conselho Nacional das Secretarias Municipais de
Saú-de (CONASEMS). A Atenção Básica que queremos. Bra-sília: Editora Conasems; 2011.
14. Duarte LS, Pessoto UC, Guimarães RB, Heimann LS, Carvalheiro JR, Cortizo CT, Ribeiro EAW. Regionali-zação da saúde no Brasil: uma perspectiva de análise.
Saúde Soc. 2015; 24(2):472-485.
15. Viana ALD, Bousquat A, Pereira APCM, Uchimura LYT, Albuquerque MV, Mota PHS, Demarzo MMP, Ferreira MP. Tipologia das regiões de saúde: condicio-nantes estruturais para a regionalização no Brasil. Saú-de Soc. 2015; 24(2):413-422.
16. Santos L, Campos GWS. SUS Brasil: a região de saúde como caminho. Saúde Soc. 2015; 24(2):438-446. 17. Kuschnir R, Chorny AH. Redes de atenção à saúde:
Sant
os N 18. Mendes A, Louvison MCP, Ianni AMZ, Leite MG, Feuerwerker LCM, Tanaka OY, Duarte L, Weiller JAB, Lara NCC, Botelho LAM, Almeida CAL. O processo de construção da gestão regional da saúde no estado de São Paulo: subsídios para a análise. Saúde Soc. 2015; 24(2):423-437.
19. Shimizu HE. Percepção dos gestores do Sistema Único de Saúde acerca dos desafios da formação das Redes de Atenção à Saúde no Brasil. Physis 2013; 23(4):1101-1122.
20. Silva SF. Organização de redes regionalizadas e inte-gradas de atenção à saúde: desafios do Sistema Único de Saúde (Brasil). Cien Saude Colet 2011; 16(6):2753-2762.
21. Rede Regional de Atenção à Saúde 05 (RRAS 05). Mapa
da Saúde da Região da Rota dos Bandeirantes. Osasco:
RRAS 05; 2014.
22. Mendes A. Financiamento, gasto e gestão do Sistema Único de Saúde: a gestão descentralizada semiplena e plena do sistema municipal no Estado de São Paulo
(1995- 2001) [tese]. Campinas: Instituto de Economia,
Universidade Estadual de Campinas; 2005.
23. Mendes A, Kudzielicz E, Dimitrov P, Moriya R, orga-nizadores. Financiamento e Gasto do Sistema Único de
Saúde na região metropolitana de São Paulo, 2002-2008.
São Paulo: Observatório de Saúde da Região Metropo-litana de São Paulo, FUNDAP; 2010.
24. Sistema de Informações sobre Orçamentos Públicos em Saúde (SIOPS). Dotação atualizada. [acessado em 2015 fev 7]. Disponível em: http://siops-asp.datasus. gov.br/cgi/siops/siops_indic/municipio/anual/prv_in-dex.htm
25. Brasil. Lei Complementar nº 141, de 13 de janeiro de 2012. Regulamenta o § 3º do art. 198 da Constituição Federal para dispor sobre os valores mínimos a serem aplicados anualmente pela União, estados, Distrito Fe-deral e municípios em ações e serviços públicos de saúde e as normas de fiscalização, avaliação e controle das des-pesas com saúde nas 3 (três) esferas de governo; revoga dispositivos das Leis números 8.080, de 19 de setembro de 1990, e 8.689, de 27 de julho de 1993; e dá outras providências. Diário Oficial da União 2012; 16 jan.
26. Ferreira SG. Municípios: despesa com saúde e transfe-rências federais. Informe-se 2002; 38(fev.):1-8. 27. Leite VR, Lima KC, Vasconcelos CM. Financiamento,
gasto público e gestão dos recursos em saúde: o ce-nário de um estado brasileiro. Cien Saude Colet 2012; 17(7):1849-1856.
28. Greiling D. Performance measurement: a remedy for increasing the efficiency of public services. 2006. Int J
Product Performance Manag 2006; 55(6):448-465.
29. Carvalho G. A saúde pública no Brasil. Estud. Av. 2013; 27(78):7-26.
30. Brasil. Lei Complementar nº 101, de 4 de maio de 2000. Estabelece normas de finanças públicas voltadas para a responsabilidade na gestão fiscal e dá outras providên-cias. Diário Oficial da União 2000; 5 maio.
31. Mendes A. Limite de Gasto com Pessoal na Saúde pela LRF: uma barreira à construção do SUS público, in-tegral e de qualidade. Domingueira da Saúde do Idisa
2015; 5(1):1-4.
Article submitted 23/05/2016 Approved 04/08/2016