O
RIGINALA
RTICLE Revista Brasileira de FisioterapiaRelationship between quadriceps angle (Q) and
plantar pressure distribution in football players
Relação entre o ângulo quadriciptal (ÂQ) e a distribuição da pressão plantar
em jogadores de futebol
Rafael G. Braz, Gustavo A. Carvalho
Abstract
Objectives: To determine whether there is an association between the Q-angle (Q) and the distribution of plantar pressure in football players, and to compare the characteristics of these athletes with non-practitioners of this sport. Methods: 121 male participants were selected: 50 football practitioners (FP) and 71 non-practitioners (NP). We concurrently evaluated the Q-angle and the plantar pressure through the software of postural assessment (SPA) and the F-Mat System, respectively. To verify the correlation between the Q-angle and peak pressure values in four segments of the foot (medial and lateral forefoot, medium-foot and hind-foot), the Pearson coefficient (r) for parametric analysis was used. The independent t-test was used to compare these variables between the groups. Data normality was verified by the skewness values, adopting a significance level of 5%. Results: A negative and weak correlation was found (r=-0.32) between the Q-angle and the plantar pressure in the right medium-foot. The groups differed with regards to the right Q-angle (11.36° in FP versus 13.80° in NP) and the left Q-angle (11.03° in FP versus 13.96° in NP). Plantar pressure was also different between the groups, with FP showing higher mean values for the right side and for the left side of the forefoot (0.77 kg/cm2 in FP versus 0.63 kg/cm2 in NP,
and 0.65 kg/cm2 in FP versus 0.54 kg/cm2 in NP, respectively). However, mean peak pressure values for the left medium-foot were higher
among NP (0.37 kg/cm2 in FP versus 0.46 kg/cm2 in NP). Conclusions: There was no evidence of an association between the Q-angle
and the distribution of plantar pressure in FP. The athletes showed reduced Q-angle values and higher mean peak pressure values for the right and left aspects of the forefoot, suggesting a varus malalignment and a supine distribution of plantar bases.
Key words: football; Q-angle; plantar pressure; baropodometry; photogrammetry.
Resumo
Objetivos: Verificar possível associação entre ângulo quadriciptal (ÂQ) e distribuição de pressão plantar em jogadores de futebol, comparando-os com indivíduos não praticantes da modalidade. Métodos: Cento e vinte e um participantes do sexo masculino foram selecionados: 50 jogadores de futebol (JF) e 71 sujeitos para o grupo controle (GC). Avaliaram-se concomitantemente o ÂQ, por meio do Software para Avaliação Postural (SAPO), e a pressão plantar, pela plataforma F-Scan/F-Mat System. Para verificar correlação entre o ÂQ e os valores de picos de pressão em quatro segmentos do pé (antepé medial e lateral, médio-pé e retropé), utilizou-se o Coeficiente de Pearson (r) para análises paramétricas. O teste t independente foi empregado para comparar isoladamente essas mesmas variáveis entre os grupos. A normalidade dos dados foi verificada pelos valores de skewness, adotando nível de significância de 5%. Resultados: Encontrou-se correlação negativa e fraca (r=-0,32) somente entre ÂQ e médio-pé direito. Os grupos diferiram quanto ao ÂQ bilateralmente, sendo que o grupo JF teve média de 11,36º, e GC, de 13,80º à direita e de 11,03º contra 13,96º à esquerda, respectivamente. Em relação à pressão plantar, o JF teve maior média de força nas faces laterais do antepé direito (0,77 contra 0,63 kg/cm2) e esquerdo (0,65 e 0,54 kg/cm2), enquanto o GC apresentou maior pico de pressão no médio-pé esquerdo
(JF: 0,37 e GC: 0,46 kg/cm2). Conclusões: Não houve relação entre os valores de ÂQ na distribuição da pressão plantar nos jogadores
de futebol. Os atletas apresentaram, porém, ÂQ diminuído e maiores picos de pressão nas faces laterais de ambos os pés, o que sugere alinhamento em varo dos joelhos e distribuição supinada das bases plantares.
Palavras-chave: futebol; ângulo Q; pressão plantar; baropodometria; fotogrametria.
Received: 21/01/2009 – Revised: 17/07/2009 – Accepted: 21/10/2009
Laboratory of Biomechanics, Universidade Católica de Brasília (UCB), Brasília (DF), Brazil
Introduction
Football is one of the most popular sports in the world and it is characterized by short duration and high intensity motor actions, which are alternated with periods of longer duration and lower intensity motor actions1. Despite the health ben-eits associated with football, its regular practice increases the likelihood of mechanical instabilities due to excessive training load and competitions, which can result in changes in both muscular and articular systems2.
he concept of overtraining is applied to high level ath-letes and relects an imbalance between stress and recovery, causing greater vulnerability to physical injuries3. According to Fuller et al.4, these injuries should be classiied according to their site, laterality, type, mechanism of injury and recur-rence. Within this context, a traumatic injury refers to an identiiable speciic event; however, overtraining injuries caused by repetitive microtraumas are not linked to a single apparent factor.
Even though sedentarism is a key determinant to changes in posture, repetition of the sport gesture and the biotype of the football athlete contribute to the development of sport-speciic biomechanical changes5. he knee joint is often afected, with patellofemoral dysfunction being the most common problem6. One factor that favors the onset of pain and/or instability is the patellar malalignment in relation to the femur. his malalignment is measured by the quadriciptal angle (Q-angle)7, which is the acute angle formed by imagi-nary lines drawn from the anterior superior iliac spine to the center of the patella, and from the tibial tuberosity to the center of the patella8.
here is no consensus on what an ideal Q-angle value would be, but it is known that men show smaller Q-angle val-ues than women due to their higher mean height and smaller pelvic width8-10. According to Hamill and Knutzen10, Q-angles higher than 15 degrees are considered a genu valgum, whereas values lower than 10 degrees indicate a genu varum.Schweitzer and Miqüelluti11 analyzed the postural pattern of young foot-ball players and found changes such as lexed knees and genu varum, which are due to the repetitive use of lexor and abduc-tor muscles during kicking. One study with individuals 12 to 17 years old found that competitive football favors genu varum in male athletes when compared to non-athletes. It is assumed that repetitive microtraumas over the intern condyles due to training favor varism12.
Bipedal postural control relies on sensory and motor infor-mation that is controlled by the central nervous system. Cor-rections in the vertical body axis in the upright posture induce slight and constant oscillations that have an important role in distributing plantar pressure13. he position of osseous parts of
the lower limbs is controlled by the tonus of the muscles to which they are attached. However, joints also move around their own mechanical axes, causing tonic reactions and modi-fying pelvic and lower limb alignment. hus, variations occur-ring at the feet may inluence superior segments when load is received, and vice versa14.
Structural changes in the knee joint and their inluence on plantar pressure distribution can contribute to an increased incidence of overtraining injuries. hus, the identiication of overload areas that are capable to induce microtrauma or mechanical dysfunctions is relevant for athletes, as it provides information that is important for the maintenance of their physical integrity and is also useful for preventive research. One of the techniques used to assess the pressure exerted at the foot during standing is baropodometry, which quantiies the antero-posterior and lateral oscillations while the subject stands on a force platform14.
he aims of this study were to verify the existence of an as-sociation between the Q-angle and the distribution of plantar pressure in football players, and to compare the character-istics of these athletes with non practitioners of this sport. he speciic aims were to compare Q-angle values between football practitioners and non practitioners, and to compare plantar pressure values for diferent foot segments between the groups.
Methods
Design
A cross sectional study was undertaken.
Sample
A convenience sample of 121 male subjects 18 to 30 years old was selected: 50 football practitioners (FP) and 71 non practitioners (NP), totalizing 242 lower limbs. Subjects were not considered for inclusion if they presented with any of the following: subjects who were goal keepers (due to the speciic requirements of this position) or amateur athletes; had suf-fered a recent traumatic/orthopedic injury to the lower limb that would make the assessment diicult to perform; had con-genital malformation of the lower limbs; had sensory alteration in the feet; had body mass index (BMI) equal or superior to 31,6 kg/m2 or inferior to 18.8 kg/m2 (these limits were based on the indings of Pontes, Souza and Lima15).
and Esporte Clube Dom Pedro II. University academics were recruited from Universidade Católica de Brasília (UCB), Fa-culdade Santa Terezinha (FAST) and União Pioneira de Inte-gração Social (UPIS). he NP group was formed by academics and employees from UCB. Participants in the FP group prac-ticed football-related activities on a regular basis; i.e., they had a minimum of three years of practice and enjoyed inancial beneits (salary or scholarship) related to sport. Participants in the NP group were sedentary or practiced another non-professional sport modality.
After a brief explanation of the study, all participants signed an informed consent form, which was written according to the 196/96 resolution of the Conselho Nacional de Saúde, Brazil. he study was approved by the Research Ethics Committee of UCB (CEP/UCB nº 177/2007).
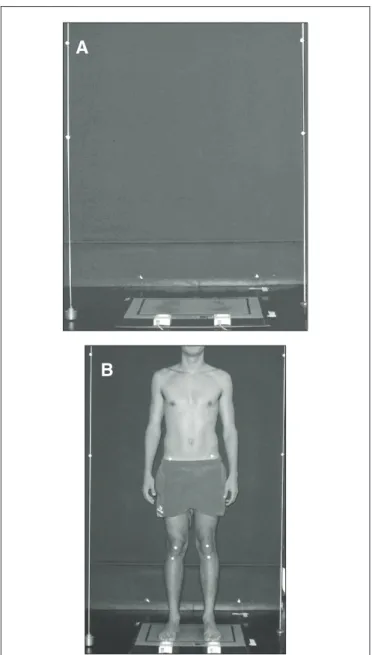
Figure 1. Environment for assessment and capture of previous view image, concomitant with plantar pressure.
A
B
Environmental assessment
his study was carried out in the Laboratory of Biome-chanics of UCB between December 2007 and March 2008. In order to prepare the environment for photogrammetry, two plumb lines (parallel to each other and 100 cm apart) were ixed on the ceiling. Each line was marked with two styrofoam balls with 4.5 cm diameter and 50 cm apart. Superior marks were placed 150 cm from the loor (thus, inferior marks were 100 cm away from the loor). A pressure sensing loor mat (F-Scan/F-Mat System®, model 3100, version 4.21, Tekscan Inc, South Boston) was positioned between the two plumb lines, and the system was connected to a computer (Figure 1-A). he evaluation room was equipped with a table, two com-puters, a properly calibrated weighing scale (Filizola, max 150 kg), a wall-mounted stadiometer (Seca, precision 0.1 cm) and a digital camera (Sony DSC-W35, 7,2 megapixels) mounted on a tripod (Manfrotto, model 3047). he tripod was placed 300 cm away from the plumb lines and the camera lens was positioned at half of the participant’s height16.
Procedure and data collection
Participants were instructed to wear only shorts to facili-tate the placing of anatomical markers for Q-angle measure-ment and to avoid any interference with the measuremeasure-ment of total body mass (TBM). First, participants’ TBM and height (H) were measured. BMI was calculated by the software of postural assessment (SPA, version 0.68, updated in July 2007) through the formula BMI (kg/m2) = TBM (kg) / H2 (m). To screen for any sensory alteration in the feet (one of the exclusion criteria), sensation was evaluated by an estesiometer (0.2 g Semmes-Weinstein monoilament).
hen, for the assessment of Q-angle values, participants were asked to lay supine with the quadriceps muscle in a relaxed position and markers were placed on the center of the anterior aspect of the patella, tibial tuberosity and the anterior superior iliac spine17. Palpation skills were used for the correct placement of these markers, which followed the standards established by France and Nester17, Hoppenfeld18 and Kendall, McCreary and Provance19. Styrofoam balls simi-lar to those previously described were used to identify the anatomical structures relevant for the measurement of the right and left Q-angles. he Q-angle value was determined by digital photogrammetry, with the software validated by Braz, Goes and Carvalho16.
caption of participant’s anterior view and the static plantar pressure distribution (Figure 1-B). If necessary, the examiner corrected any rotation of the hip. he second toe, considered the feet midline and the axis of the tibiotarsal joint20,21, was positioned in the same direction of the ipsilateral calcaneus without losing its contact with the platform. he second toe was also positioned perpendicular to the frontal plane not to inluence Q-angle measurement22. As soon as the plantar pres-sure assessment began, an anterior view photograph was taken for the Q-angle analysis by SPA16. After the image caption, the participant was instructed to remain still on the platform for 10 seconds for the plantar pressure analysis23. he variables considered in the static pressure analysis were total peak pressure (kg/cm2), right and left peak pressures (kg/cm2) and force distribution in medial and lateral areas of the forefoot, medium-foot and hind-foot in each lower limb. hus, four ar-eas of interest were selected for the analysis of bilateral plantar pressure (Figure 2): medial region of the forefoot divided by the second toe line (D1 and E1); lateral region of the forefoot (D2 e E2); medium-foot (D3 e E3); calcaneus (D4 e E4).
Statistical and data analysis
Statistical tests were selected as follows: (a) Student-t test for independent samples was used to compare the groups with respect to age, BMI, bilateral Q-angle value and bilateral plantar pressure in the four areas of interest; b) Pearson cor-relation coeicient was used to assess the corcor-relation between the Q-angle value and peak pressure values in all areas of inter-est (this was done independently for each group and for each lower limb). Exploratory analyses and tests for normality of data were performed, showing that all variables were normally distributed with the exception of peak pressure values in the medial region of the left forefoot among NP. In this case, non-parametric tests were performed. All statistical procedures were performed using the Statistical Package for Social Science software for Windows (SPSS, version 10.0). A level of signii-cance of 0.05 was considered for all analyses.
Results
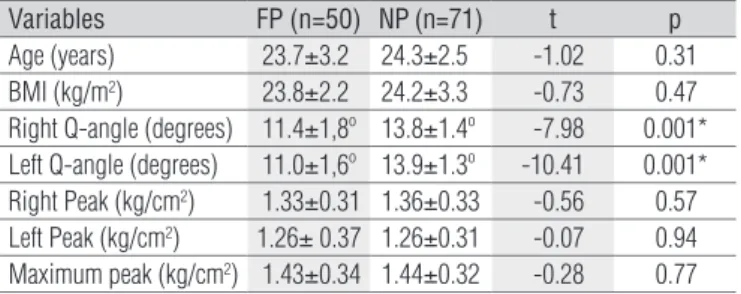
No signiicant diferences were found between groups with regards to age (p=0.31) and BMI (p=0.47), indicating some homogeneity within the sample. he t-test for independent samples demonstrated that bilateral Q-angle values were signiicantly smaller among FP than NP (p=0.001). Groups showed similar total peak pressures and peak pressures in each foot (Table 1).
When plantar pressure values were analyzed by foot seg-ment, groups showed statistically significant differences in two segments (Table 2): FP presented higher peak pressures in the lateral region of the right (p=0.01) and left forefoot (p=0.05); NP presented higher peak pressures in the medi-um-foot area of the left foot (p=0.001). A strong trend was observed (p=0.06) for greater peak pressures in the medial region of the right forefoot among NP. No significant differ-ences between the groups were found for plantar pressure values in the other segments. The Mann-Whitney non-parametric test was performed to compare peak pressure values in the medial region of the left forefoot and results showed no significant differences between the groups (z=-1.34; p=0.18) (Table 2).
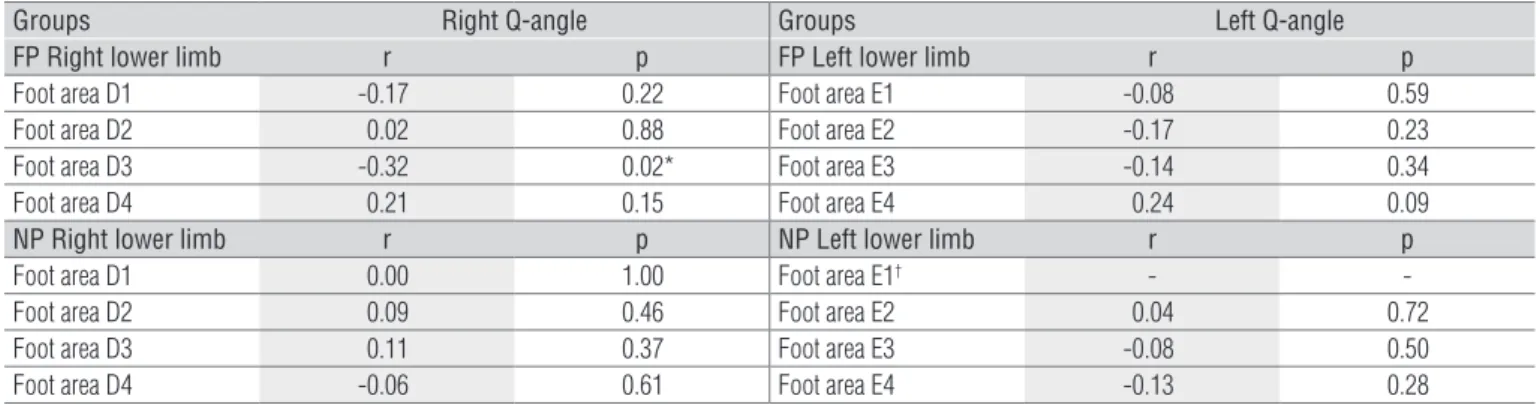
Results of correlation analyses for the FP group showed a negative and weak correlation between the right Q-angle value and the peak pressure in the medium-foot area of the right foot (r=-0.32; p=0.02); i.e., in the right lower limb, a reduced Q-angle is associated with a higher peak pressure in the medium-foot area (Table 3). For the remaining foot areas, no evidence of correlation was found between their peak pressure and the Q-angle value in this group. However, a positive and weak trend (r=0.24; p=0.09) was found between Q-angle and peak pressure values in the left hind-foot. Results of all correlation analyses for the NP group were non-significant (Table 3).
D1=right forefoot, medial; D2=right forefoot, lateral; D3=mid-right foot; D4=right hind-foot; E1=left forefoot, medial; E2=left forefoot, lateral; E3=mid-left foot; E4=left hind-foot.
Discussion
his study demonstrated a negative and weak association between Q-angle values and peak pressures in the medium-foot area of FP (right lower limb), which relects a smaller angular value at the knee for a higher pressure at the osseous region of anterior tarsus and part of the metatarsus. No correlation was found between peak pressures in segmental areas of both feet and Q-angles among NP.
Tillman et al.23 pointed out that an excessively large Q-angle can increase calcaneal eversion, thus positioning the subtalar joint in pronation. hese changes would partially be respon-sible for the drop of foot’s longitudinal arches. Tillman et al.23 compared the Q-angle value and the positioning of the subta-lar joint between genders and found a signiicant discrepancy only with regards to the Q-angle value (13.1±3.0º in men versus 17.5±3.8º in women). Olerud and Berg24 assessed changes in Q–angle values following the positioning of lower limbs and found that values decreased as the feet moved from pronation to supination. his may suggest that a more pronated foot pos-ture leads to higher medium-foot pressures, an indication that is consistent with our results for the FP group, even though the observed correlation was negative and weak.
When comparing the FP and the NP groups only in relation to the Q-angle, results of the present study are in agreement
with the literature. Hahn and Foldspang25 used goniometry to evaluate Q-angle values in 339 athletes, of whom 173 were FP participating in sports activities for a mean of 10 years. hey found mean values of 10.0±0.5º for the right Q-angle and of 6.0±0.5º for the left Q-angle, and concluded that this variable was negatively associated to football. In the present study, photogrammetry was used to evaluate Q-angle values in 50 FP with mean sports participation of 12 years. Mean values found in this study were 11.4±1.8º for the right Q-angle and 11.0±1.6º for the left Q-angle.
As mentioned by Hamill and Knutzen10, structural changes in the knee (genu valgus or genu varum) have an inluence on Q-angle measurement. he greater the intercondylar distance, the smaller would be the angle formed by the anterior superior iliac spine, the center of the patella and the tibial tuberosity. Yaniv et al.27 assessed the intercondylar distance in tennis players and FP and observed a higher prevalence of genu varum among FP (i.e., mean distances were 1.31 cm in tennis players and 2.99 cm in FP). According to the authors, this inding would indicate a genetic predisposition with a consequent natural selection process to the modality.If the Q-angle of these athletes had been investigated, it would be possible to observe smaller values among FP, as observed in the present study.
Woodland and Francis28 stated that the Q–angle value can sufer changes due to muscle imbalance, tibial torsion, femoral anteversion and a high or low patella. In football, Abreu, Barbosa and Coelho12 atributted the genu varus malalignment and the consequent decrease in the Q-angle to microtraumas over the femoral condyles of the athletes, which can be justiied by constant changes in direction with greater load distributed over the lateral border of the foot. Chaudhari, Hearn and Andriacchi29 associated the reduction in genu valgum to the practice of high-level football. Junge et al.30 veriied changes to the intercondilar space related to age, suggesting that the long-term practice of sports is associated with greater varism.
Hebert et al.31 highlighted the popularity of the baropodo-metric exam, but warned that the standardization of data presentation is not yet in use. he authors therefore suggested that the following is assessed: plantar area; peak pressures (kg/ cm2); identiication and quantiication of overload areas; sen-sory perception. Wong et al.32 evaluated peak plantar pressures in 15 FP while they were performing speciic gestures for the sport. he authors divided the foot into 10 regions, including the medial and lateral regions of the forefoot, the medium-foot (medial, central and lateral parts), and the calcaneus (medial and lateral parts). Cavanagh and Rodgers33 also divided the foot into segments to measure peak plantar pressures in 107 subjects with a mean age of 30.1±9.9 years old. Considering both limbs, mean pressure values were 1.40 kg/cm2 in the cal-caneus, 0.48 kg/cm2 in the mid-foot, 0.71 kg/cm2 in the lateral
Table 1. Characterization of the sample by age, BMI, right and left Q-angles, right and left peak pressures, and maximum peak pressure.
*p≤0.05.
Variables FP (n=50) NP (n=71) t p
Age (years) 23.7±3.2 24.3±2.5 -1.02 0.31 BMI (kg/m2) 23.8±2.2 24.2±3.3 -0.73 0.47
Right Q-angle (degrees) 11.4±1,8º 13.8±1.4º -7.98 0.001* Left Q-angle (degrees) 11.0±1,6º 13.9±1.3º -10.41 0.001* Right Peak (kg/cm2) 1.33±0.31 1.36±0.33 -0.56 0.57
Left Peak (kg/cm2) 1.26± 0.37 1.26±0.31 -0.07 0.94
Maximum peak (kg/cm2) 1.43±0.34 1.44±0.32 -0.28 0.77
Table 2. Distribution of plantar pressures (kg/cm2) for different foot
segments in study groups.
*p≤0.05. The E1 area, corresponding to the medial region of the left forefoot, was analyzed separately using the Mann-Whitney test, which showed no difference between the groups (z=-1.34; p=0.18).
Areas FP (n=50) NP (n=71) t p
aspect of the forefoot, and 0.57 kg/cm2 in the medial aspect of the forefoot. In the current study as well as in previous studies32,33, the foot was divided into the four areas considered to be the most relevant for analysis. Results for NP were similar to those reported by Cavanagh and Rodgers33, except for the lateral aspect of the forefoot, which presented a mean value of 0.58 kg/cm2. FP presented mean values that were quite inferior to the mentioned study for the calcaneus (1.19 kg/cm2) and the medial aspect of the forefoot (0.37 kg/cm2).
When analyzing the plantar pressure variables in isolation, the FP group presented higher pressures in the lateral aspect of the right and left forefoot when compared to the NP group. In the region of the left medium-foot, the mean pressure value was signiicantly higher among NP. Gross and Foxworth34 indicated that a larger Q-angle leads to a greater amount of pronation at the subtalar joint and consequently to greater levels of pressure in the medium-foot area. herefore, smaller Q-angles would be associated with greater pressures in the lateral aspects of the foot. In the present study, even though participants in the FP group presented smaller Q-angle values and a greater area of contact in the middle-foot (which would suggest a greater lattening of the medial longitudinal arch), they also presented higher peak pressure values in the lateral aspect of the forefoot, conirming the assumptions made by Gross and Foxworth34.
In the present study, there was an attempt to use only valid measurement instruments for the assessments. he authors acknowledge that the goniometer is not ideal to assess the
Q-angle since the distance between the points disrupts the po-sitioning of both ixed and mobile arms of the instrument28,35. Braz, Goes and Carvalho16 validated the SPA for the assessment of body angles. Luo, Berglund and An36 consider the pressure sensing loor mat as a reliable method and recommend it for the measurement of the static distribution of plantar pressure. One possible limitation of this study was the change in sub-jects’ position during data collection. However, the investiga-tors sought to minimize this problem.
Biomechanical investigations in FP contribute to the pro-longation of their sport career, avoiding its interruption due to chronic-degenerative causes. Future studies should investigate biomechanical changes in beginner athletes to allow for early intervention, and evaluate the best intervention options; i.e., orthoses, posture correction or sport gesture appropriateness.
Conclusion
No association was detected between Q-angle values and the distribution of plantar pressure in NP. A weak and nega-tive correlation was found only between the Q-angle value and peak pressure in the right medium-foot among FP. However, the athletes showed reduced Q-angle values and higher pres-sure peaks in the lateral aspects of both feet, suggesting the presence of a genu varus malalignment in the knee and a su-pine distribution of plantar bases.
Table 3. Correlation between the Q-angle and the distribution of plantar pressures for different foot segments in study groups.
*p≤0.05. †For the distribution of plantar pressure in area E1 of NP (left lower limb), the Spearman correlation test was performed, which showed no association between variables (r=-0.006; p=0.96).
Groups Right Q-angle Groups Left Q-angle
FP Right lower limb r p FP Left lower limb r p
Foot area D1 -0.17 0.22 Foot area E1 -0.08 0.59
Foot area D2 0.02 0.88 Foot area E2 -0.17 0.23
Foot area D3 -0.32 0.02* Foot area E3 -0.14 0.34
Foot area D4 0.21 0.15 Foot area E4 0.24 0.09
NP Right lower limb r p NP Left lower limb r p
Foot area D1 0.00 1.00 Foot area E1† -
-Foot area D2 0.09 0.46 Foot area E2 0.04 0.72
Foot area D3 0.11 0.37 Foot area E3 -0.08 0.50
References
1. Goulart LF, Dias RMR, Altimari LR. Força isocinética de jogadores de futebol categoria sub-20: comparação entre diferentes posições de jogo. Rev Bras Cineantropom Desempenho Hum. 2007;9(2):165-9.
2. Ribeiro CZP, Akashi PMH, Sacco ICN, Pedrinelli A. Relationship between postural changes and injuries of the locomotor system in indoor soccer athletes. Rev Bras Med Esporte. 2003;9(2): 98-103.
3. Costa LOP, Samulski DM. Overtraining em atletas de alto nível - uma revisão literária. Rev Bras Ciênc Mov. 2005;13(2):123-34.
4. Fuller CW, Ekstrand J, Junge A, Andersen TE, Bahr R, Dvorak J, et al. Consensus statement on injury definitions and data collection procedures in studies of football (soccer) injuries. Br J Sports Med. 2006;40(3):193-201.
5. Watson ASW. Posture: introduction and its relationships to participation in sports. Rev Fisioter Univ São Paulo. 1997;4(1):1-46.
6. Belchior ACG, Araraki JC, Bevukaqua-Grossi D, Reis FA, Carvalho PTC. Efeitos na medida do ângulo Q com a contração isométrica voluntária máxima do músculo quadricipital. Rev Bras Med Esporte. 2006;12(1):6-10.
7. Tomsich DA, Nitz AJ, Threlkeld AJ, Shapiro R. Patellofemoral alignment: reliability. J Orthop Sports Phys Ther. 1996;23(3):200-8.
8. Livingston LA. The quadriceps angle: a review of the literature. J Orthop Sports Phys Ther. 1998;28(2):105-9.
9. Heiderscheit BC, Hamill J, Caldwell GE. Influence of Q-angle on lower-extremity running kinematics. J Orthop Sports Phys Ther. 2000;30(5):271-8.
10. Hamill J, Knutzen KM. Bases biomecânicas do movimento humano. São Paulo: Manole; 1999.
11. Schweitzer P, Miqüelluti D. Estudo do padrão postural de jogadores de futebol da categoria infantil. Fisioter Bras. 2005;6(6):419-23.
12. Abreu AV, Barbosa JRP, Coelho FJP. Alinhamento dos joelhos no plano frontal dos 12 aos 17 anos. Rev Bras Ortop. 1996;31(1):83-8.
13. Vieira TMM, Oliveira LF. Equilíbrio postural de atletas remadores. Rev Bras Med Esporte. 2006;12(3):135-8.
14. Gagey PM, Weber B. Posturologia: Regulação e distúrbios da posição ortostática. 2ª ed. São Paulo: Manole; 2000.
15. Pontes LM, Sousa MSC, Lima RT. Perfil dietético, estado nutricional e prevalência de obesidade centralizada em praticantes de futebol recreativo. Rev Bras Med Esporte. 2006;12(4): 201-5.
16. Braz RG, Goes FPD, Carvalho GA. Confiabilidade e validade de medidas angulares por meio do software para avaliação postural. Fisioter Mov. 2008;21(3):117-26.
17. France L, Nester C. Effect of errors in the identification of anatomical landmarks on the accuracy of Q angle values. Clin Biomech (Bristol, Avon). 2001;16(8):710-3.
18. Hopenfeld S. Propedêutica ortopédica: coluna e extremidades. São Paulo: Atheneu; 2002.
19. Kendall FP, McCreary EK, Provance PG. Músculos: provas e funções. São Paulo: Manole; 1995.
20. Pimenta LSM. A importância da liberação póstero-lateral no tratamento cirúrgico do pé torto congênito idiopático resistente: análise de 35 pés. Rev Bras Ortop. 1993;28(10):743-8.
21. Hebert S, Xavier R, Pardini Jr AG, Barros Filho TEP. Ortopedia e traumatologia: princípios e prática. 3ª ed. Porto Alegre: Artmed; 2003.
22. Herrington L, Nester C. Q-angle undervalued? The relationship between Q-angle and medio-lateral position of the patella. Clin Biomech (Bristol, Avon). 2004;19(10):1070-3.
23. Tillman MD, Bauer JA, Cauraugh JH, Trimble MH. Differences in lower extremity alignment between males and females: potential predisposing factors for knee injury. J Sports Med Phys Fitness. 2005;45(3):355-9.
24. Olerud C, Berg P. The variation of the Q angle with different positions of the foot. Clin Orthop Relat Res. 1984;191:162-5.
25. Hahn T, Foldspang A. The Q angle and sport. Scand J Med Sci Sports. 1997;7(1):43-8.
26. Ferreira EAG. Postura e controle postural: desenvolvimento e aplicação de método quantitativo de avaliação postural [tese]. São Paulo: Universidade de São Paulo; 2006.
27. Yaniv M, Becker T, Goldwirt M, Khamis S, Steinberg DM, Weintroub S. Prevalence of bowlegs among child and adolescent soccer players. Clin J Sport Med. 2006;16(5):392-6.
28. Woodland LH, Francis RS. Parameters and comparisons of the quadriceps angle of college-aged men and women in the supine and standing positions. Am J Sports Med. 1992;20(2):208-11.
29. Chaudhari AM, Hearn BK, Andriacchi TP. Sport-dependent variations in arm position during single-limb landing influence knee loading: implications for anterior cruciate ligament injury. Am J Sports Med. 2005;33(6):824-30.
30. Junge A, Dvorak J, Chomiak J, Peterson L, Graf-Bauman T. Medial history and physical findings in football players of different ages and skill levels. Am J Sports Med. 2000;28(5 Suppl):S16-21.
31. Hebert S, Xavier R, Pardini Jr AG, Barros Filho TEP. Ortopedia e traumatologia: princípios e prática. 3ª ed. Porto Alegre: Artmed; 2003.
32. Wong PL, Chamari K, Chaouachi A, Mao de W, Wisloff U, Hing Y. Difference in plantar pressure between the preferred and non-preferred feet in four soccer-related movements. Br J Sports Med. 2007;41(2):84-92.
33. Cavanagh PR, Rodgers MM. The arch index: a useful measure from footprints. J Biomech. 1987;20(5):547-51.
34. Gross MT, Foxworth JL. The role of foot orthoses as an intervention for patellofemoral pain. J Orthop Sports Phys Ther. 2003;33(11):661-70.
35. Sacco ICN, Alibert S, Queiroz BWC, Pripas D, Kieling I, Kimura AA, et al. Confiabilidade da fotogrametria em relação à goniometria para avaliação postural de membros inferiores. Rev Bras Fisioter. 2007;11(5):411-7.