with Functional Annotation, High Performance
Computing and Advanced Visualization
Xiaoquan Su1., Weihua Pan2., Baoxing Song1
, Jian Xu1, Kang Ning1*
1Shandong Key Laboratory of Energy Genetics, CAS Key Laboratory of Biofuels and BioEnergy Genome Center, Computational Biology Group of Single Cell Center, Qingdao Institute of Bioenergy and Bioprocess Technology, Chinese Academy of Sciences. Qingdao, People’s Republic of China,2School of Computer Science and Technology, University of Science and Technology of China, Hefei, Anhui Province, People’s Republic of China
Abstract
The metagenomic method directly sequences and analyses genome information from microbial communities. The main computational tasks for metagenomic analyses include taxonomical and functional structure analysis for all genomes in a microbial community (also referred to as a metagenomic sample). With the advancement of Next Generation Sequencing (NGS) techniques, the number of metagenomic samples and the data size for each sample are increasing rapidly. Current metagenomic analysis is both data- and computation- intensive, especially when there are many species in a metagenomic sample, and each has a large number of sequences. As such, metagenomic analyses require extensive computational power. The increasing analytical requirements further augment the challenges for computation analysis. In this work, we have proposed Parallel-META 2.0, a metagenomic analysis software package, to cope with such needs for efficient and fast analyses of taxonomical and functional structures for microbial communities. Parallel-META 2.0 is an extended and improved version of Parallel-META 1.0, which enhances the taxonomical analysis using multiple databases, improves computation efficiency by optimized parallel computing, and supports interactive visualization of results in multiple views. Furthermore, it enables functional analysis for metagenomic samples including short-reads assembly, gene prediction and functional annotation. Therefore, it could provide accurate taxonomical and functional analyses of the metagenomic samples in high-throughput manner and on large scale.
Citation:Su X, Pan W, Song B, Xu J, Ning K (2014) Parallel-META 2.0: Enhanced Metagenomic Data Analysis with Functional Annotation, High Performance Computing and Advanced Visualization. PLoS ONE 9(3): e89323. doi:10.1371/journal.pone.0089323
Editor:Zhang Zhang, Beijing Institute of Genomics, Chinese Academy of Sciences, China ReceivedOctober 12, 2013;AcceptedJanuary 18, 2014;PublishedMarch 3, 2014
Copyright:ß2014 Su et al. This is an open-access article distributed under the terms of the Creative Commons Attribution License, which permits unrestricted use, distribution, and reproduction in any medium, provided the original author and source are credited.
Funding:This work is supported in part by Chinese Academy of Sciences’ e-Science grant INFO-115-D01-Z006, Ministry of Science and Technology’s high-tech (863) grant 2009AA02Z310 & microbial database, as well as National Science Foundation of China grant 61103167, 31271410 and 61303161. The funders had no role in study design, data collection and analysis, decision to publish, or preparation of the manuscript.
Competing Interests:The authors have declared that no competing interests exist. * E-mail: [email protected]
.These authors contributed equally to this work.
Background
The total number of microbial cells on earth is huge: approximate estimation of their number is 1030 [1], and the genomes of these vastly unknown microbes might contain a large number of novel genes with very important functions. However, more than 99% of microbe species remain unknown, un-isolated or un-culturable [2], making traditional isolation and cultivation process non-applicable. Metagenomics refer to the study of genetic materials recovered directly from environmental samples [3], which has made it possible for better understanding of microbial diversity as well as their functions and interactions. The broad applications of metagenomic research, including environmental sciences, bioenergy research and health care, have made it an increasingly popular research area.
There are two major analysis tasks for metagenomic samples: taxonomical and functional analyses (Table 1). For taxonomical analyses, early metagenomic survey of microbial communities focused on 16S ribosomal RNA sequences which are relatively short, often conserved within a species while different between species. The 16S rRNA-based metagenomic survey has already
that integrate taxonomical and functional analysis of metagenomic samples.
At present one critical bottleneck in metagenomic analysis is the efficiency of data process because of the slow analysis speed. As metagenomic data analysis task is both data- and computation-intensive, high-performance computing is needed, especially when (1) the dataset size is huge for a sample, (2) a project involves many metagenomic samples and (3) the analyses are complex and time-sensitive. Moreover, the increasing number of metagenomic projects usually requires the comparison of different samples. Yet current methods are limited by their low efficiency [7,10,11]. Thus, high-performance computational techniques are needed to speed-up analysis, without compromising the analysis accuracy.
In this work, we have designed Parallel-META 2.0 for taxonomical and functional analysis of metagenomic samples based on High Performance Computing (HPC). Parallel-META 2.0 is the improved version of Parallel-META 1.0 [17] with several significant updates. Firstly, the optimized parallel computing and I/O strategy achieved more than 12 times speed-up compared to PHYLOSHOP [7], 3 times faster than MetaPhlAn [18], and 1.4 times faster than version 1.0. Secondly, in version 2.0, the taxonomical analysis has been enhanced by (a) supporting 18S rRNA extraction & analysis for Eukaryote, (b) extending to multiple reference database annotation and (c) providing taxono-mical comparison between multiple samples. Thirdly, Parallel-META 2.0 enables functional analysis based on both GO-term (Gene Ontology term) annotation [19] and SEED [20] annotation methods. Finally, results could be visualized and compared from different angles, rather than the plain text by version 1.0. This visualization of results makes the structures of microbial commu-nities easier for human reading, and thus could simplify in-depth manual analyses.
Parallel-META 2.0 software package is available at http:// www.computationalbioenergy.org/parallel-meta.html, which is released under MIT license. We have also built a project about this work in GitHub and uploaded the source code, manual, materials and example datasets onto it. The link of Parallel-META 2.0 is at https://github.com/Comp-Bio-Group/Parallel-META. As of now, this Parallel-META software package and the corresponding data analysis platform have supported more than 30 metagenomic data analysis projects around the world.
Methods
In this work we have developed the Parallel-META 2.0 package to analyze the metagenomic samples by incorporating several novel functions including improved computational engine based on High-Performance Computing (HPC), enhanced methods for taxonomical structure interpretation, functional analysis, as well as
the data visualization techniques. The overall framework is illustrated inFigure 1.
High Performance Computing
Metagenomic data analysis is both data- and computation-intensive. To meet the needs for efficient process, we have improved the High-Performance Computing (HPC) of Parallel-META software [14] based on GPU and multi-core CPU which enabled the highly-efficient metagenomic analysis in both taxonomical and functional analyses.
Parallel-META [14] software processes the metagenomic taxonomical analysis with shotgun sequencing data in 3 steps: (1) 16S rRNA extraction: To predict and extract 16S rRNA fragments from the input data by Hidden Markov Model (also referred to as HMM) algorithm [21,22] with the HMM model built from all 16S rRNA sequences of Silva Database [23]. (2) 16S rRNA mapping: To identify each component of the microbial community by mapping all 16S rRNA fragments to reference database by parallel computing. (3) Taxonomical annotation: To parse out taxonomical and phylogenetic structure of the microbial community.
For highly efficient parallel computing algorithm design and deep optimization, POSIX thread and OpenMP techniques, together with CUDA (Compute Unified Device Architecture) programming techniques based on Linux C++have been used in the computing engine of Parallel-META 2.0 for 16S/18S rRNA & gene prediction and annotation. In addition, this new version of computing engine also has optimized I/O efficiency, which is one of key features for high performance computation.
1.1 HMM based 16S/18S rRNA and gene prediction. In Parallel-META 2.0, the 16S/18S rRNA fragments and genes are predicted and extracted from the input data based on Hidden Markov Model algorithm [22]. For taxonomical analysis, 16S/18S rRNA fragment extraction is realized by GPU based HMM [21,24,25] with parallel computing on GPU, while the gene prediction is realized by FragGeneScan [26].
1.2 Parallel computing for BLAST based sequence mapping. The extracted 16S/18S rRNA fragments and gene sequences from the input data are then mapped to the reference database for identification and annotation, which is a time consuming process. To reduce the time cost of database search, we have implemented the parallel sequence mapping in Parallel-META 2.0 using OpenMP and CUDA. Input reads are divided into smaller sets, and then the mapping task of each set is assigned to independent thread, which could be processed on different processors or cores in parallel.
1.3 Input & Output strategy. 16S/18S rRNA sequences exist in both the original reads and the complementary reads of input shotgun sequencing data. After loaded the original reads into Table 1.The comparison of properties of taxonomical and functional analyses for metagenomic samples.
Features Taxonomical analysis Functional analysis
Input data types Pyro-sequencing or shotgun sequencing data shotgun sequencing data
Basic object sequences 16S rRNA sequences Gene sequences
Reference databases GreenGenes, RDP, Silva, etc. NCBI NR, SEED. etc.
Basic results Taxonomy structure (Qualitative and quantitative) Functional hierarchy (Qualitative)
Extended results Sample taxonomical structure comparison Sample functional composition comparison, Functional and pathway enrichment
Applications Novel strain identification Gene discovery
hash table of RAM, all computation processes, including the complementary reads transformation, 16S/18S rRNA prediction and extraction, are processed in the RAM rather than extern I/O operation on file system and Hard Disk Drivers (also referred to as HDD).
Enhanced Taxonomical analysis
Based on computing method of version 1.0 described in section ‘‘High Performance Computing’’ Parallel-META 2.0 improves all 3 steps of taxonomical analyses as below:
2.1 16S/18S rRNA fragment extraction. In addition to that Parallel-META 1.0 can only analyze Bacteria domain by 16S rRNA, In 2.0, Eukaryote domain could also be handled by adding the 18S rRNA extraction by the Hidden Markov Model (HMM) algorithm [22] with HMM model built based on Silva Database [23].
2.2 Multiple databases. Reference databases are used to identify and classify the taxonomical components for the microbial community samples based on mapped 16S/18S rRNA reads. Reference database schemes of Parallel-META 2.0 is an extension from a single database of previous version (1.0 using only GreenGenes [27]) to multi-database including GreenGenes, Silva [23], RDP [28] and Oral Core [29] (Table 2shows the sequence
number information). Since the accuracy of the metagenomic analysis results heavily depends on the completeness and correctness of reference databases, to this end, multi-database is enabled for 2 reasons: (a) Each database is for specific purpose: the GreenGenes, RDP and Silva databases are considered to be relatively complete yet general, and Oral Core database is specifically designed for species in oral environment with more details; (b) Community structure of metagenomic sample gener-ated based on multiple databases can also be integrgener-ated to mitigate
Table 2.Information about multiple 16S rRNA reference databases.
Reference Database #of Sequence
Utilization in Parallel-META
GreenGenes 4939 1.0 and 2.0
RDP 8423 2.0 only
Silva 14975 2.0 only
Oral Core 1046 2.0 only
doi:10.1371/journal.pone.0089323.t002
Figure 1. The overall framework of Parallel-META 2.0.
the bias and incompleteness caused by using single reference database.
2.3 Multi-sample comparison. Parallel-META 2.0 con-tains new module to qualitatively and quantitatively compare the taxonomical structures among metagenomic samples on different biology levels (from domain level to species level). The comparison results could also be elucidated in the ‘‘global view’’ and ‘‘sub-sample view’’ described in section ‘‘Interactive visualization’’.
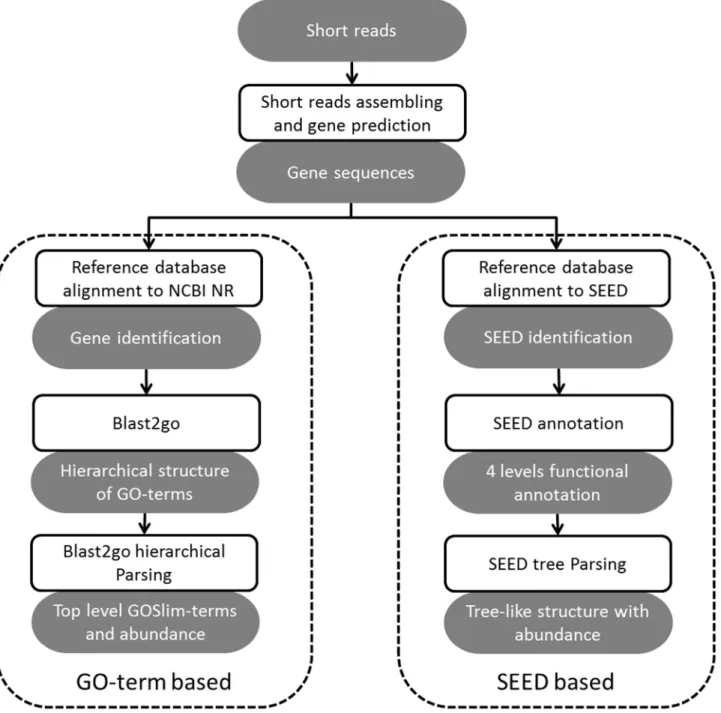
Functional analysis
In Parallel-META 2.0, we enable functional analysis of metagenomic samples based on two computational engines: one based on GO-term annotation, another based on SEED annota-tion, both of which can be divided into 3 steps (Figure 2): (1)
short-reads assembly and gene prediction, (2) gene identification and (3) functional annotation followed by functional structures interpretation of microbial communities.
3.1 Short-reads assembly and gene prediction. Short reads in shotgun sequencing data from input metagenomic samples need to be assembled into longer contigs for gene sequence prediction. Here Velvet [30] is chosen as the short reads assembler which plays the role as a module in Parallel-META 2.0, and then gene sequences are predicted based on Hidden Markov Model (HMM) algorithm [22,26]. Note that although there are some other assembly tools such as ALLPATH-LG [13] that could outperform Velvet, we have still used Velvet assembler in this study as it is widely used in the area.
Figure 2. The dual computational engines for functional analysis in Parallel-META 2.0.
3.2 Gene identification. All predicted gene sequences from the assembled contigs are then mapped to the reference database for their identification. In Parallel-META 2.0, the gene identifi-cation is implemented by two computational engines with different reference database: GO-term based that maps gene sequences to NCBI NR database (http://www.ncbi.nlm.nih.gov/), and SEED based that maps gene sequences to SEED [16] database. As the database alignment is time consuming, this process is parallelized to achieve high efficiency (refer to section 1.2 for details).
3.3 Functional annotation. Two kinds of methods are used in functional annotation as gene identification, GO-term based and SEED based. For GO-term based analysis, we use blast2go [15] to get all the GO-terms in the sample. GOSlim-terms (manually curated by experts, OBO version 1.2, http://www. geneontology.org/GO_slims/goslim_generic.obo) with important biological meanings would be our focus. All GO-terms are tracked to higher levels to parse out the GOSlim-terms, and most abundant GOSlim-terms are then extracted with abundance values. For SEED based analysis, each gene sequence can be assigned to exactly 4 levels of SEED [20] annotations. This tree-like functional structure with abundance values can be visualized in the same way as the taxonomical structure (refer to section 4.2 for details).
Interactive visualization
We have used several visualization techniques, such as HTML5, SVG and JavaScript, in Parallel-META 2.0 for analytical result visualization (Figure 3), which could either be browsed by online visualization tool MetaSee [31], or by standalone web browsers. Based on these techniques, Parallel-META 2.0 supports (a) interactive visualization of the taxonomical & functional commu-nity structure (b) smooth change among different angles for the same sample and (c) comparison of different samples in a single interface. These visualization functionalities are described as below:
4.1 Taxonomical structure visualization. Taxonomical visualization shows the taxonomical structure of a microbial community in the following angles:
(1) Global view is a taxonomical hierarchical tree that contains all taxa and their proportions in single or multiple samples. Thus it shows the whole profile with all samples been compared (Figure 3 (A)). (2) Sample view represents the community taxonomical structure in a dynamic multi-layer pie-chart, which also supports
smooth shift among multi-sample comparisons of their taxonomi-cal community structures (Figure 3 (B)). The sample view is implemented partly by the Krona software [32]. (3) Sub-sample view is a detailed ‘‘sample view’’ that focuses on one node (a specific taxa) in the ‘‘global view’’ taxonomical hierarchical tree structure, which is useful for comparing different samples for a specific taxa (Figure 3 (C)). (4) Phylogenetic view is a phylogenetic tree based on 16S rRNA reads from the metage-nomic sample data, which elucidates the evolutionary relationship of all microbes in a microbial community sample (Figure 3 (D)). 4.2 Functional structure visualization. Functional visual-ization reflects the functional structure of a microbial community. For SEED based functional analysis, as the microbial community structure can be parsed into 4-level-annotations, this hierarchal annotation structure could be visualized in the same way as the taxonomical visualization in ‘‘Sample view’’ (Figure 3 (E)). For GO-term based analysis, the GO-terms are illustrated into a pie-chart containing each function’s proportional information using SVG (Figure 3 (F))..
Results
Datasets and Experiment design
In this work we have evaluated the performance of Parallel-META 2.0 in taxonomical and functional analysis based on both simulated datasets and real datasets. All experiments were completed on a desktop sever with dual Intel Xeon X5650 (12 cores, supporting 24 threads in total), 72 GB RAM and NVIDIA Tesla C2075 GPU (448 processors, 6 GB on board memory).
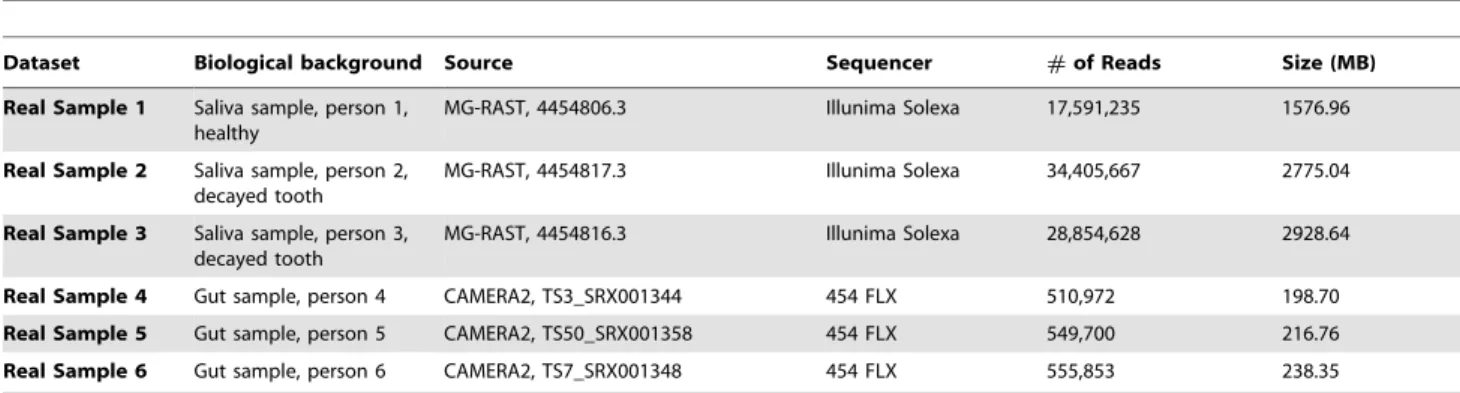
For the real metagenomic data, we have collected 3 human saliva metagenomic samples [17] and 3 human gut samples [33] from different people (Table 3). Saliva samples were sequenced by Illumina Solexa GA-IIx into pair-end 100 bp reads, and sequences of gut samples were produced by 454 FLX.
The simulated datasets contained 10 samples, which were constructed based on human oral related microbial genomes from HOMD database [34], with Fusobacterium periodonticum, Veillonella dispar, Porphyromonas gingivalis, Prevotella tannerae, Veillonella sp., Rothia
dentocariosa, Actinomyces odontolyticus, Megasphaera micronuciformisetc. as
most abundant species. All simulated datasets were created by metagenomic data simulator Dwgsim (Whole Genome Simulation. http://sourceforge.net/apps/mediawiki/dnaa/index.php?title = Whole_ Genome_Simulation) based on randomly selected genomes above with
Figure 3. The visualization effects for different kinds of results.(A) Global view, (B) Sample view, (C) Sub-sample view and (D) Phylogenetic
view, (E) Sample view for SEED based functional analysis, and (F) GO-term based analysis. doi:10.1371/journal.pone.0089323.g003
Table 3.Information about real metagenomic datasets.
Dataset Biological background Source Sequencer #of Reads Size (MB)
Real Sample 1 Saliva sample, person 1, healthy
MG-RAST, 4454806.3 Illunima Solexa 17,591,235 1576.96
Real Sample 2 Saliva sample, person 2, decayed tooth
MG-RAST, 4454817.3 Illunima Solexa 34,405,667 2775.04
Real Sample 3 Saliva sample, person 3, decayed tooth
MG-RAST, 4454816.3 Illunima Solexa 28,854,628 2928.64
Real Sample 4 Gut sample, person 4 CAMERA2, TS3_SRX001344 454 FLX 510,972 198.70 Real Sample 5 Gut sample, person 5 CAMERA2, TS50_SRX001358 454 FLX 549,700 216.76 Real Sample 6 Gut sample, person 6 CAMERA2, TS7_SRX001348 454 FLX 555,853 238.35
suitable abundances (most abundant 2,3 species are manually defined, while others are defined randomly). And these genome sequences were translated into short reads with 100 bp length and 1% sequencing errors.
Table 4illustrated the basic information of simulated datasets, and the detail information including genome names and abundance value are available in supplementary materials (Table S1 (A)–(J)inFile S1).
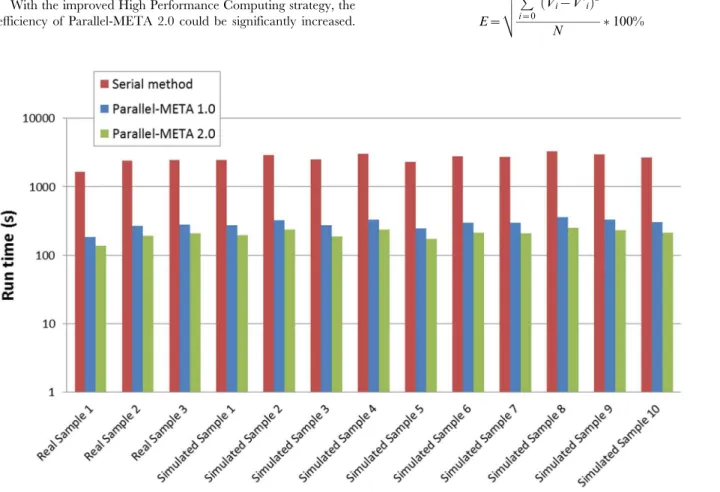
Efficiency evaluation
With the improved High Performance Computing strategy, the efficiency of Parallel-META 2.0 could be significantly increased.
In this part we compared the two version of Parallel-META, as well as two other methods (PHYLOSHOP [7] and MetaPhlAn [18]) based on 3 real saliva samples inTable 3(real sample 1, 2 and 3) and all 10 simulated samples inTable 4. All tests were performed on the same hardware platform to evaluate the acceleration in running time (refer toTable S2in File S1for detailed parameter configuration). From results inFigure 4we could see that in the same condition, version 2.0 could achieve an average speed up of 12.76 to PHYLOSHOP, 3.01 to MetaPhlAn, and 1.41 to Parallel-META version 1.0. This advantage in processing efficiency would enable the in-depth analysis among massive metagenomic data. In addition, there was no significant difference between real samples and simulated samples on process efficiency (Figure 4).
Taxonomical Analysis and Visualization
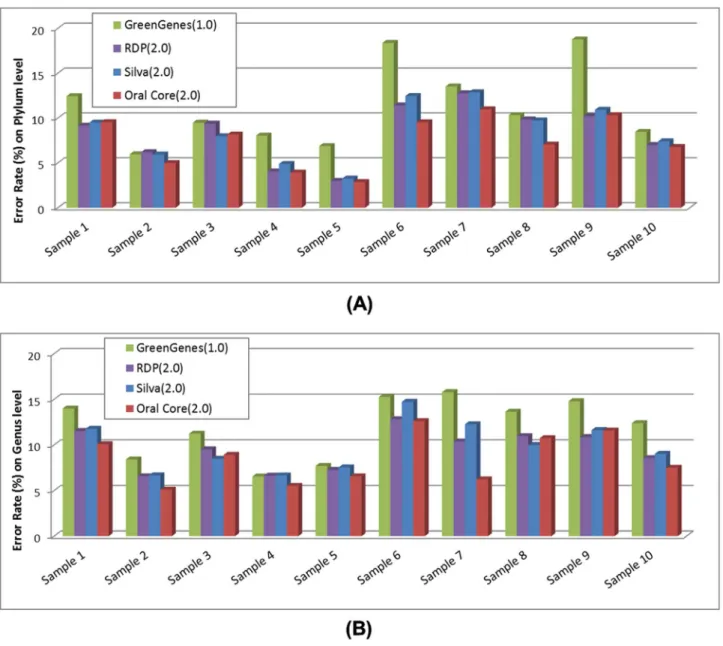
Error rate test with simulated data. In this experiment, we tested the error rate of taxonomical analysis on both phylum and genus level by using 10 simulated datasets (Table 4). We defined the error rate for taxonomical analysis as below:
Assume that there wereNtaxa (Ti, i = 0 to N-1) at a specified taxonomical level (phylum or genus) in a simulated sample.Viwas the abundance value of taxaTiin the simulated data, whileV9iwas the abundance value in the analysis result for taxaTi.
Then for this simulated data, the error rate E could be calculated as
E~
ffiffiffiffiffiffiffiffiffiffiffiffiffiffiffiffiffiffiffiffiffiffiffiffiffiffiffiffiffiffiffi
P
N{1
i~0
Vi{V’i ð Þ2
N v u u u t
100% ð1Þ
Table 4.Information about simulated metagenomic datasets.
Dataset #of Reads Size (MB) #of Strains Simulated Sample 1 18,936,022 2,180.02 10
Simulated Sample 2 21,860,962 2,517.56 14 Simulated Sample 3 17,702,336 2,042.55 11 Simulated Sample 4 21,850,592 2,518.66 13 Simulated Sample 5 17,003,492 1,955.71 10 Simulated Sample 6 20,156,006 2,328.32 12 Simulated Sample 7 19,700,952 2,270.77 11 Simulated Sample 8 23,718,286 2,732.70 13 Simulated Sample 9 21,6,68,126 2,498.10 13 Simulated Sample 10 20,345,442 2,337.97 11
Refer toTable S1(A)–(J) inFile S1for detailed strains and their relative abundances for these simulated samples.
doi:10.1371/journal.pone.0089323.t004
Figure 4. Running time of Parallel-META 1.0 and 2.0 with the same datasets and reference database (Greengenes).The Y-axis is in
10-based log scale.
which essentially calculated the Euclidean distance between predicted and actual taxonomical structures of the microbial community. Therefore, largerEvalue indicates higher error rate. Currently, taxonomical analysis of Parallel-META 2.0 has been enhanced by using multiple reference databases including GeneGenes, RDP, Silva and Oral Core, rather than the single
reference database of GreenGenes in version 1.0. In this work results by Parallel-META 1.0 with database GreenGenes were considered as ‘‘control results’’, and the comparison among results based on different databases was conducted to show the improved accuracy of Parallel-META 2.0 at both phylum level genus level usingFormula (1).
Figure 5. Error rate of taxonomical analysis of Parallel-META 1.0 and 2.0 with simulated data based on different databases at (A) phylum level and (B) genus level.
doi:10.1371/journal.pone.0089323.g005
Table 5.Average error rate of taxonomical analysis of Parallel-META 2.0.
Reference Database Average error rate (%) at Phylum level Average error rate (%) at Genus level
GreenGenes 11.22 11.97
RDP 8.30 9.51
Sliva 8.49 9.87
Oral Core 7.40 8.48
The error rates were illustrated inFigure 5. From the results we could observe that the error rates of taxonomical analysis at phylum and genus levels could be reduced with the extended sets of reference databases. In Table 5 the average error rates of 7.40% at phylum level and 8.48% at genus level also indicated the reliability of the improved taxonomical analysis of Parallel-META 2.0. In addition, as all species of the simulated samples were from human oral microbial genomes (Table S1 inFile S1), results based on the reference database Oral Core could achieve the lowest error rate benefited from the optimized annotations of oral environment microbes.
Multiple Sample Comparison and Visualization. We also compared the taxonomical structure of 3 real saliva datasets (Table 3) and 10 simulated datasets (Table 4) by Parallel-META 2.0. All datasets’ community structures were drawn into one tree-like global view (refer to section 4.1 in ‘‘Methods’’ for details) for comparison. Abundance values were illustrated in bar-chart of the global view (Figure 6). Besides, sub-sample view of all samples could also be linked by the corresponding taxa names in the tree. Among the 3 real saliva samples, we have found that the most abundant taxa in sample 1 (healthy saliva sample) included
Flavobacteria, while the most abundant taxa in sample 2 and 3
(decayed saliva samples) included Clostridia and Bacillales. These results showed that there was a significant difference in most abundant taxa when comparing healthy and decayed saliva
metagenomic samples, indicating that the microbial community structures could represent oral health status of the hosts [35].
Functional Analysis
In this part, all 6 real samples (saliva and gut samples in
Table 3) and 3 simulated samples (simulated sample 1, 2 and 3 of
Table 4) were used to test both GO-term based and SEED based functional analysis. Results inTable 6,Figure 7andFigure 8
(also refer to supplementary materialsTable S3andTable S4in
File S1 for detailed statistical information) have shown the functional structure patterns of these samples as below:
(1) Firstly, results showed that in GO-term based analysis (Figure 7, Table S3inFile S1), the most abundant terms of both real and simulated data from oral environment were consistentlyMetabolic Process, Biosynthetic Process, DNA metabolic
process, etc., for Biological Process,DNA binding, Catalytic Activity,
Nucleotide Binding, etc., for Molecular Function, and Cytoplasm
for Cellular Component. This indicated that the simulated data was similar to real data as regard to functional profile. However, the fact that there exist larger variations among real samples than those among simulated samples indirectly proved the needs for real data: the variation in functional profiles could not yet be fully characterized by simulated data only. In SEED based analysis results (Figure 8, Table S4in
File S1), the most abundant functions of both real and simulated data from oral environment included DNA
Figure 6. Multiple sample comparison by Parallel-META 2.0.
metabolism, Carbohydrates and Protein Metabolism, showing high consistency between real samples and simulated samples. (2) Secondly, real samples from gut environment (Real sample 4,
5, 6) had Carbohydrates, DNA metabolism, Iron acquisition and
metabolism and Amino Acids and Derivatives as most abundant
functions, which had also been observed inPeter J. Turnbaugh et
al., 2009[33].
(3) Thirdly, functional profiles of simulated samples (Simulated sample 1, 2, 3) were more similar to real samples (Real sample 1, 2, 3) from oral environment than gut environment samples (Real sample 4, 5, 6), considering both GO-termed based and SEED based annotations, especially inDNA Metabolic process,
Catalytic Activity, Biosynthetic Process for GO-term based
annotation, andDNA Metabolism, Carbohydrates, Nucleosides and
Nucleotides for SEED based annotation. These results also
elucidated the consistency between real and simulated datasets, as well as that between different annotation methods.
Conclusion and Discussions
In this work, we have proposed Parallel-META 2.0, a powerful metagenomic analysis package based on the joint-force of (a) advanced and comprehensive methods/databases for taxonomical and functional analysis of metagenomic samples, (b) High
Figure 7. Functional annotation results by GO-term based method.
Performance Computing and (c) cutting-edge interactive visuali-zation technique.
Our preliminary tests on both simulated and real datasets have shown that this software is not only accurate and fast, but also with significantly improved user experience to facilitate in-depth analysis and comparison of microbial community samples.
(1) Overall computing performance. Compared to version 1.0, Parallel-META 2.0 has enhanced computing engine in 16S/ 18S rRNA and gene prediction and sequence alignment module by in-depth optimization in programming and algorithm implementation. Moreover, combined with the improved I/O strategy, Parallel-META 2.0 already has obvious progress in computing speed compared to the
Figure 8. Functional annotation results by SEED based method.
previous version. As currently the HDD I/O bandwidth via SATA bus is a bottleneck in the system, I/O throughput could be enhanced significantly by Solid State Disk.
(2) Improved taxonomical annotation based on multiple data-bases. New version of Parallel-META provides a wider range with 16S and 18S rRNA extraction and analysis for Bacteria and Eukaryote domains, and multiple reference databases for better analysis precision, as well as suitable for specialized users. In addition, multiple-sample comparison enables the identification of common structure among microbial commu-nities.
(3) Functional annotation of metagenomic samples. Parallel-META 2.0 has included functional annotation modules, so that it could cover a more complete area of metagenomic data analysis. With the importance of functional interpretation of metagenome been understood, as well as more and more WGS (Whole Genome Sequencing) metagenomic sample datasets been generated, these analyses would become increasingly important.
(4) Visualization of analysis results. Users experience could be largely improved by the friendly displayed interactive graphs from various angles of the microbial communities, including the global taxonomical structure, comparison on specified taxonomical levels, phylogenetic relationships, GO-term based and SEED based annotations.
As such, Parallel-META 2.0 has already served for more than 30 research groups worldwide. And it can be foreseen that this
software could benefit an even broader area of metagenomic research.
Current Parallel-META is a stand-alone method for analysis of taxonomical and functional structure of the metagenomic samples. The efficiency and throughput can be reinforced by clouding computing in further works. On a broader scale, Parallel-META 2.0 could be combined with metagenomic database for more in-depth and large-scale data-mining for analysis of metagenomic samples, by providing efficient method for extracting and comparing taxonomical or functional features of microbial communities.
Supporting Information
File S1 Supplementary files Tables S1–S4 for support information.
(DOCX)
Acknowledgments
We thank NVIDIA for providing us with the high-performance computing hardware through QIBEBT-NVIDIA CUDA Research Center.
Author Contributions
Conceived and designed the experiments: XS KN. Performed the experiments: XS WP. Analyzed the data: XS WP JX. Contributed reagents/materials/analysis tools: XS WP BS. Wrote the paper: XS KN WP.
References
1. Proctor GN (1994) Mathematics of microbial plasmid instability and subsequent differential growth of plasmid-free and plasmid-containing cells, relevant to the analysis of experimental colony number data. Plasmid 32: 101–130. 2. Jurkowski A, Reid AH, Labov JB (2007) Metagenomics: a call for bringing a new
science into the classroom (while it’s still new). CBE Life Sci Educ 6: 260–265. 3. Eisen JA (2007) Environmental shotgun sequencing: its potential and challenges
for studying the hidden world of microbes. PLoS Biol 5: e82.
4. Venter JC, Remington K, Heidelberg JF, Halpern AL, Rusch D, et al. (2004) Environmental genome shotgun sequencing of the Sargasso Sea. Science 304: 66–74.
5. Tyson GW, Chapman J, Hugenholtz P, Allen EE, Ram RJ, et al. (2004) Community structure and metabolism through reconstruction of microbial genomes from the environment. Nature 428: 37–43.
6. Arumugam M, Raes J, Pelletier E, Le Paslier D, Yamada T, et al. (2011) Enterotypes of the human gut microbiome. Nature 473: 174–180.
7. Shah N, Tang H, Doak TG, Ye Y (2011) Comparing Bacterial Communities Inferred from 16S rRNA Gene Sequencing and Shotgun Metagenomics. Pac Symp Biocomput: 165–176.
8. Schloss PD, Westcott SL, Ryabin T, Hall JR, Hartmann M, et al. (2009) Introducing mothur: open-source, platform-independent, community-supported software for describing and comparing microbial communities. Appl Environ Microbiol 75: 7537–7541.
9. Caporaso JG, Kuczynski J, Stombaugh J, Bittinger K, Bushman FD, et al. (2010) QIIME allows analysis of high-throughput community sequencing data. Nat Methods 7: 335–336.
10. Huson DH, Auch AF, Qi J, Schuster SC (2007) MEGAN analysis of metagenomic data. Genome Res 17: 377–386.
11. Krause L, Diaz NN, Goesmann A, Kelley S, Nattkemper TW, et al. (2008) Phylogenetic classification of short environmental DNA fragments. Nucleic Acids Res 36: 2230–2239.
Table 6.Statistical results of Parallel-META 2.0 functional analysis.
Dataset
#of Read contributing to
Predicted Gene #of GOSlim terms
#of Predicted Genes (from SEED)
Real Sample 1 17,591,235 21,975 1,462
Real Sample 2 28,854,628 933,398 27,927
Real Sample 3 34,405,667 467,332 22,833
Real Sample 4 510,972 318,408 19,640
Real Sample 5 549,700 262,887 15,099
Real Sample 6 555,853 350,125 21,488
Simulated Sample 1 18,936,022 182,120 8,664
Simulated Sample 2 21,860,962 277,897 14,046
Simulated Sample 3 17,702,336 199,097 10,126
Refer toTable S3andTable S4inFile S1for details of results on these samples. Notice that as many of the speciesd in real samples do not have complete genome sequences, the expected number of genes that could be predicted is hard to estimate for these samples.
12. Monzoorul Haque M, Ghosh TS, Komanduri D, Mande SS (2009) SOrt-ITEMS: Sequence orthology based approach for improved taxonomic estimation of metagenomic sequences. Bioinformatics 25: 1722–1730. 13. Gnerre S, Maccallum I, Przybylski D, Ribeiro FJ, Burton JN, et al. (2011)
High-quality draft assemblies of mammalian genomes from massively parallel sequence data. Proc Natl Acad Sci U S A 108: 1513–1518.
14. Peng Y, Leung HC, Yiu SM, Chin FY (2012) IDBA-UD: a de novo assembler for single-cell and metagenomic sequencing data with highly uneven depth. Bioinformatics 28: 1420–1428.
15. Glass EM, Wilkening J, Wilke A, Antonopoulos D, Meyer F (2010) Using the metagenomics RAST server (MG-RAST) for analyzing shotgun metagenomes. Cold Spring Harb Protoc 2010: pdb prot5368.
16. Seshadri R, Kravitz SA, Smarr L, Gilna P, Frazier M (2007) CAMERA: a community resource for metagenomics. PLoS Biol 5: e75.
17. Su X, Xu J, Ning K (2012) Parallel-META: efficient metagenomic data analysis based on high-performance computation. BMC Systems Biology 6: S16. 18. Segata N, Waldron L, Ballarini A, Narasimhan V, Jousson O, et al. (2012)
Metagenomic microbial community profiling using unique clade-specific marker genes. Nat Methods 9: 811–814.
19. Conesa A, Gotz S, Garcia-Gomez JM, Terol J, Talon M, et al. (2005) Blast2GO: a universal tool for annotation, visualization and analysis in functional genomics research. Bioinformatics 21: 3674–3676.
20. Overbeek R, Begley T, Butler RM, Choudhuri JV, Chuang HY, et al. (2005) The subsystems approach to genome annotation and its use in the project to annotate 1000 genomes. Nucleic Acids Res 33: 5691–5702.
21. Johnson LS, Eddy SR, Portugaly E (2010) Hidden Markov model speed heuristic and iterative HMM search procedure. BMC Bioinformatics 11: 431. 22. Rabiner LR (1989) A tutorial on hidden Markov models and selected
applications in speech recognition. Proceedings of the IEEE 77: 257–286. 23. Pruesse E, Quast C, Knittel K, Fuchs BM, Ludwig W, et al. (2007) SILVA: a
comprehensive online resource for quality checked and aligned ribosomal RNA sequence data compatible with ARB. Nucleic Acids Res 35: 7188–7196.
24. Walters JP, Balu V, Kompalli S, Chaudhary V (2009) Evaluating the use of GPUs in Liver Image Segmentation and HMMER Database Searches. 2009 Ieee International Symposium on Parallel & Distributed Processing, Vols 1–5: 1010–1021.
25. Sun YT, Li P, Gu GC, Wen Y, Liu Y, et al. (2009) Accelerating HMMer on FPGAs Using Systolic Array Based Architecture. 2009 Ieee International Symposium on Parallel & Distributed Processing, Vols 1–5: 1570–1577. 26. Rho M, Tang H, Ye Y (2010) FragGeneScan: predicting genes in short and
error-prone reads. Nucleic Acids Res 38: e191.
27. DeSantis TZ, Hugenholtz P, Larsen N, Rojas M, Brodie EL, et al. (2006) Greengenes, a chimera-checked 16S rRNA gene database and workbench compatible with ARB. Appl Environ Microbiol 72: 5069–5072.
28. Cole JR, Wang Q, Cardenas E, Fish J, Chai B, et al. (2009) The Ribosomal Database Project: improved alignments and new tools for rRNA analysis. Nucleic Acids Res 37: D141–145.
29. Griffen AL, Beall CJ, Firestone ND, Gross EL, Difranco JM, et al. (2011) CORE: a phylogenetically-curated 16S rDNA database of the core oral microbiome. PLoS One 6: e19051.
30. Zerbino DR, Birney E (2008) Velvet: algorithms for de novo short read assembly using de Bruijn graphs. Genome Res 18: 821–829.
31. Song B, Su X, Xu J, Ning K (2012) MetaSee: An Interactive and Extendable Visualization Toolbox for Metagenomic Sample Analysis and Comparison. PLoS One 7: e48998.
32. Ondov BD, Bergman NH, Phillippy AM (2011) Interactive metagenomic visualization in a Web browser. BMC Bioinformatics 12: 385.
33. Turnbaugh PJ, Hamady M, Yatsunenko T, Cantarel BL, Duncan A, et al. (2009) A core gut microbiome in obese and lean twins. Nature 457: 480–484. 34. Chen T, Yu WH, Izard J, Baranova OV, Lakshmanan A, et al. (2010) The
Human Oral Microbiome Database: a web accessible resource for investigating oral microbe taxonomic and genomic information. Database (Oxford) 2010: baq013.