JOURNAL
OF BIOMEDICINE
International Journal of BioMedicine 3(1) (2013) 32-40Shape and Volume Restoring Phenomena in Human Erythrocyte
Suspension under Low Ion Strength Conditions
Sergey V. Rudenko, PhD¹*, Igor A. Zupanets, PhD, ScD²
1
Institute for Problems of Cryobiology and Cryomedicine, National Academy of Sciences of the Ukraine,
2
National University of Pharmacy, Kharkov, Ukraine
Abstract
In this study, the earlier used method to measure the dynamics of shape changes in red blood cells (RBCs), based on an analysis
of light luctuations in the suspension, was modiied to allow for the simultaneous recording of cell volume changes after appropriate recalculation of the raw absorbance and shape index data. With this improved methodology, we investigated the morphological and volume responses triggered by cell environment changes. In a low ionic strength medium (LIS), the characteristic triphasic shape changes
(morphological response, MR) were accompanied with a gradual shrinking of the cells without any re-swelling phase. The addition of
hyperosmotic NaCl during the terminal MR phase restored the discoid RBC shape inducing cell swelling resembling regulatory volume increase. The cell volume was greater than that before salt addition; however, it was lower than the initial isotonic cell volume. This
re-swelling phase was inhibited by the external DIDS, acetozolamide and bicarbonate, and was slightly dependent upon pH ranging from
5 to 7.2. The analysis shows that chloride-induced re-swelling cannot be directly explained by the reversion of OH- or HCO
3
- gradients
which drive the Cl- inside the cells against the concentration gradient, and indicates the signiicant role of the external bicarbonate ions
in shape and volume responses in LIS.
Key words: red blood cells; morphological response; low ionic strength; DIDS; aluminum.
Abbreviations
HBS, HEPES buffered saline; PS, physiological saline; RBC, red blood cell; bRBC, bicarbonate-enriched red blood cell; MR,
morphological response; SI, shape index; SSS, standard sucrose solution; LIS, low ionic strength; NSVDC, non-selective voltage
dependent channel; OUW, osmotically unresponsive water; AcZA, acetozolamide; BzA, benzalkonium chloride; RVD, regulatory
volume decrease; RVI, regulatory volume increase; CAII, carboanhydrase II; AE1, anion exchanger 1 (band 3); VRS, volume responsive
system; SRS, shape responsive system.
Introduction
The atypical properties of the red blood cells in low ionic strength solutions (LIS), where NaCl is substituted isosmotically by sucrose, are still not well understood. LIS and nonelectrolytic solutions, particularly sucrose, are the media in which the red
cells change their ionic and osmotic states. These solutions have been used to study the anion and cation luxes [1-6] and the
morphological changes [7] of the RBCs [8]. However, the nature of the molecular mechanisms leading to the activation of some normally dormant transport pathways [1-7, 9-13] and the basis
of the characteristic triphasic shape changes in a sucrose solution
[8,14] are still obscure. In the earlier studies we showed that the
terminal stomatocytic RBC shape in a sucrose solution can be
reversed to a discoid shape by the extracellular Cl- concentration
increase accompanied by apparent cell swelling [8].
The aim of the present study was to investigate, in greater
detail, the relationship between the RBC shape and volume
regulatory mechanisms in LIS, including the role of protons,
chloride and bicarbonate. We conclude that the RBC volume
responses in LIS cannot be satisfactorily explained using the existing models.
*Corresponding author: Sergey V. Rudenko, Institute for Problems
of Cryobiology and Cryomedicine, National Academy of Sciences of the Ukraine. 23 Pereyaslavskaya Str. 23, 61015, Kharkov, Ukraine.
Tel.: +38 057 373-4143; E-mail: rsv@kharkov.ua
Materials and Methods
N-(2-Hydroxyethyl)piperazine-N’-2-ethanesulfonic acid
(HEPES) and 4,4’-diisothiocyanato-2,2’-stilbene-disulphonic acid (DIDS) was purchased from Serva, and sucrose from Merck.
All other reagents and AlCl3 were obtained from major suppliers
and were of the highest purity available. The stock solution of benzalkonium chloride (BzA; pharmaceutical mixture, consisting
of a mixture of alkylbenzyldimethylammonium chlorides of
various even-numbered alkyl chain lengths, Fluka, Germany) was prepared with concentration of 0.4 mg/ml.
Preparation of Erythrocytes
Human blood of informed volunteers was collected in vacuum vacutainer tubes with EDTA as anticoagulants on the day
of the experiment. After free blood sedimentation, 0.225 ml of the red blood cell pellet was transferred into and washed once with 5 ml of physiological saline (PS) (150 mM NaCl, 3,000 g, 2 min) and then once again with 5 ml of HEPES buffered saline HBS
(150 mM NaCl, 5 mM HEPES, pH 7.4, 3000 g, 1 min). Excess supernatant after the centrifugation was removed to leave ~1.5 ml inal volume of red blood cell stock suspension with hematocrit
about 17% which, if not indicated otherwise, was allowed to stay for 1-2 hours at room temperature before measurements to
avoid initial drift in cell properties [14]. To obtain a bicarbonate enriched RBCs (bRBCs) the pellet of cells in HBS was divided
into equal portions and concentrated bicarbonate solution (0.1
M) was added to one portion to get 10 mM inal concentration.
The same amount of HBS was added to other control portion of RBCs. To treat RBCs by DIDS, standard stock suspension was incubated at room temperature for 30 min in the presence of 20 mM DIDS and used as is.
Measurement of dynamics of RBC shape and volume changes
Morphological response of the cells suspended in a
standard sucrose solution (0.3 M, pH 5.8-6.2. without buffer, SSS) was monitored using homemade SA-01 shape-meter/
aggregometer which allows, besides measuring optical density
or light transmission, assessment of light luctuations carrying information on cell shape [15]. The shape index (SI) was calculated following the previously described protocol [8,15]
from the equation: SI= k·D, where k is a constant depending on
ampliication factor and meter calibration and D is a mean value
of light amplitude luctuations, averaged in 1-s time intervals.
The calibration factor k allows formation of SI scale relecting
the erythrocyte discoidal–spherical shape factor (1.00 for discs
and 0.06 for spheres). Erythrocytes (6-8 µl of stock suspension)
were placed into a cylindrical (diameter 10 mm) glass cell containing 2 ml of HBS so that the initial optical density was 0.30 ± 0.01, which corresponds to cell concentration of 6·106/ml.
The cell suspension was stirred on a magnetic stirrer at 600 rpm.
Morphological changes were monitored using an equally dense cell suspension in SSS. In other experiments additional chemicals
(0.5-100 µl of stock solutions with the same pHs as SSS) were added directly to the cells up to the desired inal concentration. Data presented in the igures are typical from 3 to 5 independent
experiments carried out with blood from different donors. All
experiments were performed at room temperature (20-24°C).
Volume changes were recalculated from raw absorbance and SI data using formula A7 as described in the Appendix.
Results
Dynamics ofvolume and shape changes during morphological response (MR) and effects of anions and DIDS
As shown elsewhere [14], variability in the absorbance
time course and SI changes of red blood cells in standard sucrose
solution (SSS) are noted (all abbreviations used in this paper are given in the abbreviation list). Despite the absolute absorbance values and SI variability, the recalculated volume changes in most cases demonstrate rather conservative, and often, equal behavior. As demonstrated in Figs. 1 and 2, shrinkage usually produces a
smooth, close to a single exponential, time course with maximal
volume changes occurring within the irst 60 s of process where the volume reaches approximately 88% of the initial cell volume. After 5 min this value drops to 84±2%. At the peak of MR (approximately 20 s), where the cells restore their discoid shape,
they have a reduced volume of 94%.
The value concurs with the earlier estimate that the cells in
state S2 have a slightly reduced volume [8]. The data demonstrate
that the improved technology, that converts the raw absorbance
Figure 1.
Dependence of the calculated relative cell volume (V) and the corresponding values of the shape index (SI on time during the morphological response (MR) in sucrose solutions. The pair (V1, SI1) shows MR in the standard sucrose solution (SSS) and the effect of chloride added at some points in time on the subsequent shape and volume dynamics. The pair (V2, SI2) shows an effect of chloride and
aluminum (inal concentration 20 μM, label Al) in SSS and the pair
(V3, SI3) in hypotonic sucrose (0.23 M), respectively. The arrows show a moment of reagent addition. Labels 20Cl, 80Cl and 100Cl show the
addition of 20, 80 and 100 μl of NaCl (2 M) in 2 ml of cell suspension, respectively. In V2 and V3 the solutions additionally contained 0.4 μg/ ml BzA. Here and in other igures the whole experimental scan lasted
and SI data into volume changes, produces results showing a rather high quantitative sensitivity (~2%) in assessing the relative volume changes during MR.
Fig. 1 shows that addition of NaCl at terminal phase of MR produces pronounced shape and volume restoration of
shrunken and stomatocytic cells. In the presence of BzA and Al3+,
that inhibited shape changes, an addition of concentrated NaCl
produced a small hypertonic shrinkage followed by a volume recovery.
The dynamics of these processes was similar in isosmotic
as well as in hyposmotic sucrose solutions (Fig. 1, V2 and V3). In both cases the cells reached the corresponding inal volume
which did not depend on the way NaCl was added (a small bolus
or all-in –one, Fig. 1, V2, V3, sections 1 and 2). Interestingly,
despite the increase in osmolarity produced by the addition of
salt, the inal cell volume after NaCl addition was greater than
before the addition. Thus, the cells not only restore an initial
sucrose-induced shrinkage, but in addition overcome a shrinkage
induced by rather strong hypertonicity. The re-swelling process takes place at any NaCl concentration exceeding 10 mM and can
be inhibited by DIDS as it is shown in Fig. 2.
At concentrations lower than 10 mM (not shown in the Fig.),
chloride is also able to inhibit the sucrose-induced shrinkage and
cause some restoration of volume and shape. However, lowering
the chloride concentration decreased the degree of restoration (not shown), demonstrating that the restoration process is concentration dependent. When DIDS was included in the
sucrose solution (Fig. 2, V1, section 2), it completely inhibited
the sucrose-induced shrinkage but had no effect on hypertonic NaCl-induced shrinkage. This is normal because DIDS does not
inhibit the water channels. However, it must be noted, that the inal cell volume is lower when DIDS is added before (or after)
NaCl in phase 3 of the standard MR compared with MR in the
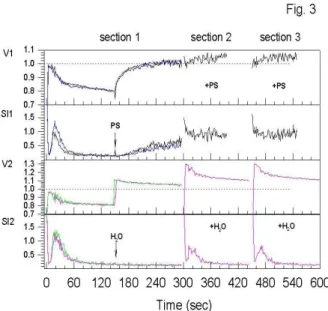
presence of DIDS (phase 1) (Fig. 2, V1, section 2; V2, sections 1 and 2). The data demonstrate that volume changes in the hypertonic mixed NaCl/sucrose solution are reversible. The same is observed in an isosmolar solution containing 50 mM NaCl. The cells do not substantially change their volume when placed directly in the solution (Fig.3, V1, section 2) and they recover the original isotonic volume after the addition of NaCl at the same medium osmolarity (Fig.3, V1, section 1).
When NaCl was substituted with distilled water to produce hypotonicity, the cell predictably swelled rapidly that followed
by a less visible shrinkage (Fig.3, V2, section 1).
Under hyposmotic conditions the cells increased their
volume and demonstrated the same time-course of volume changes as normal (Fig. 3, V2, section 2). The results listed in Figs. 1, 2 and 3 suggest that the characteristic t1/2 shrinkage
and re-swelling time shows similar values for all the cases. It assumes that the basic mechanisms regulating volume changes
under the conditions where the extracellular chloride content
varies are similar in nature. The mechanism probably includes
a redistribution of anions and protons between the cells and the
medium. However, two lines of evidence prompt the exclusion
of the possibility that Cl--induced re-swelling relects the cell swelling induced by the low pH of the medium due to Cl-/OH -exchange in a nonelectrolytic solution.
i) The present experiments were performed with low
hematocrit red blood cell suspension (~0.06%) where a drop
in external pH during cells exposure in LIS was about 0.2 unit
(measured with pH electrode). This relatively small change in pH could hardly induce a dramatic volume compensation followed by 95 mM NaCl addition, as shown in Fig. 2.
Figure 2.
Dependence of calculated relative cell volume and SI on time during MR in SSS and the effect of DIDS on chloride-induced shape and volume changes. The arrows with the Cl label show the time of the addition of
NaCl at the inal concentration of 49 mM, except for curve 2, which corresponds to NaCl concentration of 95 mM. The arrows with label D show a moment of addition of DIDS at inal concentration 2 μM. Labels
with (+) indicate that the reagents were added to SSS prior the cells.
Figure 3.
ii) When the external pH was changed by addition of NaOH or HCl to check the role of pH in the cell-volume recovery, the results shown in Fig. 4 were obtained. The control cells
demonstrated the classical swelling in acid and shrinkage in base
solutions (Fig. 4, section 1). However, any variation in external
pH (increase or decrease) did not change the re-swelling response
of the cells after chloride application (Fig. 4, section 2) but strongly inluenced the dynamics of MR visualized in SI tracks.
Base pH increased, whereas acid pH reduced, the rate and
the degree of sucrose-induced volume changes conirming the
important role the hydroxyl gradient plays in the stimulation of Cl-/OH- or Cl-/HCO3- exchange during the initial shrinkage.
Quantitatively, the same results were obtained when the pH of
the sucrose solution was changed 10 s after or before the addition of NaCl (data not shown). The data clearly illustrate the presence
of a weak pH-dependent volume recovery process that causes the
re-swelling of osmotically shrunken cells.
Effect of bicarbonate and acetozolamide on morphological response
The data shown in Fig. 5 illustrate that the bicarbonate
added after the re-swelling phase causes additional monophasic cell shrinkage. Biphasic shrinkage, consisting of fast and slow
components, was observed when the bicarbonate was added before NaCl (Fig. 5, V1, section 2). Only the slow component was
fully inhibited by the carboanhydrase inhibitor acetozolamide in
both normal and bicarbonate-enriched bRBC (Fig. 5, V1, V2,
sections 2).
Acetozolamide inhibited shape restoration and Cl--induced
re-swelling in both cell types (Fig. 5, V1, V2 sections 1, curves 2). However, its presence did not affect the inal volume of the cells
after the subsequent addition of the bicarbonate. By contrast, the
inal volume of cells was signiicantly larger in the presence of the
acetozolamide compared with the control if the bicarbonate was
added before the NaCl (Fig.5, V1, V2 sections 2, curves 4). Besides, the acetozolamide signiicantly accelerated the morphological
changes during MR and eliminated any subsequent NaCl-induced
(or bicarbonate) shape changes which are clearly visible in the
control samples. In the presence of the extracellular bicarbonate,
the cells rapidly reduced their volume down to 0.8 of the original volume. Neither DIDS nor acetozolamide was able to inhibit this fast shrinkage (Fig. 5, V3). Interestingly, by contrast to pure SSS, where the DIDS fully inhibited re-swelling (Fig. 2, V1, section 2)
in the SSS-containing bicarbonate and DIDS (or acetozolamide),
the addition of NaCl continues to induce small re-swelling (Fig.
5, V3). Thus, it appears that the inhibition of re-swelling in the presence of the bicarbonate is not a true inhibition of swelling. Rather, it represents a side effect of the opposite of bicarbonate-induced shrinkage, as the addition of bicarbonate at the end of the re-swelling phase induced an abrupt sphering and more prolonged
cell shrinkage. The data shown in Fig. 5 demonstrate that the cells may have different steady-state volumes and shapes in media containing the same inal composition. Thus, these data strongly conirm that the amplitude of volume changes and the inal cell volume at a given osmolarity is not a constant, and depends upon
the composition of the medium and the prehistory of the cells (e.g., whether the cells were swollen or shrunken before the osmotic challenge or if DIDS or acetozolamide were present).
Figure 4.
Effects of chloride and pH on the calculated relative cell volume and SI changes during MR in SSS. Tracks 1 and 4 correspond to basic pH and tracks 2 and 3 to acid pH, respectively. The arrows show moment of
reagent addition. Labels Cl show addition of 100 μl of NaCl (2 M) in 2 ml of cell suspension. Label ∆pH show moment of addition of NaOH or
HCl in order to increase or decrease medium pH in 1-1.2 unit. Section 2 corresponds to the case where the same pH changes of SSS were performed before addition the cells.
Figure 5.
Effect of chloride and bicarbonate on the calculated relative cell volume and SI changes during MR in SSS. The arrows show a moment of reagent
addition. Labels Cl show addition of 100 μl of NaCl (2 M), label HCO3 – 10 μl of NaHCO3 (0.1 M, inal concentration 0.5 mM) in 2 ml of cell suspension. Labels with (+) indicate that the reagents were added to SSS prior the cells. Final concentrations of DIDS and AcZA were 2 and 180
μM, respectively. Data shown in V1 and V2 correspond to normal cells
Discussion
The data presented indicate that human red blood cells undergo pronounced re-swelling resembling classical RVI in
hyperosmotic medium (Figs. 1 and 2) and they slightly reduce the volume in hyposmotic ones (Fig. 3, V2). However, the responses
are not, in fact, RVI and RVD because they too take place in an
isosmotic medium (Fig. 3). The mechanism of these responses is,
therefore, suggested to be different from that of RVD and RVI. In RBC research, it is generally accepted that under LIS conditions, many cell properties dramatically alter, especially
those related to ionic and nonelectrolytic transport [1-6,9-13,16].
They also change shape and demonstrate a morphological
response [8,14]. It was suggested earlier, that when the Cl -concentration in the medium is reduced, the depolarized cells will initially lose the intracellular Cl--mediated by the Cl-/OH
-exchange with concomitant obligate water eflux resulting in shrinkage [13]. Secondary, the KCl eflux will stimulate further shrinking. Our kinetic data relating to the earlier phase of the process during which K+ release is negligible [5,9] demonstrate a
major volume reduction within the irst 30-40 s to approximately 0.88 of the initial isotonic volume followed subsequently by a slower shrinkage. This is in a close quantitative agreement with the data reported in [16]. To avoid fast shrinkage, Kumerrow et al. [13] used hypotonic sucrose solution containing 10 mM Tris in
which the immediate alkalization of the cytosol was noted. Both fast initial shrinkage and alkalization were attributed to the AE1-mediated Cl-/OH- exchange. In another work by Bisognano et
al. [3], the response of the cells incubated in physiological saline
on hypertonic sucrose was biphasic, resulting in fast hypertonic shrinkage and gradual further shrinkage. The latter was
accompanied with proton eflux indicating the HCl cotransport
or Cl-/OH- exchange. The data concur with the viewpoint that an initial fast shrinkage in the sucrose medium is mediated by the Cl-/OH- exchange, whereas a subsequent slow shrinkage is
already due to the K+ eflux. Our data extend these observations
to the RBC volume dynamics. Monophasic shrinkage alone was found when the K+ eflux was stimulated by CCCP and
valinomycin [17], whereas biphasic ones occurred in the presence of bicarbonate (Fig. 5, V1, section 2 and V3, section 1). The data also conirm the earlier observations that the Cl-/OH-
exchange-mediated shrinkage and cell alkalization [13] are inhibited by
DIDS, attributing the effect to AE1.Considering the molecular
basis of the volume-restoring phenomenon, it is unclear which
component is loaded during the Cl--induced cell re-swelling in the sucrose solution. Sucrose could not be the culprit as it is well known that the sucrose is impermeant for red cell membranes
[18]. The Na+ could not be held responsible either, because
identical results were obtained if KCl were used instead of NaCl
(not shown). The simplest assumption is that it is due to the Cl-.
However, in this case it should be driven against its concentration
gradient.
It is known that an initial large positive membrane potential
in LIS is quite stable and does not dissipate during at least 100
s of exposure [10,19]. This indicates that the intracellular Cl -concentration is almost constant and the loss of Cl-via Cl-/OH
-exchange is compensated for by a decrease in cell volume [20].
If the external Cl- concentration is subsequently elevated up to 20 mM, the potential falls, but the Cl- gradient is still directed outward, assuming the intracellular Cl- concentration to be about
80-100 mM [20]. Thus, it is hardly correct to suggest that Cl
-loading is mediated by some kind of conductive channel-like
transport system for this anion (e.g. NSVDC). The operation of
the K+ (Na+)/H+ exchange will also cause cell shrinkage due to
obligate water eflux, i.e. the opposite effect.
In the attempt to explain this phenomenon, we used Lew’s
proposed integrated model of volume regulation [20]. The model
predicts monotonic cell shrinkage under isosmotic conditions,
if extracellular chloride concentration is reduced; however the
cells begin to shrink and demonstrate MR only if the chloride concentration is less than 2-3 mM. The model does not include
a special route for bicarbonate transport [20] and cannot explain any inluence of the bicarbonate and acetozolamide. Also, a more
direct comparison of the experimental results with the model is impossible because the model cannot be used in buffer-free media, the main condition of the present experiments. We conclude that our attempts to explain the results using model simulations were unsuccessful.
From the point of view of the results shown in Fig. 5 and reported elsewhere [21], demonstrating the shrinking effect of
the external bicarbonate, it can be suggested that the re-swelling
is due to a reversion of bicarbonate gradient. It now becomes
necessary for the outward bicarbonate gradient to be greater than the outward chloride gradient. Under the present experimental
conditions, the values of the outward bicarbonate and chloride
gradients were estimated to be approximately 10 and 5,
respectively. The bicarbonate gradient is greater than the chloride gradient and can potentially drive the movement of the chloride
ions inside the cells, causing swelling. This proposal implies the dependence of the re-swelling on the concentration of the external chloride (the more the chloride, the lower the outward chloride gradient, the faster the re-swelling), which is not the case because the rate of re-swelling, in fact, does not depend on the chloride
concentration (Figs. 1 and 2). It also predicts the DIDS and acetozolamide inhibition due to the direct involvement of the AE1
and carboanhydrase in Cl-/HCO3- exchange [22-25]. However, the data show a lack of DIDS and acetozolamide inhibition of the initial fast sucrose-induced shrinking in the bicarbonate–
containing medium (Fig. 5, V3). This correlates with the inability of DIDS to inhibit changes in the intracellular pH shown in [26].
At the same time both DIDS and the acetozolamide inhibit the Cl --induced re-swelling in the absence of the bicarbonate. The data suggest that the bicarbonate can utilize a transport route distinct
from AE1 or carboanhydrase. This view is consistent with the analysis given in [27], that the CAII does not bind directly to the
AE1, and that the bound CAII does not substantially accelerate
the HCO3
- transport.
Finally, all the typical volume and shape responses shown in Fig. 5 are almost identical for normal RBCs and bRBCs. The latter have an intracellular bicarbonate concentration around 6-8 mM,
indicating that the magnitude of the outward bicarbonate gradient has no principal bearing on the responses. In summary, these data show that Cl--induced re-swelling in LIS cannot be satisfactorily
explained by the reversion of OH- or HCO
3
- gradients being able
to drive the Cl- inside the cells against the concentration gradient.
However, the data demonstrate a signiicant role played by the external bicarbonate ions in shape and volume responses in the
LIS, a mechanism which warrants further research.
These systems are able to sense and respond to changes within
the cell environment, making the cell “active” in this sense. The data presented show that the systems can operate very quickly at some circumstances (e.g. in response to bicarbonate, Fig. 5) which make them experimentally dificult to observe. Therefore, the inal cell volume as well as shape is not constant at a given
medium osmolarity and composition, and most often, has little
in common with the intrinsic osmotic behavior of the red blood cells. This is conirmed by the data shown in Fig. 5 (V1), where the cells have a relative volume ranging from 0.5 to 0.68, whereas the predicted volume is 0.74 (476 mosm). The data showing the diverse changes in the volume and shape of the cells in LIS,
induced by small amounts of organic anions (less than 1 mM), also concur with this suggestion. This demonstrates a critical dependence of these parameters on the composition of the medium (unpublished data). It is our hope that a better understanding of the functional principles of VRS and SRS is considered serious enough to warrant future research.
References
1. Bennekou P, Barksmann TL, Christophersen P, Kristensen BI. The human red cell voltage-dependent cation channel. Part III:
Distribution homogeneity and pH dependence. Blood Cells Mol
Dis 2006; 36:10-14.
2. Bernhardt I, Donath E, Glaser R. Inluence of surface charge and transmembrane potential on rubidium-86 eflux of human red blood cells. J Membr Biol 1984; 78: 249-255.
3. Bisognano JD, Dix JA, Pratap PR, Novak TS, Freedman JC. Proton (or hydroxide) luxes and the biphasic osmotic response of human red blood cells. J Gen Physiol 1993; 102: 99-123. 4. Jones GS, Knauf PA. Mechanism of the increase in cation
permeability of human erythrocytes in low-chloride media.
Involvement of the anion transport protein capnophorin. J Gen Physiol 1985; 86: 721-738
5. Sambasivarao D, Rao NM, Sitaramam V. Anomalous
permeability and stability characteristics of erythrocytes in
non-electrolyte media. Biochim Biophys Acta 1983; 857: 48-60. 6. Zeidler RB, Kim HD. Effects of low electrolyte media on salt
loss and hemolysis of mammalian red blood cells. J Cell Physiol
1979; 100:551-561
7. Glaser R, Fujii T, Muller P, Tamura E, Herrmann A. Erythrocyte shape dynamics: inluence of electrolyte conditions and membrane potential. Biomed Biochim Acta 1987; 46:327-333.
8. Rudenko SV. Erythrocyte morphological states, phases, transitions and trajectories. Biochim Biophys Acta 2010; 1798:1767-1778.
9. Bennekou P, Kristensen BI, Christophersen P. The human red cell voltage-regulated cation channel. The interplay with the chloride conductance, the Ca(2+)-activated K(+) channel and the Ca(2+) pump. J Membr Biol 2003; 195:1-8.
10. Bennekou P, Barksmann TL, Jensen LR, Kristensen BI, Christophersen P. Voltage activation and hysteresis of the non-selective voltage-dependent channel in the intact human red cell. Bioelectrochemistry 2004; 62:181-185.
11. Bernhardt I, Bogdanova AY, Kummerow D, Kiessling K, Hamann J, Ellory JC. Characterization of the K+(Na+)/ H+ monovalent cation exchanger in the human red blood cell membrane: effects of transport inhibitors. Gen Physiol Biophys 1999; 18: 119-137.
12. Bernhardt I, Kummerow D, Weiss E. K+(Na+)/H+ exchange
in human erythrocytes activated under low ionic strength conditions. Blood Cells Mol Dis 2001; 27:108-111.
13. Kummerow D, Hamann J, Browning JA, Wilkins R,
Ellory JC, Bernhardt I. Variations of intracellular pH in human
erythrocytes via K(+)(Na(+))/H(+) exchange under low ionic strength conditions. J Membr Biol 2000; 176:207-216.
14. Rudenko SV. Characterization of morphological response of red cells in a sucrose solution. Blood Cells Mol Dis 2009; 42:252-261.
15. Rudenko SV, Crowe JH, Tablin F. Determination of
time-dependent shape changes in red blood cells. Biochemistry
(Mosc.) 1998; 63:1385-1394.
16. Gimsa J, Schnelle T, Zechel G, Glaser R. Dielectric spectroscopy of human erythrocytes: investigations under the inluence of nystatin . Biophys J 1994; 66:1244-1253.
17. Dise CA, Goodman DB. The relationship between valinomycin-induced alterations in membrane phospholipid fatty acid turnover, membrane potential, and cell volume in the human erythrocyte. J Biol Chem 1985; 260:2869-2874.
18. Culliford SJ, Bernhardt I, Ellory JC. Activation of a novel
organic solute transporter in mammalian red blood cells. J
Physiol 1995; 489 (Pt 3):755-765.
19. Barksmann TL, Kristensen BI, Christophersen P, Bennekou P. Pharmacology of the human red cell voltage-dependent cation channel; Part I. Activation by clotrimazole and analogues. Blood Cells Mol Dis 2004; 32:384-388.
20. Lew VL, Bookchin RM. Volume, pH, and ion-content
regulation in human red cells: analysis of transient behavior with an integrated model. J Membr Biol 1986; 92:57-74.
21. Jacobs MH, Stewart DR. The role of carbonic anhydrase in
certain ionic exchanges involving the erythrocyte. J Gen Physiol 1942; 25:539-552.
22. Alvarez BV, Vilas GL, Casey JR. Metabolon disruption: a mechanism that regulates bicarbonate transport. EMBO J 2005; 24:2499-2511.
23. Morgan PE, Supuran CT, Casey JR. Carbonic anhydrase
inhibitors that directly inhibit anion transport by the human Cl-/ HCO3- exchanger, AE1. Mol Membr Biol 2004; 21: 423-433. 24. McMurtrie HL, Cleary HJ, Alvarez BV, Loiselle FB, Sterling
D, Morgan PE, et al. The bicarbonate transport metabolon. J
Enzyme Inhib Med Chem 2004; 19: 231-236.
25. Sterling D, Reithmeier RA, Casey JR. Carbonic anhydrase: in
the driver’s seat for bicarbonate transport. JOP 2001; 2:165-170. 26. Swietach P, Tiffert T, Mauritz JM, Seear R, Esposito A, Kaminski CF, et al. Hydrogen ion dynamics in human red blood cells. J Physiol 2010; 588: 4995-5014.
27. Boron WF. Evaluating the role of carbonic anhydrases in the transport of HCO3--related species. Biochim Biophys Acta 2010; 1804:410-421.
28. Ponder E. Hemolysis and related phenomena.Grune and
Stratton, Inc New York. 1948.
29. Heubusch P, Jung CY, Green FA. The osmotic response of
human erythrocytes and the membrane cytoskeleton. J Cell
Physiol 1985; 122: 266-272.
30. Cook JS. Nonsolvent water in human erythrocytes. J Gen Physiol 1967; 50:1311-1325.
31. LeFevre PG. The osmotically functional water content of the human erythrocyte. J Gen Physiol 1964; 47:585-603.
Appendix to the article
Relationship between absorbance and shape index during
MR and recalculating the procedure to convert raw absorbance and SI data into relative volume changes.
Absorbance changes of red cell suspension have two major components – one responsible to volume changes ∆Av and other to shape changes ∆Ash.
(A1)
Osmotic behavior of red cells is usually correspond to that of nonideal osmometer and can be described by modiied Van’t Hoff equation in terms of cell volume as follows:
(A2)
where V0 and C0 are initial cell volume and osmolarity of the
medium, W – volume fraction of cell water in normal isosmotic conditions (0.7 [20]) and R – an empirical coeficient to it to experimental results [28]. For ideal perfect osmometer R=1,
for human erythrocyte the magnitude for R is expected to be
~0.5-0.7 [29-31]. Assuming the relation (A2) is valid, changes in absorbance due to only volume changes of cells at given
concentration can be written in the form:
(A3)
where bv is an empirical coeficient of proportionality converting
the volume changes into absorbance changes. The validity of expression (A3) was veriied in SSS for DIDS treated cells, for
cells in the presence of DIDS at different phases of MR and for
native cells after addition of aluminum chloride. The reason to
use DIDS and aluminum is that both are able to block the shape
changes but do not inluence osmotically induced volume changes in sucrose. Fig. A1 shows the dependence of absorbance on inverse relative osmolarity in SSS after stepwise addition of NaCl.
In all cases the dependencies are strikingly linear
conirming the validity of expression (A3) with high precision.
Slope of this relationship is slightly different for samples used that
relect possible variations in either osmotic behavior or optical
properties of the cells after different treatments. We conclude, therefore, that empirically, relationship between absorbance and
inverse osmolarity of constant cell shape can be described by the
formula (A3).
When the cells change their shape from discoid to more
spherical form absorbance is increased. As has been shown in [8]
relationship between absorbance and SI during MR is linear with the slope depending on the phase of process. Slope has a larger
value in phase 3 where shape and volume changes proceed in one
direction (sphering and shrinkage) and lower in phase 2 where shrinking is accompanied with the restoration of discoid shape. Therefore, the component of absorbance responsible for shape
changes of constant volume can be written in the form:
(A4)
where bsh is a coeficient which determines relative contribution
of shape to the total absorbance value of cell suspension and SI0
is initial SI. It is tempting to speculate that in SSS the value of
bsh which correspond to isovolumetric sphering lies somewhere between b1 for phase 2 (b1=0.022) and phase 3 (b1=0.051). The
mean from these values gives bsh=0.0365. Other approach to
estimate the value of bsh is a direct measuring of relative changes
in absorbance and SI during shape transformation of constant
volume. Fig. A2 shows a set of measurements performed
in different experiments and conditions where the shape
transformation is expected to proceed with no or limited volume changes. Although the scattering in the data is rather signiicant, linear regression it returns the value of bsh=0.0354, i.e. very close
to aforementioned mean value.
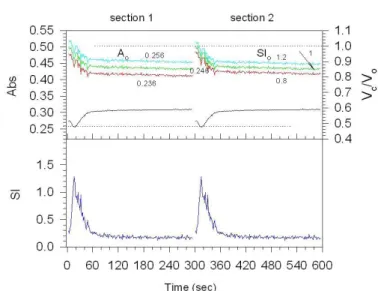
Figure A 1.
Dependence of absorbance on the inverse osmolarity of the external SSS media changed by the addition of concentrated NaCl at the constant shape of red blood
cells. Curve 1: cells ixed by DIDS (2 μM) at the peak position of MR (~20 s after injection of cells into SSS); curve 2: cells ixed by DIDS at terminal phase 3 of MR (~150 s); curve 3: cells treated by DIDS as described in material and methods in the presence of 0.025% plasma; curve 4: cells ixed by aluminum (20 μM) at
the peak position of MR. All experimental data are corrected by dilution factor to account for decrease in cell concentration after addition of NaCl. Parameters of
linear regression it of experimental data in the form y=a+b*x: curve 1–a=0.487,
b=-0.237, r2=0.9989; curve 2–a=0.527, b=-0.207, r2=0.9998; curve 3–a=0.418,
b=-0.156, r2=0.9998; curve 4–a=0.489, b=-0.160, r2=0.9930.
Figure A 2.
Dependence of absolute absorbance changes (∆A) on changes in SI (∆SI)
during shape transformation of constant volume. Each point corresponds to a separate experiment under different conditions and using different blood samples.
Experiments included measurements of shape changes induced by 20 μM DIDS in SSS containing 10 mM NaCl () or in HBS (∆), or in SSS containing 20 mM NaCl and BzA (0.4 μg/ml) (∆), or induced by 0.2 μg/ml of BzA in SSS containing 20 mM NaCl (σ) or induced by 2 mM DIDS in SSS containing 20 mM NaCl and 0.4 μg/ ml BzA (τ). Absorbance changes (∆A) and changes in SI (∆SI) were determined
as a difference between an initial stable value before reagents addition and a new
stable value after the addition of reagents. Parameters of linear regression it of
Taking in mind two components of absorbance, the total
absorbance changes contributed to both volume and shape can
be written in terms of osmolarity as follows:
(A5)
or using formula (A2)
(A6 )
from which we get the inal expression for relative volume changes during simultaneous volume and shape changes of cells
in suspension based on measuring of raw absorbance and SI data:
(A7)
At reference state, that is in the normal isotonic physiological
saline at normal cell volume and discoid shape, it is assumed
that A0=0.3 and SI0=1 and Vc/V0=Vrel=1. If the cells change only
their volume and not a shape this will result in an increase in absorbance corresponding to decrease in cell volume and vice versa. Fig. A3 shows theoretical dependence of relative cell volume on absorbance when bv is varied. Lowering this parameter leads to an increase in relative volume changes in response to the same absorbance variations (Fig. A3A) which is maximal for the cell with R=1 and reduces if R value is decreased (Fig. A3B).
For the lowest experimentally deined coeficient bv=0.158 10% volume reduction is achieved when absorbance increases by 0.02 AU when R=1 and by 0.04 AU when R=0.6. Actually, the volume sensitivity directly depends on the ratio R/bv, however
because bv is determined from the optical measurements and R
from direct volume ones [29,32] they should be considered as
different parameters where R is a parameter which determines
an ability of cell to undergo volume changes in anisotonic media. Fig. A3C shows that volume delections linearly depend on R value and under maximal possible absorbance changes during MR (~0.08 AU) can account for 35% of volume reduction if R=1 but only 20% if R=0.6. In this estimate, it is suggested that all absorbance changes are attributed solely to volume, however
since shape changes also contribute to absorbance, clear that
this is an upper estimate and resulting volume changes will be lower. Nevertheless, all these simulations show that absorbance delection in our case is rather sensitive to change in cell volume. An important question is at what extent the precision of recalculating volume changes depends on the choice of initial
reference parameters A0 and SI0? In physiological salt saline there is not a problem because A0 and SI0 are usually stable
and directly measured. Even if SI0 is different from unity as
for example for old red cells, both A0 and SI0 can be included
in formula (A7) for calculation of subsequent volume dynamics.
In sucrose solution the situation is more complicated since the
initial value of absorbance is signiicantly lower than in HBS, usually in the range 0.24-0.27 instead of 0.3 and, in addition, the
cells immediately change their shape upon introducing them in
this solution [8,14]. Therefore, we do not know exact values of
A0 and SI0 that correspond to initial isotonic volume and discoid
shape of the cells at this new environment. Fig. A4 illustrates how volume dynamics during standard MR is affected by the
choice of initial parameters A0 and SI0. These data show critical
Figure A 3.
Dependence of the calculated relative cell volume on absorbance (A, B) at different
values of parameter bv shown in
the legends for values R=1 (A) and 0.6 (B), and on parameter R (C) at different values of absorbance, shown near the lines. Calculations are done assuming the shape of the cells is constant.
Figure A 4.
Dependence of absorbance, SI and calculated relative cell volume on time
during standard MR in SSS and the effect of the initial parameters A0 and SI0
on the time course of relative cell volume changes. In the top graph, the upper curves correspond to the relative volume whereas the lower ones correspond
to absorbance changes. Section 1: initial parameters of A0 are shown near the
curves, SI0=1.2; section 2: initial parameters of SI0 are shown near the curves,
dependence of absolute values of calculated relative volume on the initial values of A0 and SI0. Increase in both parameters causes
an uniform upward shift of the curves whereas a decrease causes inverse downward shift of the same amplitude. Importantly, the relative error in assessment of A0(%) is directly converted in the
same error of Vrel (%). In contrast, 20% error in SI0 produced only about 3% difference in Vrel. One may conclude, that in order to
get quantitatively precision Vrel data, the initial value of A0 should
be also determined with the same accuracy. This can be achieved
in separate experiments where the cells initially do not change the shape, as for example in the presence of NaCl, at low pH or
calcium in a sucrose solution [8,14] or adjust A0 so that initial
Vrel would not substantially be different from unity, as in Fig. A4
implies that at the irst moment the volume of cells is equal to isotonic volume in the physiological saline. Finally, an estimate
of contribution of bsh in the inal value of Vrel shows the negligible
inluence of this parameter producing not more than 2.5% error when varying bsh within –10 – +10% of initial value of 0.036.
Therefore, by ixing this parameter in all experiments constant, it could be possible only a small systematic error in absolute value of
Vrel that has no principal meaning in assessing the time-dependent