Temporal and Spatial variability of
Potential Evapotranspiration in Semi-Arid
Region: Case Study the Valleys of Western
Region of Iraq
1,2Ahmed Saud,1* Md Azlin Md Said , 1Rozi Abdullah and 2Ammar Hatem
1
School of Civil Engineering, Universiti Sains Malaysia, 14300 Nibong Tebal, Seberang Perai Selatan, P. Penang, Malaysia
2
Engineering College \ Anbar University\ Iraq * Corresponding email: [email protected]
ABSTRACT
The present study is to examine the most appropriate method to estimate the Potential Evapotranspiration (PET) in the semi-arid areas in the westerly part of Iraq. Thornthwaite, Blaney-criddle, Kharufa and Ivanov methods have been employed in this study to estimate and identify the temporal and spatial variations of the Potential Evapotranspiration (PET). A comparison was drawn between the calculated PET with the average actual pan - evaporation in the meteorological station as to establish the accuracy of the estimation that can be produced between these methods.The performance indicators were applied using the statistical parameters namely the Root Mean Square Error (RMSE), Mean Absolute Error (MAE) and Correlation coefficient (r). The study establishes that the Ivanov method is proven to be superior to the other methods in estimating the potential Evapotranspiration (R2= 0.99), whereas other methods tend to underestimate the actual ones.
Keywords : Potential Evapotranspiration, Thornthwaite, Blaney-criddle , kharufa, Ivanov ,GIS.
1. Introduction
Evapotranspiration consider a main requirement in planning and designing any any irrigation project in arid and semiarid regions. Accurate estimation of Evapotranspiration would reduce the wasting of massive quantities of water (Abdullah et al. 2014). The process where water seeps from the Earth's surface to the atmosphere is called evapotranspiration (ET) and it is the most important water balance computation in a semi-arid climate (Deus et al. 2013, Jinxia et al. 2012, B et al. 2003). Potential evapotranspiration (PET) serves to be the average evaporation-transpiration of surface soil planted by growing green plantsat the height of (8-13 cm) and the advantage is that it does not suffer from not having enou
gh water.Vegetation patterns hasvital role in estimating evapotranspiration,infiltration and surface runoff (Templeton et al. 2014, Gutiérrez‐Jurado et al. 2006, Mueller et al. 2007) . Furthermore, ascertaining rainfall losses viaevapotranspiration (ET) is a crucial step due to thedirect relationship between agricultural crop production and the improved investment of water resources.(Al-Rijabo et al. 2008, Naiman et al. 2005, Xu and Chen 2005).
Many researchers (Al-Rijabo et al. 2008, Ali 2008, Mohammad 2008) have looked into the different methods to estimate PET compared to the actual monthly ET with a number of empirical equationswhich include FAO-56 Penman Monteith, Modified Blaney-Criddle, Hargreaves and Samani methods.
The spatial distribution estimation has been conducted by a number of researchers(Mohammad 2008, Tsanis 2003, Papageorgiou et al. 2005) . Additionally, spatially distributed modeling involves the assessment of the parameters that affects the estimation of PET, in each grid at a specific spatial resolution(Chuanyan Zhao 2005).
Hydrological parameters can be analyzed and presented through the GIS techniques which provide an integrated environment for the data to be gathered, displayed and analysed, and to be linked to the spatial data to highlightthe full nature of these data and their corresponding spatial distribution (Salih et al. 2008). GIS is the most commonly approach to estimate the spatially distributed ET over the whole basin and many researchers have tried to take advantage ofthe capability spatial analysis tools for GIS software to exhibit thespatial distribution for ET (Tsanis 2003, Latha et al. 2011).
Furthermore, highlighting thechanges in the spatial distribution of evapotranspiration on the entire basin are analysed and presented.
2. Study Area
The study area is located in the west of Iraq in Al-Anbar governorate near Haditha region, which is in the east of the Euphrates river with specific geographic coordinates 33° 53' 44"to 34° 12' 00” north and 41° 37' 53” to 42°
33' 26” east and with a catchment area of 979.2 km2. There are some significant dry valleys in the study area
surrounding the Euphrates River,as shown in the Fig (1) .
Fig.1 Study Area showing the Weather Stations
3. Data Collected
Six climate stations namely Ramadi, Haditha, Anah,Qaim , Rutba and Nakheb have been chosen. The climatic parameters that are useful to estimate PET are monthly average temperature , solar radiation and relative humidity . The result was drawn in comparison with the actual evaporation recorded in Haditha climatic station because it is located within study area.
4. Methods for estimation of potential evapotranspiration
There are several empirical equations serving as the linkage between the climatic data and PET. These equations apply to a particular area condition with regards to the type of the vegetational cover. Furthermore, these equations have varying input parameters and they are suitable for use under the climate of arid and semi-arid regions (Ali 2008).
4.1 Thornthwaite Method (1948) (TW)
This method is one of the significant methods used to estimate thepotential Evapotranspiration (PET) that is based on the monthly average temperature. This method can be appropriately used in arid and semi-arid regions (Kijne 1974, Henderson 2012, Ibrahim et al. 2012, Anderson et al. 2012)
T I
a
(1)
I ∑ i (2)
. . (4)
where PET is the potential evapotranspiration (mm), I is the annual heat index and can be calculated using equation (2),T denotes average monthly temperature C°, i is the monthly heat index and can be estimated from using equation (3) and a is a constant and can be calculated be equation (4).
4.2 BlaneyCriddle Method (1972)(BC)
Blaney-Criddle equation estimates the potential evapotranspiration on the premise of parameters which include the temperature, solar radiation and the correction factor for land cover. The equation can be brought into application without much climatic data.
PET Kρ . T 8. (5)
K . T . (6)
Where PET is the Potential Evapotranspiration (mm / month) , T denotes average monthly temperature C°, K is
thecorrection factor and can be estimated from using equation (6) ,ρ is the percentage of number of hours
monthly solar brightness to number of hours annual solar brightness .
4.3 Kharufa Method (1985) (KH)
Najibkharufa (1985) has refined the Blaney-criddle equations which eradicate the use of correction factor, through a measure ofcorrelating between the temperature and number of hours of solar brightness with PET(AL-Alusy 2011). This method is appliedto eliminate mismatch inthe results that calculateEvapotranspiration fromseveral other methods in the givenareas.
. (7)
Where PET is the potential evapotranspiration mm / month, T is the average monthly temperature C°, ρ
denotesthe percentage of number of hours monthly solar brightness to number of hours annual solar brightness .
4.4 Ivanov Method(IV)
Ivanov had been ableto look for an equation which estimates the potential evapotranspiration using temperature and relative humidity as the parameters (Ali 2008, Husseini 1988) .
. 8 (8)
Where PET is the Potential Evapotranspiration mm / month , T denotesaverage monthly temperature C° , a denotesaverage monthly of relative humidity .
5 Statistical Indicators
Statistical indicators such as the Root Mean Square Error (RMSE), Mean Absolute Error (MAE) and correlation coefficient (r) on the monthly PET estimated from empirical equations above have been applied. The RMSE is a commonly used measure of the differences between the predict values by a model and the observed values obtained from meteorologicalstations. MAE appears the error of estimation. It is an accuracy measure in an estimated time series value in statistics. Correlation coefficient, r denotes the proportion of variability in a data set consideredby a model.
∑ (9)
∑ (10)
6 Results and Discussion
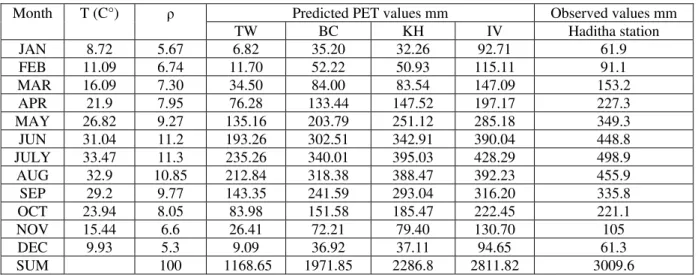
The study emphasizes the fact that there are two different levels in PET values.The first level is the monthly variation as a result of different monthly parameter rates that have been used in the equations, while the second level concerns with the differences in PET values among the methods used in this study, as can be referred to in Table (1).
Table (1) Estimated monthly averaged PET for study area for period (1980-2010)
Month T (C°) ρ Predicted PET values mm Observed values mm
TW
BC KH IV Haditha station
JAN 8.72 5.67 6.82 35.20 32.26 92.71 61.9
FEB 11.09 6.74 11.70 52.22 50.93 115.11 91.1
MAR 16.09 7.30 34.50 84.00 83.54 147.09 153.2
APR 21.9 7.95 76.28 133.44 147.52 197.17 227.3
MAY 26.82 9.27 135.16 203.79 251.12 285.18 349.3
JUN 31.04 11.2 193.26 302.51 342.91 390.04 448.8
JULY 33.47 11.3 235.26 340.01 395.03 428.29 498.9
AUG 32.9 10.85 212.84 318.38 388.47 392.23 455.9
SEP 29.2 9.77 143.35 241.59 293.04 316.20 335.8
OCT 23.94 8.05 83.98 151.58 185.47 222.45 221.1
NOV 15.44 6.6 26.41 72.21 79.40 130.70 105
DEC 9.93 5.3 9.09 36.92 37.11 94.65 61.3
SUM 100 1168.65 1971.85 2286.8 2811.82 3009.6
The study shows further that the Ivanov method hasgiven the highest values of PET for all the months while the Thornthwaite method gave lower values for the same period of time. The results have illustrated that the annual PET that ranges between 2811.82 mm to 1168.65 mm is estimated by Ivanov and Thornthwaite method respectively .Hadithameteorological station was used to compare theestimated results, as it is located in the study area and as their data are representative of the study area.
Fig.2 shows that the annual total PET estimated using the Ivanov method was closer than other methods when compared with ET observed in Haditha station- 3009.6 mm , Ivanova (2811.82 mm) , Kharufa (2286.8 mm) , Blaney-Criddle(1971.85 mm) and Thornthwaite (1168.65 mm) .Furthermore,Fig.2 points to a convergence in the PET valuesin the winter (January, February, March) between Ivanova and observed data in Haditha station, and additionally there is a precise match in some months (March, September and October) . Also, there is a convergence in the values of PET during the winter (January, February, March) between Kharufa and Blaney-Criddle , and there is a gap in the values of PET in June, July and August in all methods except for the existent actual match between Ivanov and Kharufa’s methods in August and the convergence in September.However , the Ivanov method wasto be closer than the exact data recorded in Haditha Station .
Fig. 2 Comparison of Estimated and Observed ET in Haditha Station 0
100 200 300 400 500 600
JAN FEB MAR APR MAY JUN JULY AUG SEP OCT NOV DEC
PET
mm
/
month
Months
Despite that, the Thornthwaite method provided a low value in comparison with other methods, but it is advantageous for many researchers to estimate the water balance of the watersheds and to discover the water surplus and water deficit in semi-arid areas (Ali 2008, Mohammad 2008, Ibrahim et al. 2012, Al-Shamaa and Ali 2011, Al-Maliki and Dairi 2005). Fig.3 demonstrates the comparison of the observed ET at Hadithastation with the estimated PET using the Ivanov method. It has been noted that there are some significantclose results between the observed and estimated data.
The performance indicators are shown in Table.2 are to examine the extent of efficiency of these methods.The Ivanov method gave better values more than other methods. The results indicate that there is a good consistency with the observed values and estimated results under the Ivanov method.
Fig. 3 Comparison of Estimated and Observed PET at Haditha Station .
Table.2 Verification of observed and estimated Results
Correlation Coefficient
Station Ivanov Khaurfa BlaneyCriddle Thornthwaite
Haditha 0.995 0.990 0.993 0.994
Root Mean Square Error
Station Ivanov Khaurfa Blaney-Criddle Thornthwaite
Haditha 0.4 0.66 0.984 1.68
Mean Absolute Error
Station Ivanov Khaurfa BlaneyCriddle Thornthwaite
Haditha 19.86 29.38 36.59 68.65
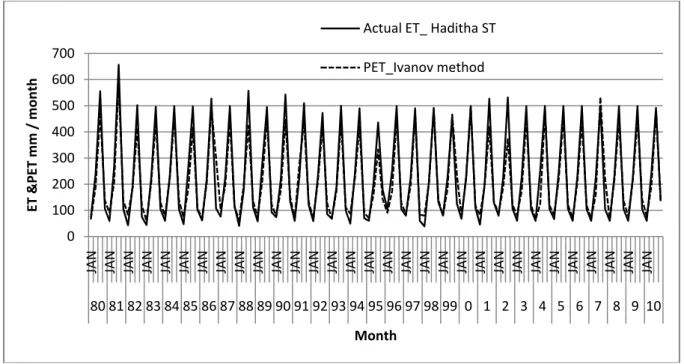
Fig.4 shows the scatter plot for monthly PET between observed data (Haditha station) versus PET estimated by
Ivanov method and this relationship get high coefficient of determination (R2= 0.99) and this indicate high
relationship between the observed data and Ivanov method. 0
100 200 300 400 500 600 700
JAN JAN JAN JAN JAN JAN JAN JAN JAN JAN JAN JAN JAN JAN JAN JAN JAN JAN JAN JAN JAN JAN JAN JAN JAN JAN JAN JAN JAN JAN JAN
80 81 82 83 84 85 86 87 88 89 90 91 92 93 94 95 96 97 98 99 0 1 2 3 4 5 6 7 8 9 10
ET
&PET
mm
/
month
Month
Actual ET_ Haditha ST
Fig.5 illu meteorol PET in a agricultu away fro the PET, relative h
ustrates the ogical station all seasons in ural lands and m the river an , indicating th humidity in th
Fig.4 ETH
spatial variat s, where each n nearby area wetlands in t nd agricultura he bare soils p
ese areas.
Haditha stationve
tion of ET o h one depicts t
as along the r those areas th al land toward possibly due t
Fig.5 Seaso
ersus Ivanov meth
over the who the month in d river Euphrat at lead to the dsthe west sid
to the season
onal spatial varia
hod estimated mo
ole watershed different seaso tes (Blue colo increased val e of the study nal variation i
ation of PET
onthly PET
d using obse ons.Furthermo or) is explain lue of PET. W y area, there w
in the wind sp
erved data fo ore, the highes ned by the pr When we mov will be a lowe
peed , temper
or the six st value of resence of
5. Conclusion
The study offers some conclusions as follows:
1. Ivanov method has been proven to be the best method in the estimation of potential Evapotranspiration
(PET) among these methodsin the study area (semi arid area).
2. Most of the values of Potential Evapotranspiration (PET) estimatedusing the Ivanov method are higher
than other methods and high relationship between the observed data (Haditha station )and Ivanov
method( R2= 0.990 ) .
3. PETs resulting from the equations of Kharufa and Blaney-criddleare close to one another in the months
of Jan, Feb and March in the winter when the temperature is low, while high difference between them occurs in the summer months (June, July and August) .
4. Thornthwaiteequationproduces lower results when compared to the other equations, but many
researchers use it to estimate the water balance of watersheds and to findout aboutthe water surplus and water deficit reported in semi-arid areas.
5. Spatially, the high Evapotranspiration (ET) values in the study area are discovered in the east region
near the Euphrates river and Haditha region following the presence of agricultural land and wetlands in those areas,leading to the increased value of ET. TheET value startsto decrease towards the west part of the study area becauseof the barren soilarea.
6. It is very useful to use thespatial analyst tool in hydrological studies to demonstrate the annual
temporal and spatial changes of hydrological parameters on the entirecatchment.
6. References
[1] Abdullah, S.S., Malek, M., Mustapha, A. and Aryanfar, A. (2014) Hybrid of Artificial Neural Network-Genetic Algorithm for Prediction of Reference Evapotranspiration (ET?) in Arid and Semiarid Regions. Journal of Agricultural Science 6(3), p191.
[2] Deus, D., Gloaguen, R. and Krause, P. (2013) Water balance modeling in a semi-arid environment with limited in situ data using remote sensing in Lake Manyara, East African Rift, Tanzania. Remote Sensing 5(4), 1651-1680.
[3] Jinxia, S., Bin, L., Shuqian, W. and Lingjun, L. (2012) Water Resources Management Based on the ET Control Theory. Procedia Engineering 28(0), 665-669.
[4] B, W., M, S. and D, B. (2003) The Water Balance on Rangelands, Marcel Dekker: New York, NY, USA,.Templeton, R.C., Vivoni, E.R., Méndez-Barroso, L.A., Pierini, N.A., Anderson, C.A.,
[5] Rango, A., Laliberte, A.S. and Scott, R.L. (2014) High-resolution characterization of a semiarid watershed: Implications on evapotranspiration estimates. Journal of hydrology 509(0), 306-319.
[6] Gutiérrez‐Jurado, H.A., Vivoni, E.R., Harrison, J.B.J. and Guan, H. (2006) Ecohydrology of root zone water fluxes and soil development in complex semiarid rangelands. Hydrological processes 20(15), 3289-3316.
[7] Mueller, E.N., Wainwright, J. and Parsons, A.J. (2007) Impact of connectivity on the modeling of overland flow within semiarid shrubland environments. Water Resources Research 43(9).
[8] Al-Rijabo, W., Jasim, K. and Shalal, M. (2008) Study of Reference Evapotranspiration in Ninava Governorate Using Different Mathematical Models Journal of Rafidain Science 19(3), 154-173.
[9] Naiman, R.J., Décamps, H., McClain, M.E. and Likens, G.E. (2005) Journal of Chemical Technology and Biotechnology, pp. 357-413, Academic Press, Burlington.
[10] Xu, C.Y. and Chen, D. (2005) Comparison of seven models for estimation of evapotranspiration and groundwater recharge using lysimeter measurement data in Germany. Hydrological processes 19(18), 3717-3734.
[11] Ali, M.F. (2008) Geographical analysis of the reality of drought and climate water deficit and the potential for the proposed addressed: case study Najaf governorateJournal of Kufa Arts 2, 207-246.
[12] Mohammad, T.R.S. (2008) Locational Discrepancy in the Values of the Water Losses by the
[13] Potential Evapotranspiration Process in Iraq - A critical Comparative Study of the Khosla and Thornthwaite Equations Journal of Basra Research For Human Sciences 33(1), 117-140.
[14] Tsanis, N.S.a.I.K. (2003) Hydro informatics in Evapotranspiration Estimation. Environmental Modelling & Software 18, 261 – 271. [15] Papageorgiou, A., Latinopoulos, P. and Mallios, Z. (2005) A Visual Basic Toolbar for Evapotranspiration estimation in a GIS
Application. Proceedings of the 9th International Conference on Environmental Science & Technology, Rhodes Island, Greece, , . A1175 – A1180.
[16] Chuanyan Zhao , L.S., Cheng Guodong (2005) Modelling the Spatial Distribution of Daily Evapotranspiration Based on GIS in the Middle Heihe River Basin, China IEEE 0-7803-9050-4/05, 1628-1631.
[17] Salih, S.A., Al-Hadithy, I.M. and Al-Nuami, A.S. (2008) Water Quality Assessment of Haditha Dam Lake – Western Iraqi Desert using Remote Sensing and GIS Techniques. IraqiJournalofDesertStudies 1(1), 48-62.
[18] Latha, C.J., Saravanan, S. and Palanichamy, K. (2011) Estimation of Spatially Distributed monthly evapotranspiration. International Journal of Engineering Science and Technology (IJEST) 3(2).
[19] Kijne, J.W. (1974) Determining Evapotranspiration , Drainage principals and Application, Surveys and Investigation, International Institute for land Relamation and Improvement.
[20] Henderson, A. (2012) The Future of the World's Climate (Second Edition). Henderson-Sellers, A. and McGuffie, K. (eds), pp. 531-621, Elsevier, Boston.
[21] Ibrahim, O.S., Salih, S.A. and Ali, N.H. (2012) Using of Climatic Water Balance to Assess The Reality of Groundwater Recharge in Baiji – Tikrit Sub Basin North West of Iraq Journal of Kirkuk University For scientific studies 7(1), 79-107.
[22] Anderson, R.G., Jin, Y. and Goulden, M.L. (2012) Assessing regional evapotranspiration and water balance across a Mediterranean montane climate gradient. Agricultural and Forest Meteorology 166–167(0), 10-22.
[23] AL-Alusy, Z.N. (2011) The Geopedohydromorphometric Analysis for the Area Restricted Between Haditha Dam and Huran Valley:Applied study in Northern Desert West of Iraq, University of Anbar.
[25] Al-Shamaa, I.M. and Ali, B.M. (2011) Hydrological Conditions of Badra - Jassan Basin. Diyala Journal of Agricultural Sciences 3(2), 693-702.