Isotopic Discrimination in the Double-Crested
Cormorant (
Phalacrocorax auritus
)
Elizabeth C. Craig1*, Brian S. Dorr2☯, Katie C. Hanson-Dorr2☯, Jed P. Sparks3‡, Paul
D. Curtis4‡
1Field of Zoology and Wildlife Conservation, Cornell University, Ithaca, New York, United States of America,
2United States Department of Agriculture, Wildlife Services, National Wildlife Research Center, Mississippi Field Station, Mississippi State, Mississippi, United States of America,3Department of Ecology and Evolutionary Biology, Cornell University, Ithaca, New York, United States of America,4Department of Natural Resources, Cornell University, Ithaca, New York, United States of America
☯These authors contributed equally to this work. ‡These authors also contributed equally to this work. *[email protected]
Abstract
The diet-tissue discrimination factor is the amount by which a consumer’s tissue varies isotopi-cally from its diet, and is therefore a key element in models that use stable isotopes to estimate diet composition. In this study we measured discrimination factors in blood (whole blood, red blood cells and plasma), liver, muscle and feathers of Double-crested Cormorants ( Phalacro-corax auritus) for stable isotope ratios of carbon, nitrogen and sulfur. Cormorants exhibited discrimination factors that differed significantly among tissue types (for carbon and nitrogen), and differed substantially (in the context of the isotopic variation among relevant prey species) from those observed in congeneric species. The Double-crested Cormorant has undergone rapid population expansion throughout much of its historic range over the past three decades, leading to both real and perceived conflicts with fisheries throughout North America, and this study provides an essential link for the use of stable isotope analysis in researching foraging ecology, diet, and resource use of this widespread and controversial species.
Introduction
The use of stable isotope analysis (SIA) has become widespread in studies of wildlife diet and foraging ecology, as the isotopic value observed in the tissue of an animal reflects that of its diet [1,2]. However, as a consumer assimilates dietary nutrients into its own tissues, the isotopic values of those tissues may deviate from that observed in the original diet; a process called iso-topic discrimination. The isoiso-topic value observed in the tissue of a consumer (δXt) is equivalent
to the isotopic value of its diet (δX
d) plus the diet-tissue discrimination factor (ΔX):δXt=δXd
+ΔX (equation 1), where X is the stable isotope of interest (e.g.,13C,15N, or34S). If we know ΔX and can measureδX
t, we can solve forδXd, revealing information about the animal’s diet
and foraging behavior. Discrimination factors vary among species and among tissue types within a species [3,4] such that, without knowledge of the magnitude of and variance around
a11111
OPEN ACCESS
Citation:Craig EC, Dorr BS, Hanson-Dorr KC, Sparks JP, Curtis PD (2015) Isotopic Discrimination in the Double-Crested Cormorant (Phalacrocorax auritus). PLoS ONE 10(10): e0140946. doi:10.1371/ journal.pone.0140946
Editor:Joseph K. Bump, Michigan Technological University, UNITED STATES
Received:June 3, 2015
Accepted:September 30, 2015
Published:October 16, 2015
Copyright:This is an open access article, free of all copyright, and may be freely reproduced, distributed, transmitted, modified, built upon, or otherwise used by anyone for any lawful purpose. The work is made available under theCreative Commons CC0public domain dedication.
Data Availability Statement:The dataset is publicly available at Cornell eCommons (https://ecommons. cornell.edu/handle/1813/40851).
species- and tissue-specific discrimination factors, meaningful inferences about diet and forag-ing ecology cannot be made.
Stable isotope values are discussed here using delta notation:δX = (Rsample—Rstandard)/Rstandard)
x 1000 (equation 2), where X is, for example,13C,15N or34S, and R is the corresponding ratio of heavy to light isotopes (e.g.,13C/12C,15N/14N or34S/32S) in either the sample of interest (Rsample)
or an international reference standard (Rstandard). Stable isotope ratios, includingδ13C,δ15N and
δ34S, have proven useful in identifying diet and resource use in wild animals.δ13C values are used
in diet studies as an indication of the animal’s foraging environment as they are highly influenced
by the type of photosynthesis by which carbon is fixed (i.e., C3, C4or CAM photosynthesis) as
well as the source of carbon and the photosynthetic environment (terrestrial, aquatic, pelagic, ben-thic, etc.; [5–7]).δ13C values tend not to change substantially with trophic position (i.e., little to no Δ13C), and for this reason, information about primary production is largely preserved inδ13C
val-ues throughout the food web [2]. This smallΔ13C may be due to carbon isotopic fractionation
during assimilation or respiration [8]. Researchers have observedΔ13C in a variety of aquatic and
terrestrial food webs, and reported a range ofΔ13C from -3 to 4‰, with averages of 0.2‰[8],
0.4‰[9], 0.75‰[4] and the commonly cited 1‰[2].
δ15N values are often used in examining trophic dynamics within food webs as they exhibit
significantΔ15N across trophic levels, and can therefore be used as an indicator of relative
tro-phic position [10].Δ15N is generally positive, and is largely attributed to the excretion of
isoto-pically lighter nitrogen in urine (or urate in the case of birds), leaving the isotoisoto-pically heavier nitrogen within the consumer’s system to be assimilated through tissue growth. As withΔ13C,
researchers have observedΔ15N in a variety of aquatic and terrestrial food webs, and reported a
range ofΔ15N from -1 to 10‰, with averages of 3.2‰[8], 3.4‰[9] and 2.75‰[4].
δ34S values are highly influenced by whether sulfur fixation occurred in freshwater or marine
environments [11], and, as with carbon, exhibits little to noΔ34S among trophic positions,
pre-serving information about the source of sulfur throughout the food web.Δ34S has been observed
to range from -1 to 2‰, with an average of 0.2‰[8]. The major dietary source of sulfur is in
essential amino acids such as cysteine and methionine, which are generally limited in animal diets and therefore are not often considered to have potential for discrimination [12,13].
Isotopic mixing models are increasingly used to identify diet composition (when components of the diet are isotopically distinct [14]). Because discrimination factors are unknown for most organ-isms, assumptions about the magnitude and direction of discrimination must often be made for these model approaches. However, slight differences in discrimination factors can lead to meaningful differences in the model estimate of diet composition [15,16], and the predictive strength of these models therefore increases greatly if the species- and tissue-specific discrimination factors are known.
In this study we identifyΔ13C,Δ15N andΔ34S in the Double-crested Cormorant (
Phalacro-corax auritus). The Double-crested Cormorant is a piscivorous colonial waterbird native to North America [17]. Over the past three decades this species has undergone rapid population expansion throughout much of its historic range [17–19], leading to both real and perceived
conflicts with fisheries throughout North America [20–25]. Rising interest in the diet and
for-aging behavior of this species has led investigators to seek new methods of evaluating cormo-rant resource use. Studies have recently begun to employ SIA to this end [13,26–31]. This
study provides an essential link for the use of SIA in researching foraging ecology, diet and resource use of this widespread and controversial species.
Materials and Methods
This research was conducted under the approval of the US Department of Agriculture, Wildlife Services, National Wildlife Research Center’s (NWRC) Institutional Animal Care and Use
to publish, and preparation of the manuscript; and provided facilities, staff, and funding to support capture and care of cormorants for this study. This work was also funded by Berryman Institute (http:// www.berrymaninstitute.org/). Funding was received by ECC. These funders had no role in study design, data collection and analysis, decision to publish, or preparation of the manuscript.
Committee (protocol QA-1723). Collection of specimens was permitted under USFWS Federal Fish and Wildlife Permit No. MB019065-6, and Mississippi and Alabama State scientific col-lecting permits. This study did not involve endangered or protected species. Six wild cormo-rants (all male) were captured at night roosts in Lubbub Creek, Alabama, and Bluff Lake, Mississippi (MS) between 14 and 21 January 2010. These birds were transported to the captive waterbird facility at the NWRC Field Station in Starkville, MS. Cormorants were fed anad libi-tumdiet of farm-raised channel catfishIctalurus punctatusbeginning the day after capture for a period of six or eight weeks (n = 3 and n = 3 respectively). Cormorants were sacrificed after the allotted feeding period, allowing for the collection of liver, blood (whole blood, red blood cells and plasma) and feather (with active blood supply) samples. Samples of the catfish diet were also collected throughout the course of the study (n = 22). The duration of time on the catfish diet allowed the isotopic turnover of each tissue type discussed above [32–34]. Pectoralis
muscle tissue was also collected from sacrificed birds, but as the period of the feeding trial was shorter than the typical complete turnover time for this tissue (four to five times that of liver [33]), the estimates of discrimination from muscle samples were subject to this additional source of error. Muscle data are still presented here because this source of error was considered to be small as birds likely also consumed farmed catfish prior to capture.
Stable Isotope Analysis
All samples were frozen and transported to Cornell University for SIA preparation. Feather sam-ples were rinsed with deionized water and dried. Muscle and liver samsam-ples were rinsed and drained of blood. Muscle, liver, blood and catfish samples were freeze dried. Muscle, liver and catfish samples were ground to a powder using a freeze mill. Half of each ground muscle, liver and catfish sample was set aside forδ34S andδ15N analysis without lipid extraction. Due to the
influence of lipid content onδ13C in cormorant muscle and liver tissue [28], lipids were extracted
from the remainder of the cormorant muscle and liver tissues, as well as from the catfish sam-ples, forδ13C analysis. Lipids were extracted using a 2:1 chloroform:methanol solvent [35].
All non-lipid extracted samples were analyzed forδ15N at the Cornell University Stable
Iso-tope Laboratory (COIL) using a Thermo Finnigan Delta V Advantage isoIso-tope ratio mass spec-trometer interfaced to a NC2500 elemental analyzer (EA-IRMS; Thermo Scientific, Waltham, MA). Feather, blood, and lipid-extracted muscle, liver and catfish samples were analyzed for
δ13C at COIL using EA-IRMS. An internal laboratory standard of American mink (Neovison
vison) tissue was analyzed for every 10 study samples. A chemical methionine standard was used to measure instrumental accuracy across a gradient of amplitude intensities. Isotope cor-rections were performed using a 2-point normalization (linear regression) of all rawδ13C and δ15N data with two additional in-house standards: Cayuga Lake brown trout (Salmo trutta)
and corn (Zea mays). Based on standard deviations of within-run replicate measurements of standards, analytical error was estimated to be ± 0.1‰forδ13C, and ± 0.4‰forδ15N. All
non-lipid extracted samples were analyzed forδ34S at the University of Utah’s Stable Isotope Ratio
Facility for Environmental Research using EA-IRMS. Internal laboratory standards were silver sulfide, zinc sulfide and eiderdown, and were analyzed for every 10 study samples. Based on standard deviations of within-run replicate measurements of standards, estimated analytical error was ± 0.5‰forδ34S. Reference standards for15N,13C and34S are atmospheric air,
Vienna Pee Dee belemnite and Canyon Diablo troilite respectively.
Statistical Analysis
discrimination factors among tissue types. Statistical analyses were considered significant at p<0.05. Discrimination factors were calculated for each cormorant tissue type by solving for
ΔX using equation 1, whereδXtis the mean isotopic value in each cormorant tissue andδXdis
the mean isotopic value of the catfish. Standard deviation for discrimination factors was calcu-lated by adding the standard deviation of isotopic values for each cormorant tissue type to that of the catfish such that it accounted for both sources of variation.
Results
The catfish diet fed to cormorants in this study had an average (± one standard deviation)δ13C
value of -19.1‰(±0.8‰),δ15N value of 7.6‰(±0.5‰) andδ34S value of 2.0‰(±2.3‰) and
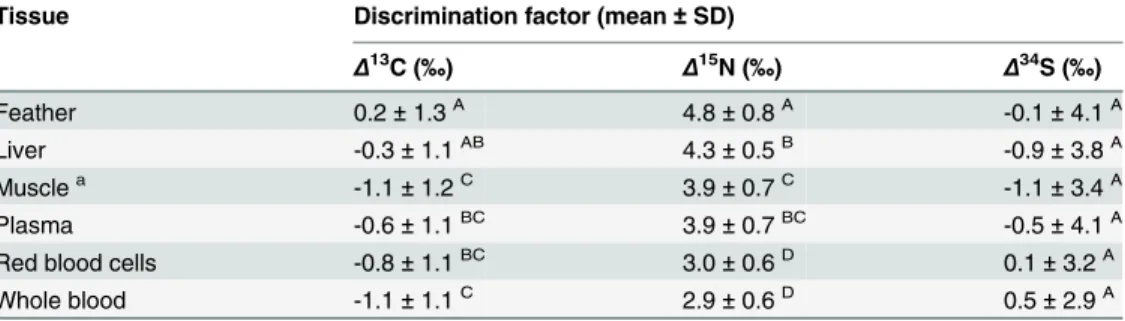
consisted of 44.2% C (±5.2%), 10.3% N (±1.0%), and 0.6% S (±0.1%).Δ15N values were all
posi-tive and generally large (ranging from 2.9 to 4.8‰).Δ13C values were smaller in magnitude
(ranging from -1.1 to 0.2‰) and were predominantly negative. Similar toΔ13C,Δ34S values
were small in magnitude (ranging from -1.1 to 0.5‰;Table 1).
Discussion
Double-crested Cormorants exhibited discrimination factors that differed significantly among tissue types (forΔ13C andΔ15N;Table 1). This was expected in light of the diversity of
bio-chemical and physiological processes taking place within these functionally different tissues. While both positive and negativeΔ13C andΔ34S values were observed, all were relatively close
(within approximately 1‰) to zero. All discrimination factors observed in this study were
within the range of values observed in freshwater aquatic food webs [2,4,8,9,12,13].
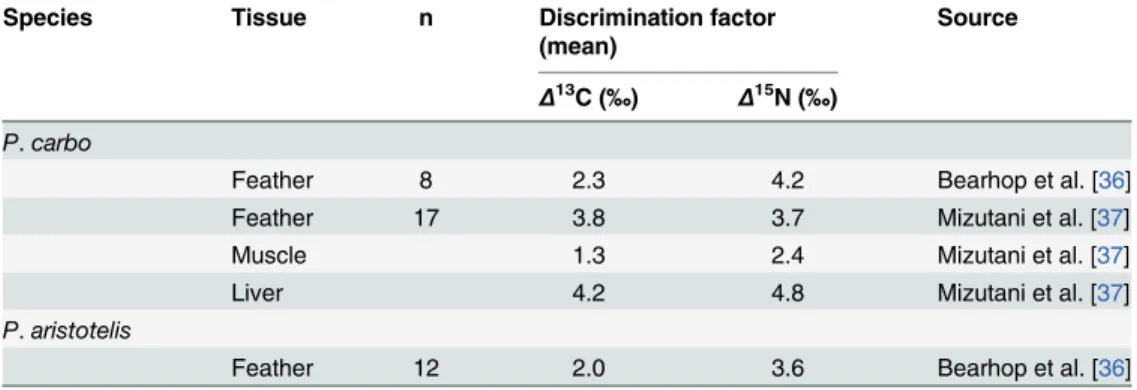
Unexpectedly, Double-crested Cormorant discrimination factors differed substantially (in the context of the isotopic variation among relevant prey species) from those observed in Great Cormorants (P.carbo[36,37]) and European Shags (P.aristotelis[36]). WhileΔ15N values
observed in Double-crested Cormorant tissues were within the range observed in congeneric species,Δ13C exhibited inter-specific differences in both magnitude and direction.
Double-crested CormorantΔ13C values were small and primarily negative while those observed in the
Great Cormorant and European Shag were larger and primarily positive (Table 2). It is likely that some of the variation observed among species is due to differences in experimental design. The current study had a relatively small sample size, sampled only males in captivity, and
Table 1. Average diet-tissue discrimination factors (meanΔ±SD of cormorant tissue + catfish diet) for carbon, nitrogen, and sulfur stable isotopes (Δ13C,Δ15N, andΔ34S) in wild Double-crested Cormo-rants (Phalacrocorax auritus) fed a diet of farm-raised catfish in captivity.Tissue types that differed sig-nificantly from one another (p<0.05) are indicated by different capital letters after parentheses within each
column (ANOVA with post-hoc Tukey Kramer HSD).
Tissue Discrimination factor (mean±SD)
Δ13C (‰) Δ15N (‰) Δ34S (‰)
Feather 0.2±1.3A 4.8±0.8A -0.1±4.1A
Liver -0.3±1.1AB 4.3±0.5B -0.9±3.8A
Musclea -1.1±1.2C 3.9±0.7C -1.1±3.4A
Plasma -0.6±1.1BC 3.9±0.7BC -0.5±4.1A
Red blood cells -0.8±1.1BC 3.0±0.6D 0.1±3.2A
Whole blood -1.1±1.1C 2.9±0.6D 0.5±2.9A
aMuscle tissue may not have experienced a full isotopic turnover during the captive period, however this source of error was minimized by the fact that birds likely consumed a similar diet prior to capture.
removed lipids from diet samples. In comparison, Mizutani et al. [37] sampled individuals in captivity, but did not report sex, and did not extract lipids from diet samples (influencingΔ13C
estimates). Bearhop et al. [36] used a combination of wild (European Shag) and captive (Great Cormorant) birds, did not report sex, but did extract lipids from diet samples. These experi-mental differences make direct interspecific comparisons of discrimination factors difficult. However, there are also potential biological sources of this variation, including interspecific dif-ferences in metabolic rates or physiological processes. For instance, depending on the energy needs of the consumer, carbohydrates and fatty acids from the diet will be routed towards res-piration (for immediate energy needs), fatty acid synthesis, or fat storage. Proteins from the diet are broken down, and their composite amino acids are either dissembled or, in the case of essential amino acids, used directly in protein synthesis. These biochemical and physiological processes determine the fate of nutrients consumed in the diet, and therefore play a key role in the magnitude and direction of diet-tissue discrimination.
Conclusions
Because of their substantial differences in magnitude and direction, use of discrimination fac-tors from different species, even congeneric species like the Great Cormorant or European Shag, to model diet in the Double-crested Cormorant would introduce substantial error into model estimates, underlining the importance of using species- and tissue-specific discrimina-tion factors in modeling efforts.
Acknowledgments
We thank the United States Department of Agriculture, Wildlife Services, National Wildlife Research Center, MS Field Station for providing facilities, staff, and funding to support capture and care of cormorants for this study. We also thank the Berryman Institute for helping fund this research. This study was conducted under the following permits: US Department of Inte-rior, US Fish and Wildlife Service, Federal Fish and Wildlife Permit MB019065-2, US Depart-ment of Interior, US Fish and Wildlife Service-Noxubee National Wildlife Refuge Special Use Permit, Alabama, Department of Conservation and Natural Resources Permit 4486, and Mis-sissippi Department of Wildlife, Fisheries, and Parks Scientific Collecting Permit 0926101.
Table 2. Average diet-tissue discrimination factors for carbon (Δ13C) and nitrogen (Δ15N) in two
Phala-crocoraxspecies: the Great Cormorant (P.carbo) and the European Shag (P.aristotelis), adapted from Hobson [31].
Species Tissue n Discrimination factor
(mean)
Source
Δ13C (‰) Δ15N (‰)
P.carbo
Feather 8 2.3 4.2 Bearhop et al. [36]
Feather 17 3.8 3.7 Mizutani et al. [37]
Muscle 1.3 2.4 Mizutani et al. [37]
Liver 4.2 4.8 Mizutani et al. [37]
P.aristotelis
Feather 12 2.0 3.6 Bearhop et al. [36]
Author Contributions
Conceived and designed the experiments: ECC KCH BSD. Performed the experiments: ECC KCH BSD PDC. Analyzed the data: ECC. Contributed reagents/materials/analysis tools: JPS. Wrote the paper: ECC.
References
1. Inger R, Bearhop S. Applications of stable isotope analyses to avian ecology. Ibis 2008; 150:447–61.
2. DeNiro M, Epstein S. Influence of diet on distribution of carbon isotopes in animals. Geochim Cosmo-chim Ac 1978; 42:495–506.
3. Hobson KA, Clark RG. Assessing avian diets using stable isotopes II: factors influencing diet-tissue fractionation. Condor 1992; 94:189–97.
4. Caut S, Angulo E, Courchamp F. Variation in discrimination factors (Δ15N andΔ13C): the effect of diet isotopic values and applications for diet reconstruction. Journal of Applied Ecology 2009; 46:443–53.
5. Farquhar GD, Ehleringer JR, Hubick KT. Carbon isotope discrimination and photosynthesis. Annu Rev Plant Phys 1989; 40:503–37.
6. France R. Differentiation between littoral and pelagic food webs in lakes using stable carbon isotopes. Limnology and Oceanography 1995; 40:1310–3.
7. Rubenstein DR, Hobson KA. From birds to butterflies: animal movement patterns and stable isotopes. Trends Ecol Evol 2004; 19:256–63. PMID:16701265
8. Peterson B, Fry B. Stable isotopes in ecosystem studies. Annu Rev Ecol Syst 1987; 18:293–320.
9. Post DM. Using stable isotopes to estimate trophic position: models, methods, and assumptions. Ecol-ogy 2002; 83:703–18.
10. Bond A, Jones I. A practical introduction to stable-isotope analysis for seabird biologists: approaches, cautions and caveats. Marine Ornithology 2009; 37:183–8.
11. Lott CA, Meehan T, Heath J. Estimating the latitudinal origins of migratory birds using hydrogen and sul-fur stable isotopes in feathers: influence of marine prey base. Oecologia 2003; 134:505–10. PMID: 12647122
12. Hesslein RH, Capel MJ, Fox DE, Hallard KA. Stable isotopes of sulfur, carbon, and nitrogen as indica-tors of trophic level and fish migration in the lower Mackenzie River basin, Canada. Can J Fish Aquat Sci 1991; 48:2258–65.
13. Hebert CE, Bur M, Sherman D, Shutt JL. Sulfur isotopes link overwinter habitat use and breeding condi-tion in Double-crested Cormorants. Ecological Applicacondi-tions 2008; 18:561–7. PMID:18488616
14. Phillips D. Mixing models in analyses of diet using multiple stable isotopes: a critique. Oecologia 2001; 127:166–70. doi:10.1007/s004420000571PMID:24577645
15. Ben-David M, Schell DM. Mixing models in analyses of diet using multiple stable isotopes: a response. Oecologia 2001; 127:180–4. doi:10.1007/s004420000570PMID:24577647
16. Bond AL, Diamond AW. Recent Bayesian stable-isotope mixing models are highly sensitive to variation in discrimination factors. Ecological Applications 2011; 21:1017–23. PMID:21774408
17. Hatch JJ, Weseloh DVC. Double-crested Cormorant (Phalacrocorax auritus). In: A P, editor. Ithaca, NY: The Birds of North America; 1999.
18. Hatch JJ. Changing populations of Double-crested Cormorants. Colonial Waterbirds 1995; 18:8–24.
19. Wires LR, Cuthbert FJ. Historic populations of the Double-crested Cormorant (Phalacrocorax auritus): implications for conservation and management in the 21st century. Waterbirds 2006; 29:9–37.
20. Glahn J. F., Werner S. J., Hanson T., and Engle C. R.. Cormorant depredation losses and their preven-tion at catfish farms: economic considerapreven-tions. In Clark L., Hone J., Shivik J. A., Watkins R. A., VerCau-teren K. C., and Yoder J. K., editors. Human conflicts with wildlife: economic considerations.
Proceedings of the Third NWRC Special Symposium. National Wildlife Research Center, Fort Collins, Colorado, USA; 2002. pp. 138–146.
21. Rudstam L, VanDeValk A, Adams C, Coleman JTH, Forney JL, Richmond ME. Cormorant predation and the population dynamics of walleye and yellow perch in Oneida Lake. Ecological Applications 2004; 14:149–63.
22. Diana JS, Maruca SL, Low B. Do increasing cormorant populations threaten sportfishes in the Great Lakes? A case study in Lake Huron. Journal of Great Lakes Research 2006; 32:306–20.
24. Dorr BS, Burger LW, Barras SC, Godwin KC. Economic impact of Double-crested Cormorant, Phala-crocorax auritus, depredation on channel catfish,Ictalurus punctatus, aquaculture in Mississippi, USA. J World Aquacult Soc 2012; 43:502–13.
25. Dorr BS, Hanisch SL, Butchko PH, Fielder DG. Management of Double-crested Cormorants to improve sport fisheries in Michigan: three case studies. Human-Wildlife Interactions 2012; 6:155–68.
26. Hobson KA, Hughes K, Ewins P. Using stable-isotope analysis to identify endogenous and exogenous sources of nutrients in eggs of migratory birds: applications to Great Lakes contaminants research. Auk 1997; 114:467–78.
27. Hebert CE, Weseloh DVC, Idrissi A, Arts MT, Roseman E. Diets of aquatic birds reflect changes in the Lake Huron ecosystem. Aquat Ecosyst Health 2009; 12:37–44.
28. Doucette JL, Wissel B, Somers CM. Effects of lipid extraction and lipid normalization on stable carbon and nitrogen isotope ratios in Double-crested Cormorants: implications for food web studies. Water-birds 2010; 33:273–84.
29. Doucette JL, Wissel B, Somers CM. Cormorant-fisheries conflicts: stable isotopes reveal a consistent niche for avian piscivores in diverse food webs. Ecological Applications 2011; 21:2987–3001.
30. Ofukany A, Hobson K, Wassenaar LI. Connecting breeding and wintering habitats of migratory piscivo-rous birds: implications for tracking contaminants (Hg) using multiple stable isotopes. Environ Sci Tech-nol 2012; 46:3253–62.
31. Hobson KA. Trophic interactions between cormorants and fisheries: towards a more quantitative approach using stable isotopes. Waterbirds 2009; 32:481–90.
32. Carleton SA, Martínez del Rio C. The effect of cold-induced increased metabolic rate on the rate of13C and15N incorporation in house sparrows (Passer domesticus). Oecologia 2005; 144:226–32. PMID: 15891840
33. Bauchinger U, McWilliams S. Carbon turnover in tissues of a passerine bird: Allometry, isotopic clocks, and phenotypic flexibility in organ size. Physiol Biochem Zool 2009; 82:787–97. doi:10.1086/605548 PMID:19785542
34. Hobson KA, Clark RG. Assessing avian diets using stable isotopes I: turnover of13C in tissues. Condor 1992; 94:181–8.
35. Logan JM, Jardine TD, Miller TJ, Bunn SE, Cunjak RA, Lutcavage ME. Lipid corrections in carbon and nitrogen stable isotope analyses: comparison of chemical extraction and modelling methods. J Anim Ecology 2008; 77:838–46.
36. Bearhop S, Thompson D, Waldron S, Russell I, Alexander G, Furness RW. Stable isotopes indicate the extent of freshwater feeding by cormorantsPhalacrocorax carboshot at inland fisheries in England. Journal of Applied Ecology 1999; 36:75–84.