in Bifurcations and Bends
Joana Fidalgo1(&), Diana Pinho2,3, Rui Lima2,4, and Mónica S.N. Oliveira1
1 James Weir Fluids Laboratory, Department of Mechanical and Aerospace
Engineering, University of Strathclyde, Glasgow G1 1XJ, UK {joana.fidalgo,monica.oliveira}@strath.ac.uk
2
Department of Chemical Engineering, Engineering Faculty, Transport Phenomena Research Center, R. Dr. Roberto Frias, 4200-465 Porto, Portugal
3
Polytechnic Institute of Bragança, ESTiG/IPB, C. Sta. Apolonia, 5301-857 Bragança, Portugal
4
MEtRiCS, DME School of Engineering, University of Minho, Campus de Azurém, 4800-058 Guimarães, Portugal
Abstract. Bifurcating networks are commonly found in nature. One example is
the microvascular system, composed of blood vessels consecutively branching into daughter vessels, driving the blood into the capillaries, where the red blood cells (RBCs) are responsible for delivering O2and up taking cell waste and CO2.
In this preliminary study, we explore a microfluidic bifurcating geometry inspired by such biological models, for investigating RBC partitioning as well as RBC-plasma separation favored by the consecutive bifurcating channels.
A biomimetic design rule [1] based on Murray’s law [2] was used to set the channels’ dimensions along the network, which consists of consecutive bifur-cating channels of reducing diameter. The ability to apply differential flow resistances by controlling theflow rates at the end of the network allowed us to monitor the formation of a cell-free layer (CFL) for differentflow conditions at haematocrits of 1% and 5%. We have also compared the values of CFL thickness determined directly by the measurement on the projection image created from a stack of images or indirectly by analyzing the intensity profile in the same projection.
The results obtained from this study confirm the potential to study RBC partitioning along bifurcating networks, which could be of particular interest for the separation of RBCs from plasma in point-of-care devices.
Keywords: RBC
Bifurcating networksCell-free layerMicrocirculation1 Introduction
Microfluidic devices have been widely studied for applications in medical diagnostics [3]. In particular, they present a good alternative for the process of plasma separation from whole blood since it requires a small volume of sample taking advantage of the geometry design and complex blood rheology at the microscale [4]. Ideally, the
©Springer International Publishing AG 2018
efficiency of this process should be high enough to allow the pure plasma to be analysed in-line, on the same platform device, usually for protein or other analyte detection. Even though several distinct approaches have been explored so far, the passive separation methods are always preferred since they require simpler setup, are cost effective and easier to integrate with biosensors. In addition, these methods usually subject the cells to smaller stresses ensuring the integrity of the original sample [5].
In this preliminary study, we investigate the use of bifurcating networks for pur-poses of plasma separation by testing suspensions of RBC in dextran 40 solution. Taking advantage of the typical bloodflow effects such as the plasma skimming and Zweifach-Fung effect (bifurcation law), the cell-depleted layer (CFL) formed close to the channel walls continues to flow into the channels of the forward generations. Taking into consideration that the CFL thickness is regularly used to quantify the separation efficiency and that there is no unique way to define it since the boundary outer cell-plasma is diffuse [6], we propose a systematic method for measuring the CFL along the channels based on the intensity profiles obtained after image processing.
2 Materials and Methods
The preliminary results presented in this paper were obtained from microfluidic experiments using animal blood. The procedures for RBC sample preparation and PDMS device production are described below.
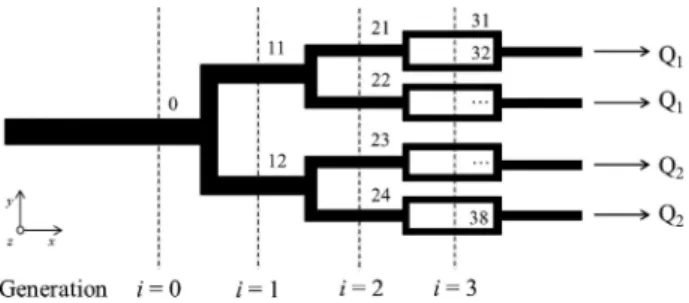
Microfluidic geometry: The microfluidic geometry consists of a series of 180° bifur-cations, with each channel dividing into two equal daughter branches, followed by a 90° bend. Figure1illustrates the schematics of the network, which is symmetric ony -axis and composed by 4 generations of channels (i= 0, 1, 2 and 3). This geometry was originally designed to impose uniform average wall shear stress distribution along the network to mimic the bloodflow conditions found in healthy vessels. The channels’ widths determined by a biomimetic design rule [1] are given in Table1for a constant depth of*100lm.
Fig. 1. Schematics of the symetric microfluidic geometry used. The bifurcating network is
composed of 4 generations (i= 0, 1, 2 and 3) and thefluid is pulled from the 4 outlets; black arrows indicate theflow direction. To study the effect of theflow rate ratio,Q2was varied in two
The SU-8 mould and PDMS microchannels were produced using standard
micro-fluidic technics (photo and soft-lithography, respectively) and the channels were sealed to a glass slide using oxygen plasma treatment (ZEPTO, Diener) for a faster and stronger surface bonding.
Blood sample preparation: The blood sample was collected from healthy sheep and stored at 4 °C until further use. Anticoagulant ethylenediaminetetraacetic acid (EDTA) was used. All procedures for the collection of blood were carried out in compliance with the Ethics Committee for Animal Experimentation of IPB (Bragança, Portugal). The sample was centrifuged at 2000 rpm for 15 min and the supernatant (including plasma, white blood cells, platelets, proteins and other molecules) was discarded. Red blood cells (RBCs) were washed twice using physiological saline solution (NaCl 0.9% w/v) using the same centrifuging conditions. The cells were then suspended in Dextran 40 (Dx40) according to the desired haematocrit (Hct) as defined by:
Hct¼ VRBC
VðRBCþDx40Þ
ð1Þ
In this work we used Hct of 1% and 5%.
Experimental setup and image analysis: The microfluidic device was connected to 4 glass syringes of 100lL (SGE) usingflexible tubbing and the flow rates Q1and Q2 were independently manipulated using a precise syringe pump (neMESYS, Cetoni) with 2 modules, one for eachflow rate.
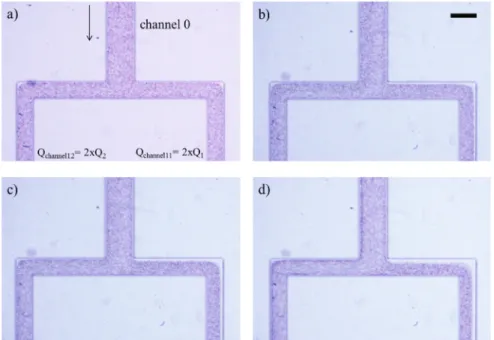
The images and videos were obtained using an inverted microscope OLYMPUS CKX41 and a high-speed camera (i-speed LT, Olympus). Image analysis was per-formed usingImageJopen software, based on theZ–projectionof the stack of frames, using different intensity criteria (median or standard deviation) depending of the parameters to be analysed. The projections using the median intensity were used for CFL measurement as well as to investigate the RBC distribution inside the channels by examining the correspondent intensity profiles, as will be discussed further in the results. Figure2presents typical images obtained during experiments and after image processing. Initially, a stack of bright field images from the region of interest is obtained (see Fig.2a for bifurcationi= 0!1, including branches 11 and 12). Using ImageJ, a median intensity projection usingZ-projectis created from a stack of at least 80 images and the two regions of interest are defined (Fig.2b) and analysed in detail using intensity profiles.
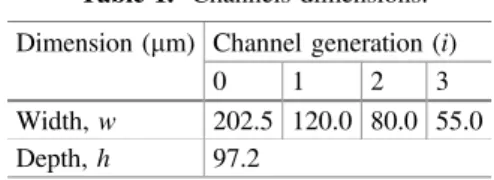
Table 1. Channels dimensions.
Dimension (lm) Channel generation (i)
0 1 2 3
Width,w 202.5 120.0 80.0 55.0
3 Results and Discussion
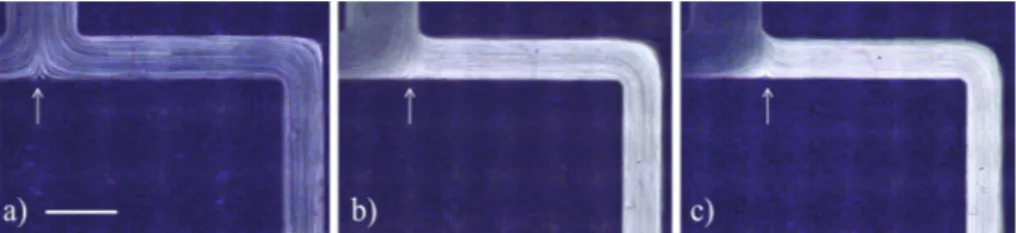
Figure3presents the effect offlow rate ratioQ2/Q1,in the development and evolution of a CFL downstream of thefirst bifurcation of the network (fori= 0!1). As it can be observed, the CFL formed in the smaller flow rate channel (named channel 11) increases as a function of theflow rate ratio. This RBC distribution at the bifurcation is a result of the combination of theflow conditions imposed and the blood complex rheology. This behaviour has been well documented in previous bloodflow studies in different bifurcation geometries [4,7].
Fig. 2. Typical brightfield microscopy image obtained in these experiments (a); image obtained
from the stack (80 frames) using the median intensity projection method (b); scale bar corresponds to 200lm.
Fig. 3. Effect of increasingflow rate ratio (Q2/Q1) on the CFL formed downstream of thefirst
bifurcation (i= 0!1) for Hct = 5%, andQ2/Q1of (a) 1, (b) 10, (c) 20, (d) 40. The black arrow
Due to the cell deformability, the velocity gradient across the channel width (as a result of parabolic profile in bothy- andz-directions) and the effect of the wall, the cells tend to be displaced towards the centre of the channel [8,9]. This particular effect is enhanced when confinement becomes stronger; this is, with dimensions compared to a few RBC diameters. The cell migration has a strong effect on the suspension viscosity since the higher haematocrit at the center generates a larger bulk viscosity, while the region depleted of RBC close to the walls (cell-free layer) has a smaller viscosity, acting as a lubricant for the remaining fluid [10, 11]. Even though this CFL is not easily detectable in Fig.2, it is present even along the main channel due to the small geometry dimensions (this can be seen clearly for 1% Hct using higher magnifications, not shown here due to space considerations). This effect ofplasma skimmingwill influence the way RBC divide when encountering a bifurcation. When the suspension of particles (RBCs) faces an asymmetric bifurcation, which in this case is determined by the unequalflow rates imposed in channels 11 (2Q1) and 12 (2Q2), the volume fraction of RBC is larger in the daughter branch with the largerflow rate (channel 12) than in the branch with the lowerflow rate (channel 11). This is the so called Zweifach-Fung effect which is directly influenced by the cell distribution at the inlet [12]. We intend to explore this phenomenon in our customised geometries for plasma separation, since each bifurcation allows the reduction of haematocrit and the formation of a large CFL in specific branches along consecutive generations, as is demonstrated on Fig.4.
Providing accurate measurements of the thickness of the cell-free layer is always a challenge. First, there is no exclusive way to define the CFL as discussed by Kruger [6], since the threshold between the RBC region and the CFL is diffuse, which is further complicated by the fact that in experiments this diffuse layer is uneven. Here, we try to assess the CFL thickness using different methodologies and discuss its impact on the values measured. Figure5presents the CFL thickness measured on channel 11 as a function of theflow rate ratio, for Hct = 1% and 5%. This measurement was made by user inspection directly in the image obtained via the median intensity projection method using theZ-projectplugin fromImageJ. Qualitatively, it is clear that the CFL thickness is higher for lower Hct and that the size of the cell-free layer in channel 11
Fig. 4. Real image of the channels on the latter generations (i= 2 andi= 3) corresponding to
increases asQ2/Q1increases for the range offlow rate ratios considered. The right edge of both curves seem to plateau forQ2/Q1= 100 since after a certainflow rate ratio, the number of cells entering the smallerflow rate channel (11) continues to decrease, but they tend to occupy a large section of the channel width. Because the cells are more dispersed, the CFL limit becomes highly diffuse and the measurement of its thickness, following this method, is not reliable anymore.
Figure6 presents the RBC diverging point for different flow rate ratios. For Q2=Q1,the cells divide in the position corresponding to the main channel centreline and, as theflow rate ratio increases, the RBC diverging point displaces towards the channel 11 (e.g.Q2/Q1= 40). For lowflow rate ratios the edge between the outermost RBCs and the CFL is relatively sharp (Fig.6a), but for largeflow rate ratios, the edge becomes blurred (Fig.6c) and the methodology is particularly user subjective. Fig. 5. Effect of theflow rate ratio (Q2/Q1) on the CFL thickness directly measured along the channel 11 (generationi= 1) for Hct of 1% (squares) and 5% (circles) using a median intensity projection method.
Fig. 6. Evolution of RBC diverging point as a function offlow rate ratioQ2/Q1 of 1 (a), 10
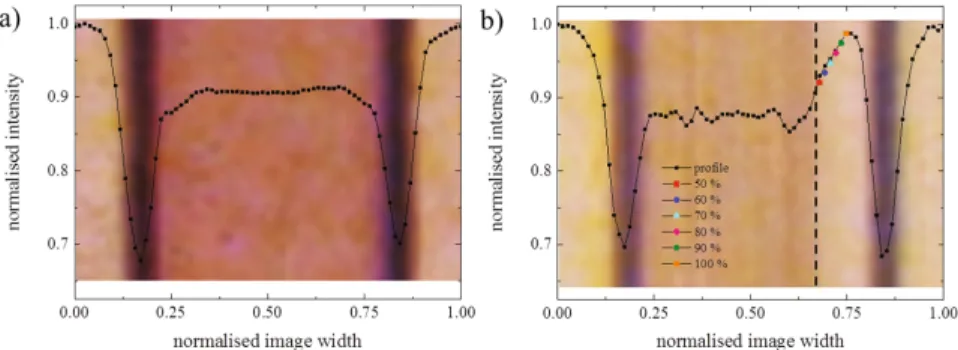
In the second methodology adopted, we used the intensity profiles obtained from theZ-projectto assess the CFL thickness. Figure7a, b show the superposition of the projection image and the intensity profile obtained for channels 12 and 11, respec-tively. As it is easily observed, the projection for the channel with larger flow rate (12) is very homogeneous suggesting a similar distribution of cells along the channel width. For channel 11, however, there is a lateral peak close to the outer wall corre-sponding to the CFL. Several thresholds of intensity were considered to determine the limit of the CFL. Thefinal CFL thickness would then correspond to the distance from the channel inner wall to the y-position where the intensity reaches the defined threshold (expressed as % of variation of intensity between the maximum value and the average value within the centre of the bulk cell region). Table2shows the comparison between the CFL measured directly in the image using the visual inspection procedure (Fig.7b, dashed line) and the CFL determined using the intensity profile considering different values for the threshold (100, 90, 80, 70, 60 and 50%), where 100% corre-sponds to the Dx40 solutionflowing without cells.
Fig. 7. Indirect measurement of CFL thickness using intensity profiles. Superposition of the
projection image and the corresponding intensity profile for channels 12 and 11 (a and b, respectively) for 1% Hct andQ2/Q1= 40. The colour symbols in part (b) identify the different
thresholds considered and the vertical dashed line corresponds to the CFL limit determined by visual inspection.
Table 2. Comparison between CFL thickness (lm) measured directly from visual inspection of
the median intensity projection and using the intensity profile for 1% Hct andQ2/Q1= 40.
Direct measurement from Z-Projectionimage using median intensity
Indirect measurement using the intensity profile (Z-Projectionmedian intensity) considering different percentages of the maximum intensity as threshold
20.04lm % of maximum
intensity
50 60 70 80 90 100
The value obtained by visual inspection (20.04lm) is close to the value
consid-ering the threshold of 50% using the intensity profile. It is clear that there are still a number of cellsflowing inside the CFL and deciding which value of threshold is more meaningful is still a subject of debate. The advantage in the case of this methodology is that the CFL thickness would be systematically measured for all the cases, this is, for
flow conditions for which the layer is well defined and for the cases when the boundary CFL-cell bulk is not perfectly clear. This would also avoid the personal subjectivity when defining the CFL limits.
4 Conclusion
The execution of preliminary experiments in bifurcating networks confirmed the potential of using this type of geometries for blood-plasma separation. Due to the bifurcation law, a CFL is easily formed in thefirst bifurcation and observed along the consecutive channels with smallerflow rates. In the present geometry with 4 genera-tions of narrowing channels, the relative thickness of the cell depleted layer increases in relation to the total channel width, as the suspension moves along the network. We believe that by controlling the 4 outlets independently, for different ranges of totalflow rate, overall separation efficiency could be enhanced. We have also demonstrated that the method for CFL measurement here proposed, based on the intensity profiles, establishes a reliable alternative to monitor the separation process and, at the same time, allows consistency between measurements under different flow conditions, avoiding personal subjectivity when defining the limit between cell bulk and CFL.
Acknowledgments. JF would like to thank Professor Graça Minas and her coworkers for
providing the laboratory facilities and technical help during the experiments.
References
1. Zografos, K., Barber, R.W., Emerson, D.R., Oliveira, M.S.N.: A design rule for constant depth microfluidic networks for power-law fluids. Microfluid. Nanofluidics19, 737–749
(2015)
2. Murray, C.D.: The physiological principle of minimum work. I. The vascular system and the cost of blood volume. Proc. Natl. Acad. Sci. USA12, 207–14 (1926)
3. Sharma, S., Zapatero-Rodríguez, J., Estrela, P., O’Kennedy, R.: Point-of-care diagnostics in low resource settings: present status and future role of microfluidics. Biosensors5(3), 577–
601 (2015)
4. Leble, V., et al.: Asymmetry of red blood cell motions in a microchannel with a diverging and converging bifurcation. Biomicrofluidics5, 44120–44120-15 (2011)
5. Tripathi, S., Kumar, Y.B.V., Prabhakar, A., Joshi, S.S., Agrawal, A.: Passive blood plasma separation at the microscale: a review of design principles and microdevices. J. Micromech. Microeng.25(8), 083001 (2015)
7. Yen, R.T., Fung, Y.C.: Effect of velocity distribution on red cell distribution in capillary blood vessels. Am. Physiol. Soc.235, 251–257 (1978)
8. Di Carlo, D.: Inertial microfluidics. Lab. Chip.9(21), 3038 (2009)
9. Zhang, J., et al.: Fundamentals and applications of inertial microfluidics: a review. Lab. Chip.16(1), 10–34 (2016
10. Popel, A.S., Johnson, P.C.: Microcirculation and Hemorheology. Annu. Rev. Fluid Mech.37, 43–69 (2005)
11. Fedosov, D.A., Caswell, B., Popel, A.S., Karniadakis, G.E.M.: Blood flow and cell-free layer in microvessels. Microcirculation17(8), 615–628 (2010)