“NOTICE: this is the author’s version of a work that was accepted for publication in the Book Perspectives in Fundamental and Applied Rheology. Changes resulting from the publishing process, such as peer review, editing, corrections, structural formatting, and other quality control mechanisms may not be reflected in this document. A definitive version is available in the Book Perspectives in Fundamental and Applied Rheology, Rubio-Hernández, F. J., et al. (Eds), 2013.
_________________________________________________
Separation and deformation of red blood cells in
PDMS microchannels
Raquel O. Rodriques1,Vera Faustino1,2, Diana Pinho1,2,Elmano Pinto1,2, Diana Cidre1,
Tomoko Yaginuma1, Bruna Taboada1,2, David Bento1,2, Rui Lima1,2
1 ESTiG, Polytechnic Institute of Bragança, C. Sta. Apolónia, 5301-857 Bragança, Portugal. 2 CEFT, Faculty of Engineering, University of Porto, R. Dr. Roberto Frias, 4200-465 Porto, Portugal.
Introduction
Over the years, several experimental techniques were performed in in vitro
environments, in an attempt to understand the flow behaviour of blood in
microcirculation. Several of these studies were performed in glass capillaries, and
have produced significant results with respect to rheological properties of blood [1,
2]. Another way to perform in vitro blood studies is to use microchannels fabricated
by soft- lithography [3, 4] and xurography [5]. With these techniques several
studies have focused in the formation of the cell-free layer (CFL) that is caused by
the tendency of red blood cells (RBCs) to migrate toward the centre of the
microchannel, in that the physical reason is known as the Fahraeus Lindqvist. The
presence of this CFL at the regions adjacent to the wall is affected by the
formation of CFL can be used for separation of diseased cells from healthy blood
cells [8]. The aim of this paper is to show briefly the importance of the microfluidic
devices to study several physiological phenomena that happens in vivo
environments with special focus on the CFL behaviour and RBC deformability.
Materials and Methods
Working fluids
Generally several working fluids were examined: dextran 40 (Dx-40) containing
1%, 5%, 9% and 12% of RBCs. The hematocrits (Hcts) correspond to the feed
reservoir Hct and it was measured by using a hematocrit centrifuge. Detailed
description of the samples preparation can be found elsewhere [4, 5, 9-11]
.
Microchannels fabrication
The microchannels tested were fabricated by means of two different
microfabrication techniques, i. e., the soft-lithography [3, 4] and soft-xurography
[5]. All the microchannels tested with dimensions less than 200 m were
fabricated by standard soft-lithography techniques from a SU-8 photoresist mold
[4, 9-11]. Recently we have developed a low cost microfabrication technique to
study blood flow phenomena at a microscale level. This process uses vinyl mold
masters fabricated by a cutting plotter. By using this technique we do not need a
clean room facility and as a result it is possible to reduce significantly the
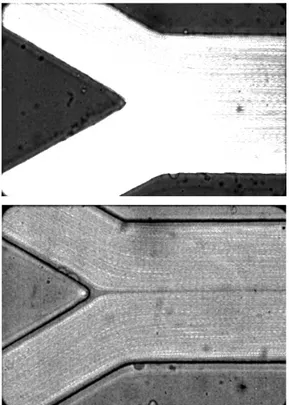
production cost. Figure 1 shows the vinyl mold master and the correspondent
PDMS microchannel fabricated by a soft-xurography. Detailed description of this
Figure 1. Images obtained using an inverted microscope with a 4x objective lens: A - The vinyl mold master fabricated by a cutting plotter; B – PDMS microchannel of the
confluence.
Experimental set-up.
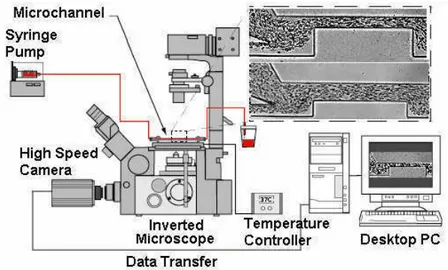
The high-speed video microscopy system used in our experiments consists of an
inverted microscope combined with a high-speed camera (see Figure 2). The
PDMS microchannel was placed on the stage of the microscope where the flow
rate of the working fluid was kept constant by means of a syringe pump.
Image analysis
Overall, the recorded images were transferred to the computer and then evaluated
in Image J (NIH). To measure the CFL thickness the captured videos were
converted to a sequence of static images (stack). Then, for each pixel, the
maximum intensity of all the images in the stack was selected using the “Z project”
function in ImageJ, which results in a region of RBCs core brighter than the
background. To obtain quantitative measurements the grey scale images were
converted to binary images with thresholding.
The RBC deformation measurements in hyperbolic microchannels were possible
by using the following image analysis procedure. First, the captured videos were
converted to a sequence of static images. Then, in order to reduce the noise in the
images, a background image was created and subtracted from all original images.
This process resulted in images having only the RBCs visible. To enhance its
quality, image filtering was applied using ImageJ (NIH). Finally, the grey scale
images were converted to binary images adjusting the threshold level. Detailed
description of the image analysis procedure can be found elsewhere [10]
.
Results and Discussion
CFL and RBC separation
By using a microchannel with a confluence fabricated by a soft lithography
technique we have obtained a very interesting blood flow phenomenon that
happens at microscale level. Figure 3 shows flow visualizations around the
confluence on the both trace particles in pure water and human RBCs containing
Figure 3. Image of trace particles in pure water (up) and in vitro blood (down) obtained after “Zproject” (maximum intensity function). This microchannel was fabricated by a soft
lithography technique.
From Figure 3 we can clearly observe a CFL in middle of the microchannel after
the apex of the confluence. In contrast this flow phenomenon is not observed with
pure water. Recently, this phenomenon was also observed in microchannels
fabricated by a soft xurography technique [5]. Detailed studies about this
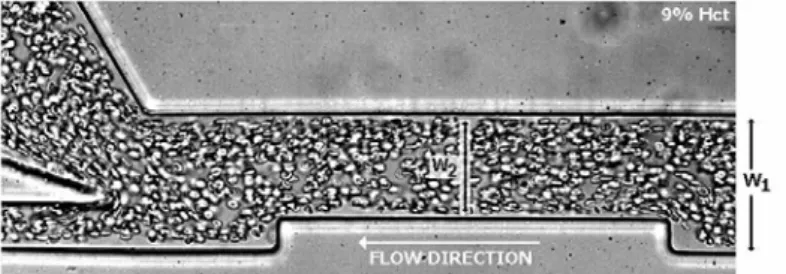
phenomenon are currently under way and will be published in due time. Figure 4
shows an image with the flow of RBCs through a 75% constriction for a constant
flow rate of 1 L/min. Measurements on the CFL thickness were also performed in
Figure 4. Flow visualization of in vitro blood in a micrchannel with the following dimensions: W1 = 100 m and W2 = 75m.
By using a combination of image analysis techniques we are able to automatically
measure the CFL thickness before and after the artificial contractions. Figure 5
shows clearly that in both cases the constriction enhances CFL thickness.
Furthermore, it is also clear that the enhancement is more pronounced for the
channel with a contraction ratio (W2/W1) equal to 0.25 than 0.75 [11]. This
separation strategy will be crucial to obtain a low Hct and consequently perform
cell deformability measurements.
RBC deformation
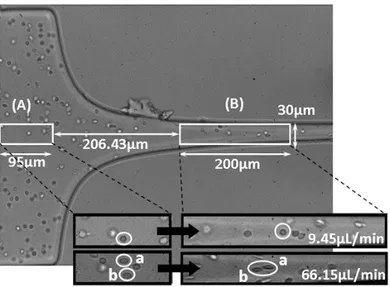
To analyze the deformability of RBCs, the cells were measured in two pre-defined
regions, (A) and (B) as shown in Figure 6. Region (A) is located upstream of the
hyperbolic contraction and region (B) comprises a narrow part of the contraction
region. Both regions are located axially along the centerline of the channel.
The flowing cells selected for measurement are measured twice in region (A) and
(B). The RBC deformation was defined by the deformation index (DI) as
(LMajor−LMinor)/( LMajor + LMinor), where LMajor and LMinor refer to the major (primary) and
minor (secondary) axis lengths of the ellipse best fitted to the cell. These values
were obtained by using ImageJ (NIH).
Figure 6 shows an original image of the PDMS hyperbolic microchannel and the
view of flowing RBCs at different flow rates (9.45 µl/min and 66.15 µl/min) and in
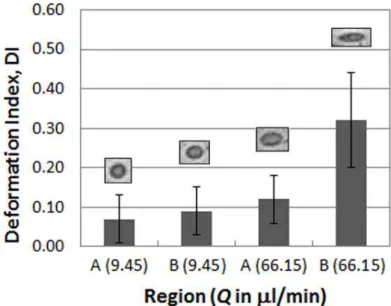
two pre-defined regions, (A) and (B). In Figure 7 the average deformation index
Figure 7. Comparison of deformation index at different flow rates in different regions.
As can be seen in Figure 7, for both flow rates, DI is higher in the hyperbolic
contraction region (B) where the RBCs are submitted to a strong extensional flow.
In the contraction region (B), DI increases substantially with the flow rate as a
consequence of the higher strain rate to which the RBCs are submitted. These
results evidence the highly deformable nature of RBCs under strong extensional
flows and the present hyperbolic-shape microchannel is suitable for RBC
deformability examination.
Acknowledgment
References
1. Lima, R., Ishikawa, T., Imai Y., and T., Yamaguchi T. (2012). In Single and two-Phase Flows on Chemical and Biomedical Engineering (Dias, R., Martins, A.A., Lima, R. and Mata, T.M. eds.), 513–547, Bentham Science Publishers: Netherlands.
2. Garcia, V., Dias, R. and Lima, R., (2012). In Applied Biological Engineering – Principles and Practice (Ganesh, R. Naik ed.), Vol. 17, 394-416, InTech.
3. Lima, R., Wada, S., Tanaka, S., Takeda, M., Ishikawa, T., Tsubota, K., Imai, Y. and Yamaguchi, T. (2008). Biomedical Microdevices. 10, 153-167.
4. Leble, V., Lima, R., Dias, R.P., Fernandes, C.S., Ishikawa, T., Imai, Y., and Yamaguchi T. (2011). Biomicrofluidics. 5, 044120.
5. Pinto, E., Pinho D., Bento, D., Correia, T., Garcia, V., Dias, R., Miranda, J.M. and Lima, R. (2013). 5ºCNB, 301-306.
6. Kim, S., Ong, P.K., Yalcin, O., Intaglietta, M., and Johnson, P.C. (2009). Biorheology. 46, 181-189.
7. Fujiwara, H., Ishikawa, T., Lima, R., Matsuki, N., Imai, Y., Kaji, H., Nishizawa, M. and Yamaguchi, T. (2009). J. Biomech. 42, 838-843.
8. Hou, H.W., Han, J. and Lima, C.T. (2010). Lab.Chip. 10, 2605-2613.
9. Yaginuma, T., Oliveira, M.S.N., Lima, R., Ishikawa, T., Yamaguchi, T. (2011). Microtech Conference and Expo Boston, MA, USA, 2, 505.
10. Yaginuma, T., Oliveira, M.S.N., Lima, R., Dias, R., Ishikawa, T., Imai, Y., Yamaguchi, T. (2012). ECCOMAS Thematic Conference on Computational Vision and Medical Image Processing 209-211.