Review
OBTAINING WEATHER DATA FOR INPUT TO CROP
DISEASE-WARNING SYSTEMS: LEAF WETNESS
DURATION AS A CASE STUDY
Mark L. Gleason1*; Katrina B. Duttweiler1; Jean C. Batzer1; S. Elwynn Taylor2; Paulo Cesar Sentelhas3; José Eduardo Boffino Almeida Monteiro3; Terry J. Gillespie4
1
Iowa State University - Dept. of Plant Pathology - Ames, IA - 50011 - USA. 2
Iowa State University - Dept. of Agronomy - Ames, IA - 50011 - USA.
3
USP/ESALQ - Depto. Ciências Exatas, C.P. 09 - 13418-900 - Piracicaba, SP - Brasil.
4
University of Guelph - Dept. of Land Resource Science - N1G 2W1 Guelph, ON - Canada. *Corresponding author <[email protected]>
ABSTRACT: Disease-warning systems are decision support tools designed to help growers determine when to apply control measures to suppress crop diseases. Weather data are nearly ubiquitous inputs to warning systems. This contribution reviews ways in which weather data are gathered for use as inputs to disease-warning systems, and the associated logistical challenges. Grower-operated weather monitoring is contrasted with obtaining data from networks of weather stations, and the advantages and disadvantages of measuring vs.estimating weather data are discussed. Special emphasis is given to leaf wetness duration (LWD), not only because LWD data are inputs to many disease-warning systems but also because accurate data are uniquely challenging to obtain. It is concluded that there is no single “best” method to acquire weather data for use in disease-warning systems; instead, local, regional, and national circumstances are likely to influence which strategy is most successful. Key words: integrated pest management, site-specific weather data, disease forecasting, disease prediction, sustainable agriculture
OBTENÇÃO DE DADOS METEOROLÓGICOS PARA SISTEMAS
DE ALERTA FITOSSANITÁRIO: O CASO DA DURAÇÃO DO
PERÍODO DE MOLHAMENTO FOLIAR
RESUMO: Os sistemas de alerta fitossanitário são ferramentas de suporte à decisão desenvolvidos para ajudar os agricultures a determinar o melhor momento da aplicação das medidas de controle para combater as doenças de plantas. As variáveis meteorológicas são dados de entrada quase que obrigatórios desses sistemas. Este trabalho apresenta uma revisão sobre os meios pelos quais as variáveis meteorológicas são coletadas para serem usadas como dados de entrada em sistemas de alerta fitossanitário e sobre os desafios associados à logística de obtenção desses dados. Essa revisão compara o monitoramento meteorológico ao nível do produtor, nas propriedades agrícolas, com aquele feito ao nível de redes de estações meteorológicas, assim como discute as vantagens e desvantagens entre medir e estimar tais variáveis meteorológicas. Especial ênfase é dada à duração do período de molhamento foliar (DPM), não somente pela sua importância como dado de entrada em diversos sistemas de alerta fitossanitário, mas também pelo desafio de se obter dados acurados dessa variável. Pode-se concluir, após ampla discussão do assunto, que não há um método único e melhor para se obter os dados meteorológicos para uso em sistemas de alerta fitossanitário; por outro lado, as circunstâncias a nível local, regional e nacional provavelmente influenciam a estratégia de maior sucesso.
Palavras chave: manejo integrado de doenças, dados meteorológicos específicos do local, previsão de doenças, estimativa de doenças, agricultura sustentável
INTRODUCTION
Disease-warning systems, also known as dis-ease forecasters, are decision support tools that help
to take an action - usually to apply a fungicide or bac-tericide spray - to prevent disease outbreaks and avoid economic losses.
Disease-warning systems are key elements of Integrated Pest Management (IPM) efforts to reduce excessive use of chemical pesticides. There are sev-eral potential incentives for growers to adopt warning systems. By substituting risk-assessment-based spray timing for traditional calendar-based pesticide spray-ing, growers can reduce spray frequency, limiting the health and environmental hazards of pesticide use while presenting an environmentally friendly image to cus-tomers. In some instances, implementation of disease-warning systems may also enhance profitability by re-ducing input costs (Funt et al., 1990; Gleason et al., 1994).
In the past 40 years, scores of disease-warn-ing systems have been developed and validated for doz-ens of crops. A few are in wide use by growers, and represent encouraging success stories in IPM (Gleason et al., 1995). Most warning systems, however, have not made the transition from scientific validation to real-world application (Magarey et al., 2002).
Why are so many of these tools languishing in the toolbox? This implementation shortfall is not lim-ited to disease-warning systems, but also character-izes most other types of agricultural decision support systems (DSSs), whose rate of grower adoption is widely perceived as disappointing (Matthews et al., 2008; McCown et al., 2002). One reason for this lack of implementation is failure of system developers to adequately involve growers and other end users in de-velopment and testing of the systems (McCown, 2002). The result of this disconnection between sys-tem developers and syssys-tem users can be failure of the systems to meet growers’ needs.
One way to make DSSs more user-friendly is to streamline the logistics of using them. Campbell & Madden (1990) describe several logistical barriers to grower adoption of disease-warning systems - incon-venience, added cost and labor, and difficulty in re-sponding to advisories in a timely way - that are often encountered in the process of obtaining and handling weather data inputs. Grower adoption of warning sys-tems is unlikely to increase unless these barriers come down.
This article reviews ways by which weather data are obtained for input to warning systems, touch-ing on logistical advantages and drawbacks of each approach. Leaf wetness duration (LWD), defined as the period of time that free water is present on plant surfaces, is highlighted because it illustrates many of these points, and because of its importance in govern-ing the activity of many foliar pathogens.
DISCUSSION
Measurements, estimates, and errors
Weather parameters that are commonly used as inputs to disease-warning systems include air tem-perature, rainfall, relative humidity (RH), and LWD. Additional variables, such as wind speed, wind direc-tion, and solar radiadirec-tion, are inputs to only a few warn-ing systems.
Measurements made at weather stations are the foundation for all types of weather inputs to warn-ing systems. These data are sometimes measured on individual farms, either within or near a crop canopy of interest. Alternatively, data measured at regional net-works of weather stations may be localized to a par-ticular farm using Global Positioning Systems (GPS), Geographic Information Systems (GIS) methods, and meteorological models (Royer et al., 1989; Magarey et al., 2001; Thomas et al., 2002).
Do-it-yourself weather monitoring
Some growers or farm managers obtain warn-ing-system inputs from weather stations on their own farms. In some cases, these units automatically pro-cess the weather measurements through a warning system algorithm to output spray advisories, thereby saving growers the chore of making the calculations themselves. Do-it-yourself weather monitoring can be risky, however, in part because individuals operating the weather stations often lack training in making me-teorological measurements.
In authors’ experience, key mistakes are of-ten made in installing on-farm weather monitoring equipment. As a result, tipping bucket rain gauges are not leveled adequately, temperature sensors are exposed to direct sunlight, and LWD sensors are not positioned at appropriate angles or canopy locations (Lau et al., 2000). Such errors can severely compromise the ac-curacy of weather data inputs to warning systems.
Once data-gathering begins, RH sensors may drift out of calibration, spider webs may immobilize a rain gauge tipping bucket, bird excrement may pile up on LWD sensors, and data-loggers may exhaust their batteries at crucial times. More spectacular misadven-tures are not uncommon: lightning strikes cause sta-tion meltdowns, mowers shred wires, and cultivator tines uproot data-loggers.
effec-tively. Preoccupied with a myriad of other management duties, they may overlook misbehaving weather sen-sors. Even technologically sophisticated growers may lack sufficient expertise to notice weather equipment failures and diagnose their causes.
If a warning system fails to function reliably, end users may mistakenly blame the warning system itself, even when erroneous weather-data inputs may actually be at fault. But growers who have absorbed significant crop losses as a result of apparent warn-ing system failure - for whatever cause - are wary of trying to use the system again. In general, growers stand to lose far more money from a disease outbreak, due to reduced yield or degraded quality of a crop, than they might gain from saving a few pesticide sprays by using a warning system (Turechek & Wilcox, 2005).
Although weather-monitoring equipment has become cheaper and simpler to use, it needs to be op-erated in such a way that its data are reliable enough for use in warning systems. Sutton et al. (1984) cau-tioned that those responsible for weather monitoring “would do well to consult with agricultural meteorolo-gists to obtain a basic appreciation of the functioning, calibration, protection, and limitations of instruments, as well as the requirements for maintaining sensors and data-loggers in the field.” Unfortunately, this advice is heard too rarely and heeded even less often.
To verify that weather stations and their sen-sors are working properly, regularly scheduled main-tenance and error checking are essential. As a practi-cal matter, this should be done by trained technicians. For a fee, growers can sometimes send their equip-ment to the vendor or manufacturer for repair and recalibration after each growing season, but in our experience this is seldom done. Furthermore, once-per-year maintenance may not be frequent enough to prevent critical measurement errors from occurring. Although the need for regular maintenance of weather-monitoring equipment is often not empha-sized strongly by vendors, or IPM educators, it is vi-tal to reliable long-term performance of disease-warn-ing systems.
Proliferation of low-cost, on-farm weather sta-tions represents both opportunities and challenges for researchers, IPM educators, and farm advisors. Many more growers can now afford to purchase weather stations, and can therefore utilize weather-based dis-ease-warning systems. A resulting challenge is to help growers learn how to install stations properly and maintain them effectively over sustained periods. In some cases at least, sustainable operation of weather-based warning systems may require reliance on alter-native sources of weather data.
Networks of weather stations
Regional networks of automated stations of-fer an alternative strategy to deliver weather data for warning systems. Typically, measurements are made at multiple weather stations arrayed across a region, downloaded and processed centrally, and the data and/ or warning system advisories are made available to subscribers.
In North America and also in Brazil, operational modes of agriculture-focused weather station networks are diverse. Some are supported primarily by public funds, but may be supplemented by user fees. In North America, private-sector networks may either be verti-cally integrated (weather stations owned and operated by the same corporations that process data and pro-vide advisories) or more specialized (companies de-velop and provide advisories for subscribers based on data from public-sector weather stations). In Brazil, agriculture-focused weather station networks are sup-ported mainly by public funds. Privately operated net-works of stations are in development in Brazil, but companies that provide weather-based advisories to subscribers currently rely on data from public-sector weather stations.
Historical examples - An early example of a warning system that relied on a network of weather stations was the TOM-CAST warning system for to-matoes, which was deployed in southern Ontario in the late 1980s (Pitblado, 1988). Financing for this net-work came from the provincial government and a grower organization. Each of the 13 stations deployed across three counties was assumed to provide relevant data for processing-tomato growers up to 16 km away from the station in nearly flat terrain. Once per week during the first month of the growing season and three times per week after fungicide sprays began, scouts drove to each station and downloaded the data-logger to a storage module. Data were then processed at a central location, and TOM-CAST advisories were made available to growers as recorded messages on toll-free phone numbers (Gleason et al., 1995). By the mid-1990s, data were downloaded remotely by tele-phone links with each station, greatly reducing the network’s labor requirements. Currently, data from weather stations are transmitted to a central process-ing site by radiotelemetry (R. Pitblado, Ridgetown Col-lege, Ridgetown, Ontario, Canada, personal commu-nication).
adviso-ries, was SkyBit Inc. (Russo, 1999). SkyBit collects data from hundreds of publicly owned and operated automated weather stations over much of North America, whose data are available for public use at little or no charge, on a near-real-time basis. For a monthly fee, SkyBit subscribers receive value-added products based partly on these “free” data, including site-spe-cific estimates of weather conditions and pest risks on their farms, developed with Global Positioning System (GPS) and Geographic Information Systems (GIS) software in conjunction with warning system algo-rithms. These estimates are localized to the vicinity of each farm. The GPS software pinpoints the location of each farm or field. The GIS programs generate in-terpolations of weather data, and then calculate dis-ease risk, for farms located between stations by ad-justing the weather station measurements with infor-mation about surface topography, including elevation and aspect. The SkyBit system provides advisories in near-real time, as well as forecasts up to 3 days in ad-vance, at a spatial resolution of about 1 km2
.
An array of >2,000 automated weather stations in the western U.S. (California, Oregon, Washington, Idaho, and Arizona), owned by a consortium of farm-management companies, is the largest private-sector network ever developed for agricultural advisory sys-tems. These stations are spaced 5 to 10 km apart in coastal hills and valleys, and 20 km apart in flatter ter-rain (Thomas et al., 2002). Data are collected every 15 min by radio telemetry and then sent by phone mo-dems to central sites for processing. Products that in-clude color-coded, regional risk maps for target pests, diseases, and other agricultural risks are distributed via the Internet. Software processing of weather data is conceptually similar to that of SkyBit. Warning sys-tem advisories are issued for 12 diseases and six in-sect pests of grape, melon, tomato, pepper, potato, strawberry, hops, apple, pear, and lettuce.
Reliability of data - Accuracy of site-specific weather estimates varies with the parameter being es-timated, among other factors. An assessment of SkyBit estimates for sites in the Midwest U.S. found that es-timation error was less for temperature than for LWD (Gleason et al., 1997). Similarly, for the western U.S. site-specific estimation network, Thomas et al. (2002) noted that station-to-station data correlation was high-est for temperature, intermediate for RH and dew point, and lowest for LWD. This is not surprising, because air temperature is more conserved spatially than LWD, which is highly variable because it responds to subtle differences in RH, wind speed, cloud cover, and plant canopy architecture (Sentelhas et al., 2005; Sutton, 1977; Pereira et al., 2002). Several efforts have been
made to reduce LWD estimation errors in site-specific estimations (e.g, Kim et al., 2002; Sentelhas et al., 2006), in order to more confidently use estimated LWD data as warning-system inputs.
A related factor influencing accuracy of net-work-based weather data estimates is the distance be-tween stations (Gleason et al., 1995). Ideally, a network would utilize the fewest possible stations consistent with delivering acceptably accurate weather estimates to its clients, in order to deliver as cost effective a service as possible. Among the factors that influence site-location decisions for weather stations are spatial distribution of clients’ farms, spatial patterns of variation in weather conditions (Thomas et al., 2002), and the political and economic influence of individual growers.
For operation of disease-warning systems, net-works can offer both advantages and disadvantages in comparison to do-it-yourself weather monitoring. For growers, the advantages are readily apparent: the burdens and frustrations of monitoring are lifted, and the convenience of obtaining warning-system adviso-ries - by fax, email, or the web - is dramatically en-hanced. These are potent factors in determining whether a warning system is likely to become part of a grower’s long-term pest management strategy.
Accuracy of on-site weather monitoring, and therefore its reliability in warning systems, is often as-sumed to exceed that of site-specific estimation. To many growers and other clients, the physical presence of weather-monitoring hardware in their fields is more reassuring than data transmissions from an invisible (to them) network of stations (Magarey et al., 2001). A U.S. vendor of weather measurement devices has popular-ized the appealing slogan, “to measure is to know.” But to know what, exactly? As discussed above, do-it-your-self weather monitoring is fraught with pitfalls that can compromise the accuracy of measurements. No weather-measurement device is sufficiently foolproof to obviate the need for proper installation and maintenance, but these quality-control factors often receive little con-sideration from do-it-yourself users.
SkyBit, Inc., personal communication), networks can be trained to learn local patterns of weather variation, and thereby iteratively to improve the accuracy of lo-cal site-specific estimates as time passes (Gillespie et al., 1993). As computing power continues to grow and become cheaper, these capabilities are likely to increase. Seen from this perspective, weather station networks appear to offer the best hope for providing durable sources of reliable weather data for warning systems (Magarey et al., 2005).
Weather stations are only as valuable as their quality-control procedures, however. Some weather station networks in North America and Brazil have been dogged by unacceptably high levels of station and sen-sor failure. Often, these shortcomings are traceable to budget problems. In some cases, networks are built around relatively low-cost monitoring hardware that turns into a financial black hole of maintenance and replacement costs after being deployed. When main-tenance budgets shrink, technician training may weaken, maintenance visits to stations become fewer, repair and replacement schedules stretch out longer, data-checking becomes more cursory, and weather data quality drops. As these conditions persist, the risk rises that clients will lose faith in network-based weather systems. The “garbage-in-garbage-out” warn-ing is as meanwarn-ingful for weather station networks as for do-it-yourself monitoring.
The future of site-specific weather data es-timation - Additional technologies appear likely to en-hance the accuracy of site-specific weather estimates in the near future. For example, ground-based radar, currently used primarily in avionics, also has the ca-pability of locating areas of rainfall in near-real time. Local areas of rainfall, caused by small-scale convec-tive systems, are among the most elusive phenomena for weather station networks, since these systems can drop substantial rainfall on swaths that are only a few kilometers wide, and thus may be invisible to stations situated on a broader-scale grid. By timing the return rate of radar reflections from precipitation, it is pos-sible to track the passage of rainfall across a landscape. Although rainfall amount is more difficult to determine than its timing of occurrence due to radar attenuation errors, rainfall occurrence can help to pinpoint leaf wetness duration, which is a key input to disease-warning systems. Preliminary attempts have been made to use radar estimates of rainfall as inputs to dis-ease-warning systems (Rowlandson, 2006).
Satellite-based scans of the earth’s surface may eventually enhance site-specific weather estimation. As the spatial resolution of these scans increases, they may be able to fill gaps in cloud-cover or albedo data that
currently hamper estimation of net radiation, and thus the application of energy balance models to estimat-ing LWD associated with dew periods.
The challenge of timeliness
The need for timeliness cuts across all meth-ods of obtaining weather data inputs for warning sys-tems. A key question is whether growers have suffi-cient time to respond effectively to spray advisories once they are issued. A fungicide-spray warning is of little use to a grower who cannot apply the needed spray in a timely manner due to rainfall, impassably muddy terrain, excessive wind, or entry interval re-strictions on fungicides. On some farms, applying a single spray to the entire crop may require several days to a week due to the large size of the planting, speed and number of sprayers, labor availability, or other fac-tors.
Another constraint on timeliness is the mode of action of the pesticides used. Many of the most af-fordable fungicides and bactericides have a contact mode of action, meaning that they are effective against target microorganisms only on the outer surfaces of plants. Once a fungus or bacterium has invaded a plant, contact fungicides cannot stop the infection process. Pesticides with so-called penetrant (also known as sys-temic) modes of action can stop infections that have already started, but the time window for this eradicative activity is limited to a few hours or days.
These logistical constraints on timeliness mean that warning systems will be accepted only when growers have adequate time to respond to advisories. When growers operate their own weather stations, they may overshoot action thresholds if, as sometimes hap-pens, they do not retrieve data sufficiently often. Al-though networks of stations may process data more frequently, a lag of 8 to 12 hours between weather measurements and issuance of advisories is not un-common due to time requirements of data retrieval and processing from multiple stations.
The special case of leaf wetness duration
Leaf wetness duration is the period of time during which free water – from dew, rainfall, fog, or irrigation - is present on the aerial surfaces of crop plants. LWD is a non-standard meteorological param-eter because it is a property of surfaces as well as the atmosphere. There is no widely accepted standard for calibrating LWD sensors, and the vast majority of au-tomated weather stations worldwide do not include these sensors. Nevertheless, LWD is an important de-terminant of the development of many foliar and fruit diseases through its influence on such key processes as pathogen germination, infection, and sporulation (Yarwood, 1978; Huber & Gillespie, 1992). As a re-sult, LWD is an input to numerous disease-warning systems. The subject of measuring and estimating sur-face wetness on plants was reviewed recently by Margarey et al. (2005).
Leaf wetness duration is the most spatially het-erogeneous weather input to warning systems. It var-ies not only with weather conditions but also with the type of crop, its developmental stage, and the posi-tion, angle, and geometry of individual leaves (Sutton et al., 1984). During dew periods, different micro-sites on a single leaf can vary in LWD by several hours per day. This immense heterogeneity poses a formidable challenge for measuring or estimating LWD. If using LWD sensors, where should they be placed? If using estimates, what part of the canopy should be used as the reference point?
Measuring LWD - Many types of sensors have been employed to measure LWD. Among the first were mechanical sensors utilizing strings that were maintained under slight tension during exposure (Sutton et al., 1984). As it became wetter or drier the string would contract or relax, resulting in movement of an attached ink-pen marker on a revolving paper chart.
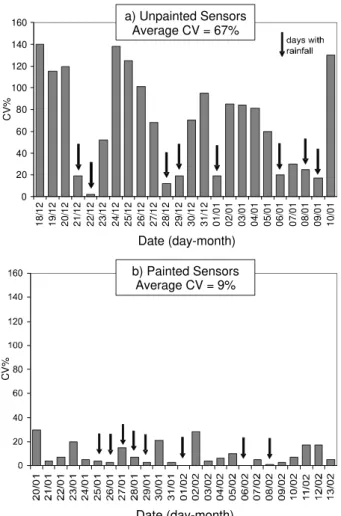
By the mid-1980s, mechanical LWD sensors and strip charts were superseded by electronic sors and automated data-loggers. Most electronic sen-sors were based on a design developed by Davis & Hughes (1970), which sensed the presence of wetness as a drop in electrical resistance across two adjacent circuits etched onto a printed-circuit board. Later workers found that coating these sensors with latex paint enhanced their sensitivity to wetness (Gillespie & Kidd, 1978; Sentelhas et al., 2004a) (Figure 1), that height and angle of deployment influenced sensitivity (Figure 2), and that electronic sensors could also be fabricated as cylinders rather than flat plates (Gillespie & Kidd, 1978; Gillespie & Duan, 1987; Lau et al., 2000; Sentelhas et al., 2004b; Sentelhas et al., 2007a). A recent innovation in flat-plate sensor design
oper-ates on the principle of electrical capacitance rather than resistance (Decagon Devices, Inc., Pullman, WA, U.S.A.).
Sources of measurement error - Since there is no consensus on how or where to deploy LWD sen-sors for use in warning systems, users position them in a variety of ways, even within the same crop canopy. This uncertainty can add to the potential for error in do-it-yourself weather monitoring. Magarey et al. (2005) suggest that, if using a single LWD sensor to estimate LWD in a crop canopy, the optimal posi-tion would be just below the top of the canopy, but fully exposed to the night sky. The rationale for this recommendation is that this position can be expected to provide “worst case” or maximum LWD readings (Jacobs et al., 1990; Potratz et al., 1994), since dew
Figure 1 - Coefficient of variation (CV%) for leaf wetness duration measurements made by six unpainted (a) and six painted (b) flat plate electronic sensors that were deployed side by side, at 20º angle, facing north, at the top of a cotton crop, in Piracicaba, State of São Paulo, Brazil Arrows indicate days with rainfall. Source: Sentelhas et al. (2004a).
0 20 40 60 80 100 120 140 160
18
/12
19
/12
20
/12
21
/12
22
/12
23
/12
24
/12
25
/12
26
/12
27
/12
28
/12
29
/12
30
/12
31
/12
01
/01
02
/01
03
/01
04
/01
05
/01
06
/01
07
/01
08
/01
09
/01
10
/01
C
V
%
Date (day-month) a) Unpainted Sensors
Average CV = 67%
Date (day-month)
C
V
%
duration is greatest at the top of the canopy, and place-ment just below the top of the canopy would slow morning drying by providing some protection from wind and sunlight.
Heterogeneity of LWD within a crop canopy can vary with the type of crop canopy and with cli-mate. Sentelhas et al. (2005) found statistically signifi-cant differences in LWD between the top and bottom of apple canopies in Iowa, U.S., and of maize cano-pies in Ontario, Canada. In a coffee plantation in São Paulo State, Brazil, however, there were no differences in LWD among canopy positions. A reason for this dif-ference with apple and maize canopies is that the cof-fee plants are of conical shape, which exposes leaves to the sky at all canopy heights, so that dew periods began almost simultaneously at all leaf positions. A trend toward greater LWD at the bottom than the top of the canopy - a difference of about 1.5 hr day–1 -was explained primarily as the result of differences in dry-off; during the morning, the top of the coffee plants received more total solar radiation and stronger wind than the other positions, resulting in a more rapid
dry-off. For grapes in São Paulo State that were cul-tivated in a north-south hedgerow system, LWD did not differ between the top and inside the canopy (Sentelhas et al., 2005). The well pruned, hedgerow-like canopy structure probably allowed all sensors to cool at approximately the same rate during the night, and therefore to form dew at almost the same time. During the morning, there was sufficient space be-tween rows that all the sensors received about the same influence of sunshine and wind. These results empha-size that canopy architecture is an important factor to consider when deciding where to place LWD sensors, and how many sensors to deploy.
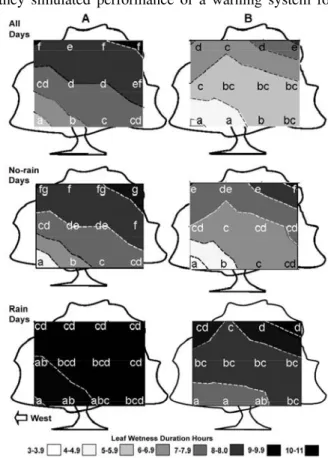
Within-canopy LWD heterogeneity can impact performance of a disease-warning system in some situations. Batzer et al. (2008) found substantial LWD variability within the canopy of mature, semi-dwarf apple trees (4 to 5 m tall) in Iowa (Figure 3). When they simulated performance of a warning system for
9.93a 9.77a
8.80c 9.15b 9.03bc
0 2 4 6 8 10 12
30 70 110 150 190
Height (cm) a
9.93a
9.77b 8.80c
0 2 4 6 8 10 12
0 30 45
Angle (degrees)
L
W
D
(h
ours)
L
W
D
(ho
urs)
b
Figure 2 - Mean leaf wetness duration (LWD) obtained with painted flat plate sensors (one per position) deployed at different heights (a), at 30º to horizontal, and angles (b), at 30-cm height, over mowed turfgrass for 50 days in Piracicaba, State of São Paulo, Brazil. Means followed by the same letter are not significantly different (p < 0.01). Adapted from Sentelhas et al. (2004b).
sooty blotch and flyspeck (SBFS) disease that was based on cumulative hours of LWD, the date on which the action threshold was reached varied by as much as one month depending on where a LWD sensor was located within the canopy. Timing errors of this mag-nitude could be expected to lead to failures of the warning system. Even at different lateral positions at the base of the apple canopy, cumulative LWD varied by as much as 44%. These micro-site differences were much less pronounced during rainfall-associated wet periods than dew periods, because rainfall tends to minimize these differences. The findings suggested that canopy heterogeneity in LWD is likely to be accentu-ated in continental climates where LWD is predomi-nantly caused by dew rather than rain.
A field experiment by Duttweiler et al. (2008) emphasized this potential problem in using LWD mea-surements in large crop canopies to operate a warn-ing system. Duttweiler monitored LWD from sensors located at 1.5-m height near the base of the canopy of 4- to 5-m-tall apple trees during 19 site-years in or-chards in Iowa and Wisconsin in the Upper Midwest U.S., and in North Carolina in the Southeast U.S. For the Upper Midwest sites, using these LWD data as in-puts to the SBFS warning system resulted in substantial timing errors in determining the action threshold -both false-positive errors (threshold reached too early) and false-negative errors (threshold reached too late) (Figure 4). Substituting RH data measured at the same within-canopy position, she found that cumulative hours of RH>97% reduced both types of errors in comparison to LWD. No such predictive advantage of cumulative RH hours was evident in data from North Carolina, however. Because RH is more spa-tially conserved than LWD, it may be preferable to LWD for use in warning systems that rely on mea-surements in large-scale crop canopies. However, this potential advantage of RH may apply primarily in cli-mates where LWD is caused mainly by dew, rather than in climates like that of western North Carolina, where most LWD is associated with rainfall. Thus, crop canopy and climate can interact in influencing the choice of moisture-related parameter for input to a warning system.
One way to reduce the spatial heterogeneity of in-canopy LWD measurements is to deploy more sen-sors. Based on measurements in a grape canopy in New York State, Magarey (1999) calculated the num-ber of electronic LWD sensors needed to provide 95% certainty that daily LWD estimation errors were within an acceptable range. Not surprisingly, deploying more sensors resulted in smaller errors. In practice, the num-ber of sensors deployed is constricted by cost, and one LWD sensor per crop canopy is often the norm.
Locating LWD sensors outside a crop canopy can circumvent some of the mechanical risks associ-ated with in-canopy measurements, such as damage from mowers, sprayers, and cultivators. Furthermore, the potential for measurement artifacts associated with canopy heterogeneity is eliminated. Sensors and data-loggers may also be easier to access and service if they are located outside pesticide-spray zones and the as-sociated restrictions of pesticide re-entry interval regu-lations. An additional practical consideration is that, for annual crops, data-loggers and sensors outside crop canopies may not need to be moved with each crop-ping season in concert with crop growth patterns and annual rotation patterns, reducing costs and labor.
Zhang & Gillespie (1990) showed that LWD measurements made at a nearby weather station could be calibrated to in-canopy LWD with acceptable ac-curacy. Sentelhas et al. (2004b, 2005) demonstrated that LWD measurements made at 30-cm height over turfgrass were quite similar to those measured at the top of five types of crop canopies - apple, coffee, maize, grape, and muskmelon - despite different canopy height, architecture, and climate. These find-ings suggest that data from nearby weather stations
Figure 4 - Difference between the actual Sooty Blotch and Flyspeck disease (SBFS) threshold day (7 days before the first appearance of SBFS) and the threshold day predicted by 175 cumulative hours of LWD (A) and 192 cumulative hours of RH > 97% (B) for each site year in the study in Iowa (IA), Wisconsin (WI), and North Carolina (NC). Week 0 represents optimal predictions (occurring within 1 wk before the actual threshold day). Negative values represent false positives (spray threshold reached too early), whereas positive values represent false negatives (spray threshold reached too late). Adapted from Duttweiler et al. (2008).
0 1 2 3 4 5 6 7
-10 -9 -8 -7 -6 -5 -4 -3 -2 -1 0 1 2 3 4 5 6 7 8 9 10
NC WI IA
A
0 1 2 3 4 5 6 7
-10 -9 -8 -7 -6 -5 -4 -3 -2 -1 0 1 2 3 4 5 6 7 8 9 10
B
Weeks
N
u
m
b
e
r
o
f
s
it
e
y
e
a
can be used as surrogates for in-canopy LWD mea-surements in disease-warning systems.
Modeling LWD - Faced with the frustrations of LWD measurement, agricultural meteorologists and plant pathologists have developed models to estimate LWD. These efforts, spanning more than 50 years, were reviewed by Huber & Gillespie (1992) and Magarey et al. (2005).
Models for estimating LWD are often classi-fied into two general types, physical and empirical. Physical models utilize energy balance principles to simulate water deposition and dry-off on plant surfaces (Monteith, 1957; Monteith & Unsworth, 1990), based on air temperature, RH, wind speed, solar radiation, cloud cover, and sometimes other variables.
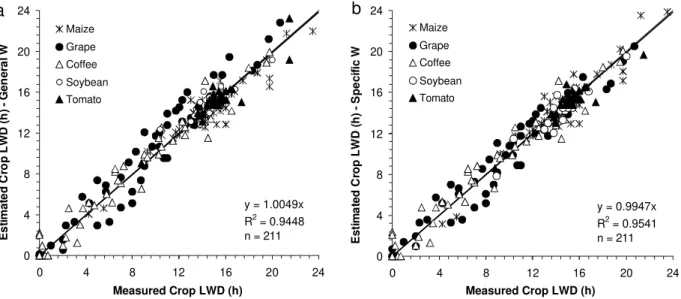
Among the advantages of physical models is that they can be highly accurate (±1 h day–1) (Pedro Junior & Gillespie, 1982). In addition, because they are based on physical principles, they have potential to be readily portable among climates and regions (Magarey et al., 2006). A serious limitation for practi-cal application is that many physipracti-cal models require certain input parameters, such as net radiation, cloud cover, or infrared radiation, that are not available at most weather stations. On the other hand, physical models have been applied successfully to the practi-cal problem of obtaining in-canopy LWD data for use in warning systems. For example, Sentelhas et al. (2006) showed that a three-step process could be used to derive in-canopy LWD estimates from nearby weather stations that lacked LWD sensors (Figure 5). First, a Penman-Monteith energy balance model was
used to derive LWD estimates at a weather station lo-cated over turfgrass. Next, the estimated LWD was correlated to measured LWD at the top of the cano-pies of several types of crops. Finally, a correction fac-tor was applied. These estimates were accurate to within 1 h day–1, which is well within the variability associated with in-canopy sensor measurements (Magarey et al., 2001).
Empirical modeling takes a different approach, using statistical best-fit algorithms to help choose pa-rameters and functions that yield the most accurate estimates of LWD. For example, empirical approaches have used classification and regression trees (Gleason et al., 1994), neural networks (Francl & Panigrahi, 1997), and fuzzy logic (Kim et al., 2004).
Compared to physical models, empirical LWD models possess a different set of positives and nega-tives for application to warning systems. Some of these models depend on relatively few input param-eters (e.g., Gleason et al., 1994), and therefore can be utilized in more locations than physical mod-els that are more input-heavy. On the other hand, although empirical models can be highly accurate for sites and regions where they are developed, they may not be as portable as physical models because empirical models depend on best-fit rather than physical principles. However, Sentelhas et al. (2007b), in validating an empirical model that used hours of RH>90% as a surrogate for LWD, showed that adjusting the RH threshold to account for regional climate differences resulted in LWD estimates that were as accurate as those derived from physical mod-els.
Figure 5 - Crop leaf wetness duration (LWD) estimated by multiplying estimated “reference” LWD by (a) general W and (b) specific W
coefficients compared to the LWD measured at the top of five different crop canopies: coffee (Piracicaba, 2003), grape (Jundiaí, 2003/04), maize (Elora, 2003), soybean and tomato (Elora, 2004). Source: Sentelhas et al. (2006).
0 4 8 12 16 20 24
0 4 8 12 16 20 24
Measured Crop LWD (h)
Maize
Grape
Coffee
Soybean
Tomato
y = 1.0049x R2 = 0.9448 n = 211
a
E
s
ti
m
a
te
d
C
ro
p
L
WD
(h
)
-G
e
n
e
ra
l
W
0 4 8 12 16 20 24
0 4 8 12 16 20 24
Measured Crop LWD (h)
Maize
Grape
Coffee
Soybean
Tomato
y = 0.9947x R2 = 0.9541 n = 211
b
E
s
ti
m
a
te
dC
ro
pL
W
D
(h
)
-S
p
e
c
if
ic
The distinction made between physical and empirical models is an oversimplification. In fact, most models are hybrids of the two approaches. For ex-ample, the “physical” Penman-Monteith energy balance model incorporates parameters whose values are de-termined empirically. Conversely, the “empirical” CART/SLD model (Gleason et al., 1994) and fuzzy logic models (Kim et al., 2004, 2006) blend physical principles with statistical methods. In the CART/SLD and fuzzy logic approaches, starting with physical prin-ciples that govern the presence or absence of water on plant surfaces increased the likelihood of deriving models with acceptable predictive accuracy. Using this intuitive approach can also make hybrid models sim-pler to explain to non-meteorologists than purely physi-cal or empiriphysi-cal models (Gleason et al., 1994; Kim et al., 2002).
Hybrid models can also be portable to regions far from those where they were developed. For ex-ample, Kim et al. (2005) observed that a simple cor-rection factor enabled a fuzzy logic model to estimate LWD with acceptable accuracy in a tropical climate (Costa Rica), even though the original model had been developed in the Temperate Zone (Midwest and Great Plains of U.S.). Similar results were obtained by Sentelhas et al. (2004c) when estimating LWD with the CART/SLD model for a cotton crop in São Paulo State, Brazil. As in the RH work of Sentelhas et al. (2007b), these findings demonstrate that adaptation of LWD estimation models with empirical characteristics to new climates and regions can be accomplished rela-tively easily.
CONCLUSION
There is no single “best” method to acquire weather data for use in disease-warning systems. In-stead, local, regional, and national circumstances may influence the sustainability of each strategy. Magarey et al. (2002) present a vision for implementing agri-cultural decision-support systems that is relevant to the narrower focus of the present paper. They point out that consortia of public-sector researchers and exten-sion educators, private-sector service providers, and growers are likely to be the most sustainable arrange-ments for introducing and sustaining decision-support systems in North America, and the same generaliza-tion may hold for obtaining weather data inputs to warning systems. Researchers can undertake studies that lay the groundwork for obtaining weather data -by developing sensors and validating their performance in the environment, pioneering models that estimate weather data, and developing new ways to extend the spatial domain of weather station measurements.
Ex-tension educators can help to insure that growers’ voices are heard as a warning system’s design devel-ops and matures. Private-sector companies can pack-age the products of academic research and extension into formats that fit grower needs, while profiting from the services they provide. Growers determine which commercial services are sufficiently valuable and prac-tical to succeed, and provide feedback for improve-ments to extension personnel, researchers, and service providers.
This is a compelling vision, but other modes of obtaining weather data may be more successful in some circumstances. The do-it-yourself model may flourish for growers who are committed to meeting quality-control and other management requirements. Alternatively, a predominantly public-sector model may be more practical where the private sector does not offer suitable weather-estimation services.
Reliability of weather data inputs is the back-bone for sustainability of any of these schemes. Proper installation and timely maintenance of weather instru-mentation, along with diligent error-checking of weather data, are unglamorous but inescapable require-ments for implementing any disease-warning system successfully. This means that adequate training of weather-monitoring personnel is essential. In addition, convenience and simplicity of use will determine whether a warning system makes the transition from the toolbox to the real world of crop disease manage-ment.
ACKNOWLEDGEMENTS
To Dr. Walter Mahaffee, USDA-ARS, Corvallis, OR, for helpful advice during preparation of the manuscript.
REFERENCES
BATZER, J.C.; GLEASON, M.L.; TAYLOR, S.E.; KOEHLER, K.J.; MONTEIRO, J.E. B.M. Spatial heterogeneity of leaf wetness duration in apple trees and its influence on performance of a warning system for sooty blotch and flyspeck.Plant Disease, v.92, p.164-170, 2008.
CAMPBELL, C.L.; MADDEN, L.V. Introduction to plant
disease epidemiology. New York: John Wiley, 1990. 532p. CRESSIE, N. Statistics for spatial data. New York: John Wiley,
1993. 900p.
DAVIS, D.R.; HUGHES, J.E. A new approach to recording the wetting parameter by the use of electrical resistance sensors.Plant
Disease Reporter, v.54, p.474-479, 1970.
DUTTWEILER, K.B.; GLEASON, M.L.; DIXON, P.M; SUTTON, T.B.; McMANUS, P.S.; MONTEIRO, J.E.B.A. Adaptation of an apple sooty blotch and flyspeck warning system for the Upper Midwest United States. Plant Disease, v.92, p.1215-1222, 2008.
GILLESPIE, T.J.; DUAN, R.X. A comparison of cylindrical and flat plate sensors for surface wetness duration. Agricultural
and Forest Meteorology, v.40, p.61-70, 1987.
GILLESPIE, T.J.; KIDD, G.E. Sensing duration of leaf moisture retention using electrical impedance grids. Canadian Journal
of Plant Science, v.58, p.179-187, 1978.
GILLESPIE, T.J.; SRISTAVA, B.; PITBLADO, R.E. Using operational weather data to schedule fungicide sprays on tomatoes in southern Ontario, Canada. Journal of Applied
Meteorology,v.32, p.567-573, 1993.
GLEASON, M.L.; TAYLOR, S.E.; LOUGHIN, T.C.; KOEHLER, K.J. Development and validation of an empirical model to estimate the duration of dew periods. Plant Disease, v.78, p.1011-1016, 1994.
GLEASON, M.L.; MacNAB, A.A.; PITBLADO, R.E.; RICKER, M.D.; EAST, D.A.; LATIN, R.X. Disease-warning systems for processing tomatoes in eastern North America: Are we there yet? Plant Disease, v.79, p.113-121, 1995.
GLEASON, M.L.; PARKER, S.K.; PITBLADO, R.E.; LATIN, R.X.; SPERANZINI, D.; HAZZARD, R.V.; MALETTE, M.J.; COWGILL, W.P.; BIEDERSTEDT, D.L. Validation of a commercial system for remote estimation of wetness duration.
Plant Disease, v.81, p.825-829, 1997.
HUBER, L.; GILLESPIE, T.J. Modeling leaf wetness in relation to plant disease epidemiology.Annual Review of Phytopathology, v.30, p.553-577, 1992.
JACOBS, A.F.G.; VAN PUL, W.A.J.; DIJKEN, A. van. Similarity moisture dew profiles within a corn canopy.Journal of Applied
Meteorology, v.29, p.1300-1306, 1990.
JOHNSON, K.B.; STOCKWELL, V.O.; SAWYER, T.L. Adaptation of fire blight forecasting to optimize the use of biological controls. Plant Disease, v.88, p.41-48, 2004.
KIM, K.S.; TAYLOR, S.E.; GLEASON, M.L.; KOEHLER, K.J. Model to enhance site-specific estimation of leaf wetness duration. Plant Disease, v.86, p.179-185, 2002.
KIM, K.S.; TAYLOR, S.E.; GLEASON, M.L. Development and validation of a leaf wetness duration model using a fuzzy logic system.
Agricultural and Forest Meteorology, v.127, p.53-64, 2004. KIM, K.S.; TAYLOR, S.E.; GLEASON, M.L.; VILLALOBOS, R.;
ARAUZ, L.F. Estimation of leaf wetness duration using empirical models in northwestern Costa Rica.Agricultural and Forest
Meteorology, v.129, p.53-67, 2005.
KIM, K.S.; GLEASON, M.L.; TAYLOR, S.E. Forecasting site-specific leaf wetness duration for input to disease-warning systems.Plant
Disease, v.90, p.650-656, 2006.
LAU, Y.F.; GLEASON, M.L.; ZRIBA, N.; TAYLOR, S.E.; HINZ, P.N. Effects of coating, deployment angle, and compass orientation on performance of electronic wetness sensors during dew periods. Plant Disease, v.84, p.192-197, 2000. MAGAREY, R.D. A theoretical standard for surface wetness
estimation. Cornell: Cornell University, 1999. 208p. (Ph.D.). MAGAREY, R.D.; SEEM, R.C.; RUSSO, J.M.; ZACK, J.W.;
WAIGHT, K.T.; TRAVIS, J.W.; OUDEMANS, P.V. Site-specific weather information without on-site sensors. Plant Disease, v.85, p.1216-1226, 2001.
MAGAREY, R.D.; TRAVIS, J.W.; RUSSO, J.M.; SEEM, R.C.; MAGAREY, P.A. Decision support systems: quenching the thirst.
Plant Disease, v.86, p.4-14, 2002.
MAGAREY, R.D.; SEEM, R.C.; WEISS, A.; GILLESPIE, T.J.; HUBER, L. Estimating surface wetness on plants. In: HATFIELD, J.L.; BAKER, J.M. (Ed.)Micrometeorology in
agricultural systems. Madison: American Society of Agronomy, 2005. p.199-226. (Agronomy Monograph, 47). MAGAREY, R.D.; RUSSO, J.M.; SEEM, R.C. Simulation of surface
wetness with a water budget and energy balance approach.
Agricultural and Forest Meteorology, v.139, p.373-381, 2006.
MATTHEWS, K.B.; SCHWARZ, G.; BUCHAN, K.; RIVINGTON, M.; MILLER, D. Wither agricultural DSS? Computers and
Electronics in Agriculture, v.61, p.149-159, 2008.
McCOWN, R.L. Locating agricultural decision support systems in the troubled past and socio-technical complexity of ‘models for management’.Agricultural Systems, v.4, p.11-25, 2002. McCOWN, R.L.; HOCHMAN, Z.; CARBERRY, P.S. Probing the enigma of the decision support system for farmers: learning from experience and from theory.Agricultural Systems, v.4, p.1-10, 2002.
MONTEITH, J.L. Dew. Quarterly Journal of the Royal
Meteorological Society, v. 83, p.322-341, 1957.
MONTEITH, J.L.; UNSWORTH, M.H. (Ed.) Principles of
environmental physics. 2.ed. London: Edward Arnold, 1990. 2 9 1 p.
PEDRO JUNIOR, M.J.; GILLESPIE, T.J. Estimating dew duration. II. Utilizing standard weather station data. Agricultural
Meteorology, v.25, p.297-310, 1982.
PEREIRA, A.R.; ANGELOCCI, L.R.; SENTELHAS, P.C.
Agrometeorologia: fundamentos e aplicações práticas. Guaíba: Agropecuária, 2002. 478p.
PITBLADO, R.E. Development of a weather-timed fungicide program for field tomatoes. Canadian Journal of Plant
Pathology, v.10, p.371, 1988.
POTRATZ, K.J.; GLEASON, M.L.; HOCKMUTH, M.L.; PARKER, S.K.; PEARSTON, G.A. Testing the accuracy and precision of wetness sensors in a tomato field and on turfgrass.Journal of
the Iowa Academy of Sciences, v.101, p.56-60, 1994. ROWLANDSON, T.L. Use of precipitation duration data from
weather radar in leaf wetness duration estimates for plant disease management. Guelph: University of Guelph, 2006. 120 p. (M.S.). ROYER, M.H.; RUSSO, J.M.; KELLEY, J.G.W. Plant disease prediction using a mesoscale weather forecasting technique.
Plant Disease, v.73, p.618-624, 1989.
RUSSO, J.M. Weather forecasting for IPM. In: KENNEDY, G.G.; SUTTON, T.B. (Ed.) Emerging technologies for integrated
pest management: concepts, research, and implementation. St. Paul: American Phytopathological Society Press, 1999. 453-473p.
SENTELHAS, P.C.; MONTEIRO, J.E.B.A.; GILLESPIE, T.J. Electronic leaf wetness duration sensor: why it should be painted.
International Journal of Biometeorology, v.48, p.202-205, 2004a.
SENTELHAS, P.C.; GILLESPIE, T.J.; GLEASON, M.L.; MONTEIRO, J.E.B.A.; HELLAND, S.T. Operational exposure of leaf wetness sensors. Agricultural and Forest
Meteorology, v.126, p.59-72, 2004b.
SENTELHAS, P.C.; GILLESPIE, T.J.; MONTEIRO, J.E.B.A.; ROWLANDSON, T. Estimating leaf wetness duration on a cotton crop from meteorological data. Revista Brasileira de
Agrometeorologia, v.2, p.235-245, 2004c.
SENTELHAS, P.C.; GILLESPIE, T.J.; BATZER, J.C.; GLEASON, M.L.; MONTEIRO, J.E.B.A.; PEZZOPANE, J.R.M.; PEDRO JUNIOR, M.J.. Spatial variability of leaf wetness duration in different crop canopies. International Journal of
Biometeorology, v.49, p.363-370, 2005.
SENTELHAS, P.C.; GILLESPIE, T.J.; GLEASON, M.L.; MONTEIRO, J.E.B.A.; PEZZOPANE, J.R.M.; PEDRO JUNIOR, M.J. Evaluation of a Penman-Monteith approach to provide “reference” and crop canopy leaf wetness duration estimates.
Agricultural and Forest Meteorology, v.141, p.105-117, 2006.
SENTELHAS, P.C.; GILLESPIE, T.J.; SANTOS, E.A. Leaf wetness duration measurements: comparison of cylindrical and flat plate sensors under different field conditions. International Journal
of Biometeorology, v.51, p.265-273, 2007a.
SENTELHAS, P.C.; DALLA MARTA, A.; ORLANDINI, S.; SANTOS, E.A.; GILESPIE, T.J.; GLEASON, M.L. Suitability of relative humidity as an estimator of leaf wetness duration. Agricultural
and Forest Meteorology, v.148, p.580-591, 2007b.
SUTTON, J.C.; GILLESPIE, T.J.; HILDEBRAND, P.D. Monitoring weather factors in relation to plant disease. Plant Disease, v.68, p.78-84, 1984.
THOMAS, C.S.; SKINNER, P.W.; FOX, A.D.; GREER, C.A.; GUBLER, W.D. Utilization of GIS/GPS-based information technology in commercial crop decision making in California, Washington, Oregon, Idaho, and Arizona. Journal of
Nematology, v.34, p.200-206, 2002.
TURECHEK, W.W.; WILCOX, W.F. Evaluating predictors of apple scab with receiver operating characteristic curve analysis.
Phytopathology, v.95, p.679-691, 2005.
YARWOOD, C.E. Water and the infection process. In: KOZLOVSKI, T.T. (Ed.) Water deficits and plant growth: water and plant disease. London: Academic Press, 1978. p.141-1 7 3
ZHANG, Y.; GILLESPIE, T.J. Estimating maximum droplet wetness duration on crops from nearby weather station data.
Agricultural and Forest Meteorology, v.51, p.145-158, 1990.