www.atmos-chem-phys.net/9/2635/2009/ © Author(s) 2009. This work is distributed under the Creative Commons Attribution 3.0 License.
Chemistry
and Physics
Intercomparison of ammonia measurement techniques at an
intensively managed grassland site (Oensingen, Switzerland)
M. Norman1,*, C. Spirig2, V. Wolff3, I. Trebs3, C. Flechard2,**, A. Wisthaler1, R. Schnitzhofer1, A. Hansel1, and A. Neftel2
1Institute for Ion Physics and Applied Physics, University of Innsbruck, Innsbruck, Austria 2Agroscope Reckenholz T¨anikon Research Station (ART), Z¨urich, Switzerland
3Max Planck Institute for Chemistry, Biogeochemistry Department, Mainz, Germany *now at: Environment and Health Administration, Stockholm City, Sweden
**now at: Institut National de la Recherche Agronomique (INRA), Rennes, France
Received: 2 September 2008 – Published in Atmos. Chem. Phys. Discuss.: 19 November 2008 Revised: 2 April 2009 – Accepted: 2 April 2009 – Published: 16 April 2009
Abstract. As part of a field campaign in the framework of the NitroEurope project, three different instruments for atmo-spheric ammonia (NH3) measurements were operated
side-by-side on a managed grassland site in Switzerland: a mod-ified Proton Transfer Reaction Mass Spectrometer (PTR-MS), a GRadient of AErosol and Gases Online Registra-tor (GRAEGOR), and an Automated Ammonia Analyzer (AiRRmonia). The modified PTR-MS approach is based on chemical ionization of NH3 using O+2 instead of H3O+ as
ionizing agent, GRAEGOR and AiRRmonia measure NH+4 in liquids after absorption of gaseous NH3in a rotating
wet-annular denuder and through a gas permeable membrane, respectively. Bivariate regression slopes using uncorrected data from all three instruments ranged from 0.78 to 0.97 while measuring ambient NH3levels between 2 and 25 ppbv
during a 5 days intercomparison period. Correlation coeffi-cientsr2 were in the range of 0.79 to 0.94 for hourly aver-age mixing ratios. Observed discrepancies could be partly attributed to temperature effects on the GRAEGOR calibra-tion. Bivariate regression slopes using corrected data were
>0.92 with offsets ranging from 0.22 to 0.58 ppbv. The in-tercomparison demonstrated the potential of PTR-MS to re-solve short-time NH3fluctuations which could not be
mea-sured by the two other slow-response instruments. During conditions favoring condensation in inlet lines, the PTR-MS underestimated NH3 mixing ratios, underlining the
impor-tance of careful inlet designs as an essential component for any inlet-based instrument.
Correspondence to:M. Norman
(michael.norman@slb.nu)
1 Introduction
As the most dominant gas phase base in the atmosphere am-monia (NH3) plays a key role for the neutralization of acidic
gases and aerosol particles (Asman et al., 1998). The up-take of NH3on aerosol particles influences the aerosol
chem-ical composition (Wells et al., 1998) and controls the acidity and nitrification of precipitation (Charlson and Rodhe, 1982; Dentener and Crutzen, 1994). NH3is emitted in large
quan-tities both from natural and anthropogenic sources (Bouw-man et al., 1997). The natural sources include emission from soils, oceans, vegetation and living organisms. NH3is known
to be both emitted from and deposited to vegetation and it has positive effects on plants at low concentration, while it is harmful at higher concentrations (Fangmeier et al., 1994). However, large uncertainties still exist about the concentra-tions, surface-atmosphere exchange fluxes and cycling of at-mospheric NH3. One major uncertainty is the uptake and/or
emission rate from plants and soils. Much of this uncertainty is due to the relative scarcity of direct flux measurements, which in turn mainly has been due to the lack of reliable mea-surement techniques that can be operated automatically and with high time-resolution in the field.
One major difficulty for the development of measuring techniques for atmospheric NH3 is the simultaneous
pres-ence of NHx in the gaseous, the particulate (e.g.,
ammo-nium nitrate) and the liquid phase (NH+4(aq) in clouds and fog). The partitioning between these phases strongly de-pends on environmental factors, such as temperature and rel-ative humidity (Mozurkewich, 1993). Another difficulty is the interaction of NH3with the surface of many materials as
with any kind of inlet a challenge (Parrish and Fehsenfeld, 2000; Yokelson et al., 2003). These problems have caused the progress in the development of NH3measurement
tech-niques to be slower than for many other atmospheric com-pounds. The denuder technique is nowadays the most widely applied sampling technique for NH3(Ferm, 1979). However,
major limitations of the denuder technique are a relatively low time-resolution (minutes to hours) and the need for sub-sequent wet-chemical analysis, which may introduce errors due to sample storage and/or contamination problems when applied for in-situ measurements. Until the last decade most automatic atmospheric NH3measurements with sufficiently
low detection limits were based on wet chemistry, like for example the AMANDA technique (Ammonia Measurement by Annular Denuder sampling with on-line Analysis; Wyers et al., 1993; Erisman et al., 2001), and the DS-FIA (dif-fusion scrubber flow injection analyzer; Genfa et al., 1989; Dasgupta 1993). More recent developments of fast response techniques with low detection limits include for example Dif-ferential Optical Absorption Spectroscopy (DOAS, Gall et al., 1991), Photoacoustic Spectroscopy (Pushkarsky et al., 2002), Tuneable Diode Laser Absorption Spectroscopy (TD-LAS, Warland et al., 2001) and Chemical Ionization Mass Spectrometry (CIMS, Nowak et al., 2007).
Several attempts have been made to compare differ-ent NH3measurement techniques. An intercomparison by
Wiebe et al. (1990) tested four measurements tech-niques for NH3 by filter packs, transition-flow
reac-tors, simple and annular denuders and Fourier-Transform Infrared-Spectroscopy. Williams et al. (1992) compared five different NH3 measurement techniques including a
photofragmentation/laser-induced fluorescence instrument (PF/LIF), a molybdenum oxide annular denuder sam-pling/chemiluminescence detection technique (MOADS), a tungsten oxide denuder sampling/chemiluminescence detec-tion system (DARE), a citric acid coated denuder sam-pling/ion chromatographic analysis method (CAD/IC) and an oxalic acid coated filter pack sampling/colorimetric anal-ysis method (FP/COL). A detailed study for determining the suitability of measuring techniques for air quality monitor-ing in the Netherlands is presented by Mennen et al. (1996). The study included seven methods, a wet-annular rotating denuder (WRD or WAD), a WO3-coated thermodenuder, a
V2O5-coated thermodenuder, a DOAS system, a
photoacous-tic monitor and a chemiluminescence NOxmonitor with NH3
converter. A field intercomparison was performed by Mil-ford et al. (2000) during the ACE-2 experiment in Tener-ife and included the AMANDA and the DS-FIA. The in-formal intercomparison reported by Fehsenfeld et al. (2002) compared a first version of the CIMS for NH3
measure-ments with conventional methods like the citric acid de-nuder and the Molybdenum oxide (MoOx) converter
dif-ference method. CIMS techniques for NH3 measurements
were further tested by Nowak et al. (2006) who compared two different CIMS instruments, the NOAA Chemical
Sci-ence Division (NOAA-CSD) apparatus and the Georgia Tech (GT) low pressure tube flow reactor, in the field. An ambi-tious laboratory test of six different techniques is presented in the study by Schwab et al. (2007). The study included the TDLAS, the wet-scrubbing long-path absorption photometer (LOPAP), the wet effusive diffusion denuder (WEDD), the ion mobility spectrometer (IMS), the Nitrolux laser acousto-optical absorption analyzer as well as a modified chemilu-minescence analyzer. A recent study compared the perfor-mance of a quantum cascade laser spectrometer (QCLAS), a TDLAS and an AMANDA system both for concentration and flux measurements of ammonia (Whitehead et al., 2008). The intercomparison presented here was performed within the framework of NitroEurope (NEU, www.nitroeurope.eu). One of the main NEU objectives is to establish robust datasets of land/atmosphere exchange fluxes of nitrogen and to study their impact on greenhouse gas budgets for represen-tative European ecosystems. In line with this objective, NH3
was measured over an intensively managed grassland site at Oensingen, Switzerland, during July and August 2006. One of the main goals was to determine the drivers of surface-atmosphere exchange fluxes of NH3in grassland in relation
to meteorological conditions and management practices, in-cluding fertilization and cutting. Three different instruments were compared for measurements of atmospheric NH3: (a)
an Automated Ammonia Analyzer AiRRmoniaTM instru-ment (Mechatronics BV, Hoorn, The Netherlands) (Erisman et al., 2001), (b) the GRadient of AErosol and Gases On-line Registrator (GRAEGOR) (Thomas et al., 2009) and (c) a modified proton transfer reaction mass spectrometer (PTR-MS) (Norman et al., 2007). As far as we know, this is the first study to include these three systems. It describes results from the intercomparison, potential sources of error and the suitability of the different methods for in-situ measurements with a high temporal resolution.
2 Experimental
2.1 Site description
The field site was established in 2001 and is situated near the village of Oensingen in central Switzerland (47◦17′N, 07◦44′E) at about 450 m a.s.l. The site consists of two 50 x 150 m plots of grassland. One plot undergoes extensive management with no fertilizer application and 2–3 cuts per year and the second one is intensively managed with four fertilizer applications (150–200 kg N ha−1y−1as ammonium
The measurement site has been used for studies of carbon and greenhouse gas budgets within the EU-funded GREEN-GRASS and CarboEurope-IP programmes (Ammann et al., 2004; Flechard et al., 2005) and in ozone studies (J¨aggi et al., 2006) as well as in nitrogen studies (Ammann et al., 2007; Neftel et al., 2007).
A trailer was placed on the border between the intensively managed plot and the extensive managed plot. The measure-ments in this paper were performed above the intensively managed plot. The PTR-MS instrument was placed inside the trailer. A 17 m long inlet tube extended out onto the field and was placed on a tripod. Both the AiRRmonia analyzer and the GRAEGOR were placed in the centre of the field. The maximum distance between the AiRRmonia instrument, the GRAEGOR and the tripod with the PTR-MS inlet was 5 m. Furthermore, the prevailing wind directions parallel to the field orientation (Ammann et al., 2007) favoured minimal footprint differences for the three instruments.
The measurements presented in this paper were performed between the afternoon of 26th and midday on 31st of July 2006. This was the only period of the 2006 summer cam-paign when all three instruments were operated simultane-ously. The latest fertilisation of the field prior to the mea-surement phase occurred on 13th of July by application of liquid cattle slurry.
2.2 Measurements techniques
2.2.1 AiRRmonia
The AiRRmonia analyzer was designed for long-term moni-toring of gas-phase atmospheric NH3and it is a further
devel-opment of the AMANDA technique (Wyers et al., 1993; Eris-man et al., 2001). The AiRRmonia has been employed in na-tional NH3monitoring networks e.g., in the Netherlands and
in Denmark. Air is sampled via a 5 cm long PE (Polyethy-lene) tubing with di=0.17 cm (inner diameter) at a flow of
1 SLPM (Table 2). In the sample block (SB), absorption of NH3from the air flow takes place via a gas-permeable PTFE
(polytetrafluoroethylene) membrane into an acid buffer (or “stripping”) solution, with a scrubbing efficiency of close to 100%. Ammonium-containing aerosols are not retained by the sampling membrane. This was verified by labora-tory experiments where less than 1% and 3% of (NH4)2SO4
and NH4NO3particles, respectively, were captured (Otjes et
al., 1999). The pH of the stripping solution is subsequently raised by addition of sodium hydroxide, which triggers the release and transfer of the captured NH3 through a second
PTFE membrane in the detector block (DB), into a stream of pure deionized water in counter-flow on the other side of the membrane. The NH3transfer efficiency of the
AM-FIA detector block is 90%. The NH+4 concentration in the solution is determined by a conductivity measurement, and calibration is made using aqueous NH+4 standard solutions (cf. Slanina et al., 2001). As with similar instruments based
Table 1. Characteristics of the NH3instruments compared in this study.
Institute Detection Sampling
limit (2σ ) time
AiRRmonia ART, Z¨urich, Switzerland 120 pptv 15 min
GRAEGOR MPIC, Mainz, Germany 94 pptv 30 min
PTR-MS University of Innsbruck, Austria 90–270 pptv(1) 1 min(2)
(1)The background and hence the detection limit for the PTR-MS varies with absolute humidity, see text. (2)The sampling time for the PTR-MS is variable (seconds to minutes), but in this paper we only present 1-min sampling time data.
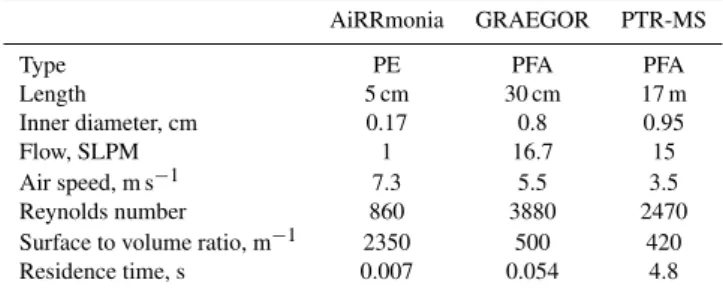
Table 2.Description of the different inlets for the NH3instruments in this study.
AiRRmonia GRAEGOR PTR-MS
Type PE PFA PFA
Length 5 cm 30 cm 17 m
Inner diameter, cm 0.17 0.8 0.95
Flow, SLPM 1 16.7 15
Air speed, m s−1 7.3 5.5 3.5
Reynolds number 860 3880 2470
Surface to volume ratio, m−1 2350 500 420
Residence time, s 0.007 0.054 4.8
on quantitative sampling of gaseous compounds into liquids and subsequent analysis in the liquid phase, the establish-ment of constant and precise liquid flows for all solutions is critical. The AiRRmonia applies syringe pumps for this purpose; their performance was verified by equipping the in-strument with a liquid flow meter (Liquiflow L1, Bronkhorst NL) and continuously monitoring the total liquid flow.
The response time of the analyzer is of the order of 10– 15 min and depends on the liquid flow rate, and thus on syringe pump speed. Detection limit and accuracy of the AiRRmonia have previously been determined as 0.1µg/m3 and 3%, respectively (Erismann et al., 2001). For an es-timate representative of the measurement period presented here, we used the 2σ (twice the observed standard devia-tion) from conductivity measurements in the field without air flow in sampling block as an estimate for the detection limit and twice the observed standard deviation from cali-brations in the field as an estimate for the accuracy. The resulting values were 0.08µg/m3 or 120 pptv for detection limit and 10% accuracy at NH3mixing ratios of 5 ppbv, c.f.
2.2.2 GRAEGOR
The recently developed GRadient of AErosol and Gases Online Registrator (GRAEGOR) measures mixing ratios of water-soluble gases, such as NH3, HNO2, HNO3, HCl,
SO2 and their related aerosol compounds NH+4, NO−3,
Cl−, SO24− (Thomas et al., 2009). The instrument con-sists of two sampling units, an analytical part, and a vac-uum pump (Becker VT 4.16). The sampled air is drawn through two PFA (perflouroalkoxy) Teflon tubing connec-tions (di=0.8 cm, l=30 cm, Table 2) to two sampling units that
can be placed at two different heights to measure gradients. Water-soluble gases and aerosol species are collected simul-taneously by two horizontally aligned rotating wet-annular denuders (WAD or WRD) and two Steam-Jet Aerosol Col-lectors (SJAC), respectively (Slanina et al., 2001; Trebs et al., 2004). A critical orifice provides controlled sample air-flows of approx. 16.7 l min−1 (293.15 K and 1013.25 hPa) through each of the WRD/SJAC sampling lines. The airflow was regularly checked with a Gilibrator Air Flow Calibra-tion System. To minimize wall losses of sticky gases such as HNO3(Neuman et al., 1999), no preimpactor or cyclone was
connected in front of the inlet. In contrast to previous stud-ies that have employed similar instrumentation (e.g., Trebs et al., 2004), one major improvement of the GRAEGOR is the application of syringe pumps for the precise transport of liquids which is crucial for accurate analyses (cf. section above). The sample flow through the system is constant at 0.333 ml min−1 and is controlled with a Bronkhorst liquid
flow meter. The sample solutions are analyzed on-line using ion chromatography (IC) for anions (results are not included in this study). Ammonium (NH+4) is analyzed using the same method as applied in the AiRRmonia (ammonium flow in-jection analysis, AMFIA). However, the AMFIA detector in GRAEGOR only has a NH3transfer efficiency of 30%
(Slan-ina et al., 2001). The detector was calibrated in the same way as that of the AiRRmonia using standard solutions of NH+4. The accuracy is 12% as determined by Gaussian error propa-gation, including uncertainties of the sampled air volume, the liquid flow and conductivity detection. The detection limit for NH3was estimated from field blanks (2σ-definition) to
94 pptv (Table 1). The air samples that the GRAEGOR an-alyzes represent an average of the second half of each hour. This is the fastest sampling time achievable when GRAE-GOR is operated as gradient monitor since two gas samples and two aerosol samples need to be analyzed subsequently and each analytical cycle takes 15 min. The response time of GRAEGOR, i.e. the time it takes for the signal to drop to 1/e of the starting value (ambient NH3mixing ratio) after
switching off the air pump, was shown to be 58±2 min (cf.
Thomas et al., 2009). For gradient measurements, the lower measurement height was 0.37 m and the upper measurement height was 1.23 m. In this paper we only present data from the upper level measurements. The GRAEGOR was
oper-ated by personnel from Max Planck Institute for Chemistry (MPIC) in Mainz, Germany.
2.2.3 PTR-MS
Proton Transfer Reaction Mass Spectrometry (PTR-MS) is a state-of-the-art chemical ionization mass spectrometry (CIMS) technique for highly sensitive on-line measurements of volatile organic compounds (VOC) as described in Hansel et al. (1995) and Lindinger et al. (1998). A new technique for fast measurements of gas phase NH3 using the
PTR-MS instrument has recently been presented by Norman et al. (2007). Oxygen (O2) is used as a source gas to produce
O+2 as chemical ionization (CI) reagent instead of H3O+.
The O+2 ions react with the NH3molecules via the electron
transfer reaction O+2+NH3→NH+3+O2which occurs at
col-lision rate. Primary (O+2) and product ions (NH+3) are sepa-rated by a quadrupole mass spectrometer and detected using an electron multiplier SEM pulse counting system. The cor-rect terminology of the instrument would be ETR-MS (Elec-tron Transfer Reaction Mass Spectrometer), since it uses electron transfer instead of proton transfer as in the conven-tional PTR-MS. However the instrument itself is not changed and we will through the paper use the well-established termi-nology PTR-MS when referring to the instrument. A detailed description of the instrument settings, sensitivity and selec-tivity can be found in Norman et al. (2007). During labo-ratory tests the detection limit (2σ) was found to be 90 pptv for a 1 s signal integration time at dry conditions, increasing to 270 pptv for humid conditions (Table 1). The instrumen-tal time response, defined by 1/e2 decay in the calibration signal was around 30 s. The instrument used for these mea-surements was a conventional PTR-MS instrument built at the University of Innsbruck. The PTR-MS inlet consisted of a 17 m long di=0.95 cm PFA tubing with a flow of 15 SLPM
(Table 2). The inlet was not heated, but covered with alu-minum foil to minimize effects from direct solar radiation on the tube. The inlet was mounted 1.25 m above the grass field on a tripod in close vicinity to the other two instruments on the intensively managed plot. The sample inlet to the PTR-MS drift tube consisted of a 15 cm silica coated stainless steel tube (Sulfinert®, Restek Corp., Bellefonte, PA, USA) which was pressure and temperature controlled. The passi-vated stainless steel tube sampled air from the centre of the main inlet tubing. The air flow into the PTR-MS instrument was∼30 sccm. The sampling time for the PTR-MS
instru-ment used in this study varied between 0.5 s to 30 s, but we only present 1 min averages (Table 1).
0 10 20 30 40 T e m p e ra tu re (C ) 0 25 50 75 100 R e la ti v e h u m id ity (% ) Temperature Relative humidity 0 10 20 30 40 26-jul 12:00 27-jul 00:00 27-jul 12:00 28-jul 00:00 28-jul 12:00 29-jul 00:00 29-jul 12:00 30-jul 00:00 30-jul 12:00 31-jul 00:00 31-jul 12:00 R ai n ( m m /h ) 0 2 4 6 8 W in d sp eed ( m /s) Rain Wind speed
Fig. 1.Observed meteorological parameters for the 5-day intercom-parison period.
in a temperature controlled oven at 30◦C and was continu-ously flushed with NH3free air. NH3free air was generated
using a platinum and palladium (Pt/Pd) catalyst operated at 350◦C (Parker-Balston, Haverhill, MA, USA). NH3free air
was also generated using oxalic acid coated filters. Using one or two stage dilution with NH3 free air from the Pt/Pd
catalyst and/or the oxalic acid NH3scrubber, the instrument
was calibrated in the field for mixing ratios between 8 and 150 ppbv. Details about the calibration system can be found in Norman et al. (2007). The PTR-MS was operated by per-sonnel from the Institute for Ion and Applied Physics at the University of Innsbruck, Austria.
3 Results
3.1 Time series analysis
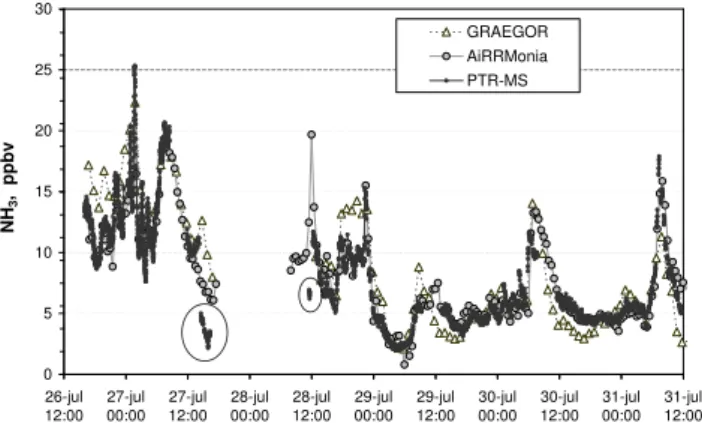
The field site was equipped with a meteorological station providing half-hour averages of air temperature, relative hu-midity, precipitation, wind speed and wind direction. The meteorological conditions during the measurement period are presented in Fig. 1. The period was dominated by rel-atively high daytime temperatures between 20◦ and 30◦C. There was a heavy thunderstorm on the 27th July with almost 40 mm/h rain and heavy winds and a sharp drop in temper-ature. A longer rain period occurred in the morning of the 29th with mostly light rain. The relative humidity was close to 100% during nighttime and mostly dropped to below 50% during daytime. Figure 2 shows the time-series of measured NH3mixing ratios during the intercomparison period for all
three instruments. The thunderstorm in the evening of 27th July caused a power failure and the measurements started again in the morning of 28th July. The time series analysis shows an overall good agreement between the three different instruments. The time course of NH3shows large variations,
with mixing ratios around 10–15 ppbv on 26th July and in the morning of 27th July. NH3levels dropped in the
morn-ing of 27th July and continued fallmorn-ing until the power
fail-0 5 10 15 20 25 30 26-jul 12:00 27-jul 00:00 27-jul 12:00 28-jul 00:00 28-jul 12:00 29-jul 00:00 29-jul 12:00 30-jul 00:00 30-jul 12:00 31-jul 00:00 31-jul 12:00 N H3 , p p b v GRAEGOR AiRRMonia PTR-MS
Fig. 2. NH3mixing ratios measured 1.25 m above the intensively managed grass field. The data are presented in 1 min, 30 min and 1 h sampling time for the PTR-MS, AiRRmonia and GRAEGOR, respectively. PTR-MS data within the circles are discussed sepa-rately.
ure in the evening. The mixing ratios were lower following the heavy thunderstorm rainfall. The PTR-MS data showed a sudden drop in mixing ratio during the rainfall as well as dur-ing the start up in the morndur-ing after (data within the circles in Fig. 2). As discussed later in the paper, this drop was most likely caused by water condensation in the main inlet line. On 28th July highly variable mixing ratios were observed with a sharp drop in the late evening before the onset of rain-fall. The period from 29th to 31st July was characterized by a sharp NH3 peak every morning around 09:00 a.m.
Simi-lar increases during morning hours have been observed over grassland sites elsewhere, e.g., by Trebs et al. (2005). The mixing ratio typically decreased throughout the afternoon.
The different sampling times of the three instruments re-sult in slightly different features of the temporal NH3
struc-ture. The 1-min PTR-MS data indicate fast NH3variations
on 26th July and early morning of 27th July. A detailed ver-sion of the NH3levels observed by the PTR-MS and the
AiR-Rmonia instruments during this period is shown in Fig. 3. While both instruments found a very similar mixing ratio pattern at half-hour sampling time, the PTR-MS was able to capture additional changes of NH3 occurring at the time
scale of minutes. These fast variations may be caused by small scale changes in the advection of air masses close to the ground, as supported by the concurrent variation of the wind speed.
0 5 10 15 20 25 30
26.Jul 18:00 26.Jul 21:00 27.Jul 00:00 27.Jul 03:00 27.Jul 06:00
NH
3
,
pp
bv
0.0 0.5 1.0 1.5 2.0 2.5 3.0
ms
-1
AiRRmonia PTR-MS wind speed
Fig. 3.The AiRRmonia and the PTR-MS data for a 12 h period on the 26th and 27th July when fast NH3variations were observed.
and the AiRRmonia levels in the afternoon of 26th July and in the afternoon of 28th July following rain events with as-sociated high relative humidities (Fig. 1), but they were 20– 40% lower in the early mornings of 29th and 30th July as well as during midday on 29th, 30th and 31st July.
3.2 Regression analyses
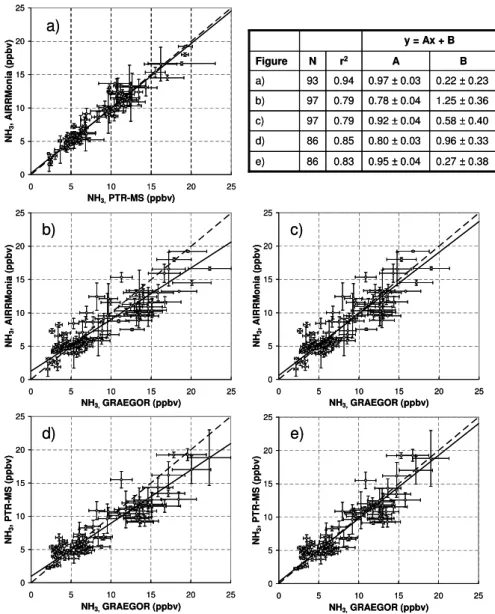
Hourly averaged values were calculated from the data pre-sented in Fig. 2 (the PTR-MS data in the circles excluded). Bivariate regression analyses of the calculated hourly aver-ages are presented in Fig. 4. As for the time series analy-sis an overall good agreement was found between all three instruments. The correlation between the PTR-MS and the AiRRmonia (Fig. 4a) was found to be excellent (r2=0.94). The AiRRmonia shows marginally lower mixing ratios than the PTR-MS, reflected in a slope of 0.97. A brief laboratory intercomparison between the AiRRmonia analyzer and the PTR-MS instrument presented in Norman et al. (2007) also showed an r2>0.95 and difference of mixing ratios <5%. The regression also shows that the AiRRmonia and the PTR-MS depict a linear correlation throughout the whole mea-sured mixing ratio range with an offset of less than 0.25 ppbv. The comparison between the GRAEGOR and the AiR-Rmonia (Fig. 4b) shows the poorest correlation with an
r2=0.79. The GRAEGOR showed on average higher mixing ratios than the AiRRmonia at mixing ratios above 10 ppbv but also slightly lower at mixing ratios below 5 ppbv. This resulted in a slope of 0.78 and an offset of 1.25 ppbv.
The comparison between the GRAEGOR and the PTR-MS (Fig. 4d) resulted in a correlation coefficientr2=0.85. As for the comparison with the AiRRmonia, the GRAEGOR showed higher mixing ratios above 10 ppbv and slightly lower mixing ratios below 5 ppbv. This resulted in a slope of 0.80 and an offset of 0.96 ppbv.
The GRAEGOR data shown in Fig. 4b and d were derived using a calibration made on the 26th of July before the power failure when (liquid) temperatures were>30◦C. In contrast,
Fig. 4c and e show regressions of the GRAEGOR data with AiRRmonia and PTR-MS, respectively using a calibration made on 1st of August (at the end of the intercomparison period) when (liquid) temperatures were <28◦C. Whiler2
does not change much using the latter calibration made at lower temperatures, the other regression parameters improve substantially (slopes of 0.92 and 0.95 and offsets of 0.58 and 0.27 ppbv, respectively).
4 Discussion
The difficulty of measuring atmospheric NH3 is
demon-strated in the wide variety of results from NH3
intercompar-ison exercises found in literature.
The study by Wiebe et al. (1990) showed that the measure-ments including filter packs and annular denuders agreed to within±30% for NH3levels higher than 1.5 ppbv, but with
a relatively coarse sampling time (minimum 4 h). The five different NH3measurement techniques tested by Williams et
al. (1992) all agreed within a factor of two for NH3 levels
above 0.5 ppbv. The photofragment instrument (PF/LIF) and the citric acid coated denuders (CAD/IC) however agreed within 15% for all measured ambient mixing ratios (0.2– 5 ppbv) for a sampling time of 2–8 h.
The detailed study by Mennen et al. (1996) showed that the wet-annular rotating denuder (WRD) met all the require-ments for air quality monitoring on one hour sampling. The study also showed that both the DOAS and the NOxconverter
instruments showed correlations ofr2>0.9 with the WRD, but were found not to be accurate enough for low concen-trations. The photoacoustic monitor was rejected because it could not be operated without frequent attention and the ther-modenuders were rejected due to their low sampling time.
The field intercomparison by Milford et al. (2000) showed that the AMANDA and the DS-FIA had an overall difference of 35% for 30 min sampling times, but also with a substantial scatter of the data. The intercomparison reported by Fehsen-feld et al. (2002) showed that the CIMS and the MoOx
con-verter method correlated with the citric acid denuder with an
r2>0.91 for sampling times of at least 2 h. However, the av-eraged concentration ratio for the CIMS and the MoOx
con-verter difference method compared to the denuder was 0.8 and 1.75, respectively.
The two different CIMS instruments, tested in the field by Nowak et al. (2006) with ambient levels ranging 0.4 to 13 ppbv showed a difference of 17% and anr2=0.71 for a sampling time of one minute. Ther2would be higher if av-erages over longer periods were calculated.
0.22 ± 0.23 0.97 ± 0.03
0.94 93 a)
0.27 ± 0.38 0.95 ± 0.04
0.83 86 e)
0.58 ± 0.40 0.92 ± 0.04
0.79 97 c) d) b) Figure
y = Ax + B
0.96 ± 0.33 1.25 ± 0.36
B
0.80 ± 0.03 0.85
86
0.78 ± 0.04 0.79
97
A r2
N
0.22 ± 0.23 0.97 ± 0.03
0.94 93 a)
0.27 ± 0.38 0.95 ± 0.04
0.83 86 e)
0.58 ± 0.40 0.92 ± 0.04
0.79 97 c) d) b) Figure
y = Ax + B
0.96 ± 0.33 1.25 ± 0.36
B
0.80 ± 0.03 0.85
86
0.78 ± 0.04 0.79 97 A r2 N 0 5 10 15 20 25
0 5 10 15 20 25
NH3, GRAEGOR (ppbv)
N H3 , A IR R M o n ia ( p p b v ) 0 5 10 15 20 25
0 5 10 15 20 25
NH3, PTR-MS (ppbv)
N H3 , A IR R M o n ia ( p p b v ) 0 5 10 15 20 25
0 5 10 15 20 25
NH3, GRAEGOR (ppbv)
N H3 , A IR R M o n ia ( p p b v ) a) b) c) d) e) 0 5 10 15 20 25
0 5 10 15 20 25
NH3, GRAEGOR (ppbv)
N H3 , P T R -M S ( p p b v ) 0 5 10 15 20 25
0 5 10 15 20 25
NH3, GRAEGOR (ppbv)
N H3 , P T R -M S ( p p b v ) 0 5 10 15 20 25
0 5 10 15 20 25
NH3, GRAEGOR (ppbv)
N H3 , A IR R M o n ia ( p p b v ) 0 5 10 15 20 25
0 5 10 15 20 25
NH3, PTR-MS (ppbv)
N H3 , A IR R M o n ia ( p p b v ) 0 5 10 15 20 25
0 5 10 15 20 25
NH3, GRAEGOR (ppbv)
N H3 , A IR R M o n ia ( p p b v ) a) b) c) d) e) 0 5 10 15 20 25
0 5 10 15 20 25
NH3, GRAEGOR (ppbv)
N H3 , P T R -M S ( p p b v ) 0 5 10 15 20 25
0 5 10 15 20 25
NH3, GRAEGOR (ppbv)
N H3 , P T R -M S ( p p b v )
Fig. 4.Bivariate regression plots of hourly averaged data from all three instruments. Data in(a),(c)and(e)represent hourly averaged data from Fig. 2. (c) and (e) are the same as(b)and(d)respectively, but with a different calibration for the GRAEGOR (see text). The error bars represent the observed variability (±σ, standard deviation) within the respective hour (the GRAEGOR only produces one value every hour and in this case error bars present the instrument accuracy of±12%). The dashed line gives the 1:1 relationship and the solid line gives the result of a reduced major axis regression. N is the number of data points.
TDLAS was also found to have shortest time response during spiking tests.
The intercomparison of a QCLAS, a TDLAS and an AMANDA system by Whitehead et al. (2008) found corre-lations (r2) to be good, ranging between 0.74 and 0.98 for concentration measurements during and after slurry applica-tion, with better correlations during the high concentration period. Despite the high correlations, the averaged concen-tration ratio between individual systems varied significantly (between 0.44 and 1.3).
The three instruments tested in this study showed a good correlation with r2>0.79 for 1 h averaged values. Uncor-rected mixing ratios levels agreed to within 22% with offsets
ranging from 0.22 to 1.25 ppbv. The PTR-MS and the AiR-Rmonia agreed to 3% with anr2=0.94. The results in this study are well in line with the intercomparison studies men-tioned above and the agreement between these very different measurement concepts is encouraging.
4.1 Calibration procedures and temperature influence
The PTR-MS method is not reported to be temperature de-pendent (Norman et al., 2007). Furthermore, the instru-ment was placed inside a temperature-controlled trailer. The GRAEGOR and the AiRRmonia instruments were placed outside and were therefore exposed to temperature fluctua-tions at the field site. The AiRRmonia and the GRAEGOR use identical analytical procedures (AMFIA, see above) and were calibrated with liquid standards, while the PTR-MS was calibrated with a gaseous standard. Any dependence of the scrubbing- or collection efficiency on the mixing ratios for the GRAEGOR and the AiRRmonia could therefore lead to differences over the observed mixing ratio range. The PTR-MS has a linear response to the gaseous NH3standard
(Nor-man et al., 2007). In contrast, the conductivity measurements in the AiRRmonia and the GRAEGOR feature a quadratic response to the introduced liquid standards. Moreover, the transfer of NH3 through the semi-permeable PTFE
mem-brane in the detector block and the conductivity response are a function of temperature (Decuq et al., 2008), which is cor-rected for using an empirically derived relationship (see e.g., Trebs et al., 2004).
In case of the GRAEGOR, substantial differences between calibrations made at different temperatures were observed (as mentioned above). While the AiRRmonia detector was cali-brated in the early morning when temperatures were around 15–20◦C (Fig. 1) the first GRAEGOR calibration was per-formed on 26th of July when (liquid) temperatures>30◦C were measured. The calibration on 1st of August (at the end of the intercomparison period) was made at (liquid) temper-atures<28◦C (cf. Fig. 4b and d) and results in NH3values
that were on average about 15-20% lower than the mixing ra-tios based on the calibration on the 26th of July. Hence, the slope and offset of the regression between GRAEGOR and the other instruments improves using the calibration from 1st of August as observed in Fig. 4c and e (cf. Sect. 3.2). The following GRAEGOR calibrations at the field site with liq-uid temperatures around 25◦C agreed within 5% with that on the 1st of August, suggesting that it is critical to perform cal-ibrations at temperatures higher than 30◦C. It is important to note, that the lower NH3 transfer efficiency of the AMFIA
in GRAEGOR (30% compared to 90% of the AiRRmonia) would generally promote the temperature effects. Decuq et al. (2008) propose that the empirically derived relationship for the AMFIA detector does not give accurate results (par-ticularly for high temperatures) and a more suitable correc-tion for temperature effects may be required.
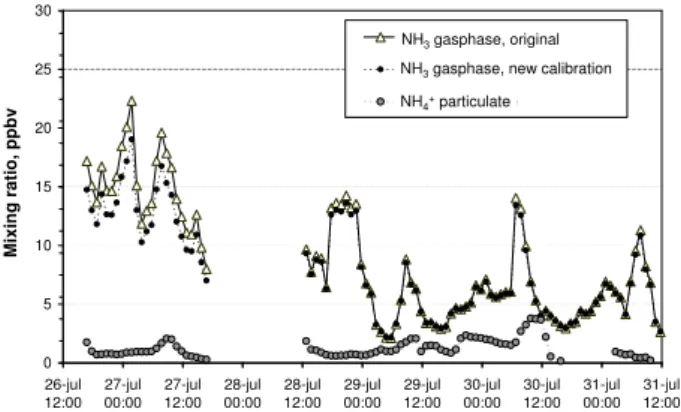
Figure 5 shows a combined graph of the time series for both calibrations of the GRAEGOR data. The difference be-tween the two calibrations was larger before the power fail-ure on the 27th of July. The power failfail-ure caused a loss of the AMFIA deionized water background conductivity signal, which mainly serves to monitor the water quality and is used in the calculation of the NH3mixing ratio. The calibration
0 5 10 15 20 25 30
26-jul 12:00
27-jul 00:00
27-jul 12:00
28-jul 00:00
28-jul 12:00
29-jul 00:00
29-jul 12:00
30-jul 00:00
30-jul 12:00
31-jul 00:00
31-jul 12:00
M
ix
in
g
r
a
ti
o
,
p
p
b
v
NH3 gasphase original
NH3 gasphase new calibration
NH4+ Particulate NH3gasphase, original
NH3gasphase, new calibration
NH4+particulate
Fig. 5.Gas phase NH3mixing ratios and particulate NH+4 mixing ratios measured 1.25 m above the grass field from the GRAEGOR instrument. The NH3data is presented for two different calibrations of the GRAEGOR (see text).
made on 1st of August includes this signal loss (i.e., the AM-FIA signal is derived only from the sample conductivity). Thus the data before the power failure, which still contained the background conductivity, are probably overcorrected us-ing the calibration from the 1st of August.
4.2 Particle interference
One major complication for NH3 sampling described e.g.,
by Parrish and Fehsenfeld (2000) is the simultaneous pres-ence of NHx in the gaseous, particulate and liquid phases.
For accurate sampling of gaseous NH3 the particulate and
gas phase should be separated before sampling in order to avoid positive artifacts by sampling of particles. The GRAE-GOR separates the gas phase from the particulate phase and its measured NH3mixing ratios are therefore not expected to
be affected by particles. The AiRRmonia samples through a gas-permeable membrane with particle interference below 3% (Otjes and Erisman, 1999). The PTR-MS has no sepa-ration of gas and particulate phase in front of the inlet and it has not yet been tested for any particle interference. Thus, it is not known what happens to particulate NH+4 in the low pressure system of the instrument. However, large inlet cross sectional area in combination with high flow rates largely re-duces the interference of larger particles. The aerosol NH+4 measured with the GRAEGOR during the intercomparison period ranged from 0.3 to 3.8 ppbv (Fig. 5), which was be-tween 5 and 70% of the NH3 mixing ratio. We expect that
particle interferences only had a minor contribution to the ob-served NH3differences. Potentially this might have been the
case when GRAEGOR measured lower NH3 mixing ratios
than the AiRRmonia and the PTR-MS during midday on the 29th, 30th of July when aerosol NH+4 was on average 50% of the measured NH3mixing ratio. During these periods the
sharp drop of relative humidity potentially promoted evapo-ration of NH3from aerosol and ground surfaces, a dynamic
4.3 Inlets and humidity dependence
Several studies have reported difficulties measuring NH3due
to its interaction with the surface material of the inlets (e.g., Whitehead et al., 2008; Yokelson et al., 2003; Parrish and Fehsenfeld, 2000). Teflon (PFA and PFTE) and Polyethylene (PE) have been found to be well suited materials (Yokelson et al., 2003; Shah et al., 2006; Whitehead et al., 2008), but it is still recommended to choose the inlet length as short as possible to avoid losses (Fehsenfeld et al., 2002). The instru-ments in this study used a wide variety of inlet lengths and flow regimes as presented in Table 2. The PTR-MS used a 17 m long PFA with di=0.95 cm, the inlet of the GRAEGOR
consisted of 30 cm long PFA tubing with di=0.8 cm and the
AiRRmonia inlet was made of PE and had a length of only 5 cm and di=0.17 cm.
We observed losses in the PTR-MS inlet during and di-rectly after the thunderstorm on the 27th July. During the rainfall the inlet tubing was cooled by water on the outside of the inlet apparently causing condensation in the inlet and uptake of NH3 on the tubing walls. This was clearly seen
in the data with a sudden drop of more than 50% of the mix-ing ratios in comparison to the other instruments (data shown within the circles in Fig. 2). No loss of NH3in the PTR-MS
inlet compared to the other instruments was observed dur-ing the other periods without rainfall although the relative humidity was close to 100% during several nights. The AiR-Rmonia has similar if not less potential than GRAEGOR for adsorption of NH3 on inlet walls. Most likely,
adsorption-desorption in the AiRRmonia and the PTR-MS were not im-portant, since largest differences occurred between GRAE-GOR and PTR-MS/AiRRmonia. These results suggest that no losses of NH3on the PFA tubing surface to the PTR-MS
instrument were observed when compared to the AiRRmo-nia and the GRAEGOR inlet as long as the tubing was not cooled causing condensation. An optimal design of an inlet might therefore be thermal insulation and if possible heat-ing to a few degrees above the ambient temperature, keepheat-ing in mind that large temperature differences between outside and the inlet air cause aerosol ammonium nitrate to evapo-rate forming artifact NH3.
The PTR-MS has a background signal that is observed to increase from 70 to 400 pptv with increasing humidity asso-ciated with also an increase in detection limit (cf. Table 1; Norman et al., 2007). A correction for the observed absolute humidity was therefore applied to the data. The departures from the 1:1 ratio observed in Fig. 4 for any of the correla-tions were not found to be correlated to the prevailing humid-ity.
5 Summary and conclusions
This paper compares measurements of atmospheric NH3by
three different instruments performed at the Oensingen
in-tensively managed grassland site during 5 days in July and August 2006 within the framework of NitroEurope.
During the intercomparison period ambient temperatures were relatively high (18–32◦C) and relative humidities ranged from 30 to 100%.
The instruments included in the experiment were the AiR-Rmonia, the GRAEGOR, and a modified PTR-MS instru-ment. The GRAEGOR collects air samples using wet-annular denuders combined with steam-jet aerosol collec-tors, analysis is performed on-line using ammonium flow injection. The AiRRmonia analyzer samples air through a gas-permeable membrane and analysis is performed in the same way as with the GRAEGOR. The modified PTR-MS approach is based on chemical ionization mass spectrometry using O+2 primary reagent ions.
All three instruments measured simultaneously at the site for a period of 5 days. During the intercomparison period the gas phase NH3mixing ratios varied between 2 and 25 ppbv.
Correlation analyses between the instruments for 1-h aver-ages showed correlation coefficientsr2>0.79 with the high-est grade of correlation between the AiRRmonia and the PTR-MS (r2=0.94). According to the regression analysis the GRAEGOR measured on average about 20% higher mix-ing ratios than both the AiRRmonia and the PTR-MS instru-ments. One potential cause for this deviation was unusually high temperatures during the period the GRAEGOR was cal-ibrated in the 5-day intercomparison phase. An analysis of all calibrations performed during the multi-week deployment of the GRAEGOR revealed that this particular calibration stood out with a significantly different sensitivity curve, whereas the all other calibration agreed within 5%. Using these other GRAEGOR calibrations for data analysis, the average dif-ference decreased to <7% and the offset was <0.6 ppbv. If obvious condensation events in the PTR-MS sampling line were excluded, AiRRmonia and PTR-MS measurements agreed to within 3% with an offset<0.25 ppbv.
During conditions favoring condensation in inlet lines, the PTR-MS measured significantly less NH3than the wet
chem-ical systems, which had much shorter inlets. This underlines the importance of a careful inlet design and needs to be con-sidered for any instrument measuring NH3directly in the gas
phase.
The three instruments included in this study have differ-ent fields of application. The AiRRmonia is developed for time-extended NH3monitoring in the field without intensive
maintenance in contrast to both the GRAEGOR and the PTR-MS. The GRAEGOR instrument allows to selectively and simultaneously measure several gas and particulate compo-nents and to sample simultaneously at two different levels for aerodynamic gradient studies. The PTR-MS measures NH3at a sampling time of seconds, although the effective
is therefore suitable for process based studies or for mea-surements on moving platforms where fast changes of mix-ing ratios occur, provided that inlet lines cause no significant damping of rapidly changing mixing ratio signals.
The results from these measurements are well in line with previously reported intercomparisons proving that these three instruments are suitable for atmospheric NH3
measure-ments under the tested conditions.
Acknowledgements. The EU project NitroEurope (Contract
017841) is funded under the EC 6th Framework Programme for Research and Technological Development. MN was funded by FORMAS, The Swedish Research Council for Environment, Agricultural Sciences and Spatial Planning under project number: 21.4/2003-1410. The authors gratefully acknowledge financial sup-port by the Max Planck Society. Agroscope ART thanks C. H¨uglin of EMPA Materials Science and Technology, Switzerland, for providing the AiRRmonia instrument.
Edited by: J. Rinne
References
Ammann, C., Flechard, C., Fuhrer, J., and Neftel, A.: Greenhouse gas budget of intensively and extensively managed grassland, in: Land Use Systems in Grassland Dominated Regions, edited by: L¨uscher, A., Jeangros, B., Kessler, W., et al., Grassland Science in Europe, vdf Hochschulverlag, Z¨urich, Switzerland, 9, 130– 132, 2004.
Ammann, C., Flechard, C. R., Leifeld, J., Neftel, A., and Fuhrer, J.: The carbon budget of newly established temperate grassland depends on management intensity, Agr. Ecosyst. Environ., 121, 5–20, 2007.
Asman, W. A. H., Sutton, M. A., and Schjorring, J. K.: Ammo-nia: emission, atmospheric transport and deposition, New Phy-tol., 139, 27–48, 1998.
Bouwman, A. F., Lee, D. S., Asman, W. A. H., Dentener, F. J., Van der Hoek, K. W., and Olivier J. G. J.: A global high resolution emission inventory for ammonia, Global Biogeochem. Cy., 11, 561–587, 1997.
Charlson, R. J., and Rodhe, H.: Factors controlling the acidity of natural rainwater, Nature, 295, 683–685, 1982.
Dasgupta, P. K.: Automated measurements of atmospheric trace gases: Diffusion based collection and analysis, in: Measure-ments Challenges in Atmospheric Analysis, edited by: Newman, L., Adv. Chem. Ser., 232, 41–90, 1993.
Dentener, F. J. and Crutzen P. J.: A three-dimensional model of the global ammonia cycle, J. Atmos. Chem., 19, 331–369, 1994. Decuq, C., Loubet, B., Personne, E., Ferrara, R., Masson, S., Flura,
D., and G´enermont, S.: Effect of temperature on ammonia mea-surements by semi-permeable membrane coupled with conduc-tivity, NitroEurope-IP Open Science Conference, Ghent, Bel-gium, 20–21 February 2008, p. 43, 2008.
Erisman, J. W., Otjes, R., Hensen, A., Jongejan, P., van den Bulk, P., Khlystov, A., M¨ols, H., and Slanina, S.: Instrument development and application in studies and monitoring of ambient ammonia, Atmos. Environ., 35, 1913–1922, 2001.
Fangmeier, A. F., Hadwiger-Fangmeier, A., Van der Eerden, L., and Jager, H. J.: Effects of atmospheric ammonia on vegetation: A review, Environ. Pollut., 86, 43–82, 1994.
Fehsenfeld, F. C., Huey, L. G., Leibrock, E., Dissly, R., Williams, E., Ryerson, T. B., Norton, R., Sueper, D. T., and Hartsell, B.: Results from an informal intercomparison of ammonia measurement techniques, J. Geophys. Res., 107(D24), 4812, doi:10.1029/2001JD001327, 2002.
Ferm, M.: Method for determination of atmospheric ammonia, At-mos. Environ., 13, 1385–1393, 1979.
Flechard, C. R., Neftel, A., Jocher, M., Ammann, C., and Fuhrer, J.: Bi-directional soil/atmosphere N2O exchange over two mown grassland systems with contrasting management practices, Global Change Biol., 11, 2114–2127, 2005.
Gall, R., Perner, D., and Ladstatter-Weissenmayer, A.: Simultane-ous determination of NH3, SO2, NO and NO2 by direct UV-absorption in ambient air, Fresen, J. Anal. Chem., 340, 646–649, 1991.
Gang, L.: Catalytic oxidation of ammonia to nitrogen, Ph.D the-sis, Technische Universiteit Eindhoven, ISBN: 90-386-2653-3, NUGI 813, 2002.
Genfa, Z., Dasgupta, P. K., and Dong, S.: Measurements of atmo-spheric ammonia, Environ. Sci. Technol., 23, 1467–1474, 1989. Genfa, Z., Slanina, F., Boring, S. C. B., Jongejan, P. A. C., and
Dasgupta, P. K.: Continuous wet denuder measurements of at-mospheric nitric and nitrous acids during the 1999 Atlanta Su-persite, Atmos. Environ., 37, 1351–1364, 2003.
Hansel, A., Jordan, A., Holzinger, R., Prazeller, P., Vogel, W., and Lindinger, W.: Proton transfer reaction mass spectrometry: On-line trace gas analysis at the ppb level, Int. J. Mass Spectrom., 149–150, 609–619, 1995.
J¨aggi, M., Ammann, C., Neftel A., and Fuhrer, J.: Environmental control of profiles of ozone concentration in a grassland canopy, Atmos. Environ., 40, 5496–5507, 2006.
Lindinger, W., Hansel, A., and Jordan, A.: Proton-transfer reaction mass spectrometry (PTR–MS): on-line monitoring of volatile or-ganic compounds at pptv levels, Chem. Soc. Rev., 27, 347–375, 1998.
Mennen, M. G., van Elzakker, B. G., van Putten, E. M., Uiterwijk, J. W., Regts, T. A., van Hellenmond, J., Wyer, G. P., Otjes, R. P., Verhage, A. J. L., Wouters, L. W., Heffels, C. J. G, R¨omer, F. G., van den Beld, L., and Tetteroo, J. E. H.: Evaluation of automatic ammonia monitors for application in an air quality monitoring network, Atmos. Environ., 30, 3239–3256, 1996.
Milford, C., Sutton, M. A., Allen, A. G., Karlsson, A., Davison, B. M., James J. D., Rosman, K., Harrison, R. M., and Snape, J. N.: Marine and land-based influence on atmospheric ammonia and ammonium over Tenerife, Tellus Ser. B, 52, 273–289, 2000. Mozurkewich, M.: The Dissociation-Constant of
Ammonium-Nitrate and Its Dependence on Temperature, Relative-Humidity and Particle-Size, Atmos. Environ. A-Gen., 27, 261–270, 1993. Neftel, A., Flechard, C., Ammann, C., Conen, F., Emmenegger,
L., and Zeyer, K.: Experimental assessment of N2O background fluxes in grassland systems, Tellus, 59B, 470–482, 2007. Neuman, J. A., Huey, L. G., Ryerson, T. B., and Fahey, D. W.:
Study of Inlet Materials for Sampling Atmospheric Nitric Acid, Environ. Sci. Technol., 33, 1133–1136, 1999.
Int. J. Mass Spectrom., 265, 382–387, 2007.
Nowak, J. B., Huey, L. G., Russell, A. G., Tian, D., Neuman, J. A., Orsini, D., Sjostedt, S. J., Sullivan, A. P., Tanner, D. J., Weber, R. J., Nenes, A., Edgerton, E., and Fehsenfeld, F. C.: Analysis of urban gas phase ammonia measurements from the 2002 Atlanta Aerosol Nucleation and Real-Time Characteriza-tion Experiment (ANARChE), J. Geophys. Res., 111, D17308, doi:10.1029/2006JD007113, 2006.
Nowak, J. B., Neuman, J. A., Kozai, K., Huey, L. G., Tanner, D. J, Holloway, J. S., Ryerson, T. B., Frost, G. J., McKeen, S. A., and Fehsenfeld, F. C.: A chemical ionization mass spectrometry technique for airborne measurements of ammonia, J. Geophys. Res., 112, D10S02, doi:10.1029/2006JD007589, 2007. Otjes, R. P. and Erisman, J. W.: Haalbaarheidstudie
miniaturiser-ing ammoniak analyser (Feasibility study on the diminution of ammonia analyser), Report ECN-CX-99-015, ECN, Petten, The Netherlands (in Dutch), 1999.
Parrish, D. D. and Fehsenfeld, F. C.: Methods for gas-phase mea-surements of ozone, ozone precursors and aerosol precursors, At-mos. Environ., 34, 1921–1957, 2000.
Pushkarsky, M. B., Webber, M. E., Baghdassarian, O., Narasimhan, L. R., and Patel, C. K. N.: Laserbased photoacoustic ammonia sensor for industrial applications. Appl. Phys. B-lasers special issue: Trends in Laser Sources, Spectroscopic Techniques and Their Applications to Trace Gas Detection, 75, 391–396, 2002. Shah, S. B., Grabow, G. L., and Westerman, P. W.: Ammonia
ab-sorpition of five types of flexible tubing materials, Appl. Eng. Agric., 22(6), 919–923, 2006.
Slanina, J., ten Brink, H. M., Otjes, R. P., Even, A., Jongejan, P., Khlystov, A., Waijers-Ijpelaan, A., and Hu, M.: The continuous analysis of nitrate and ammonium in aerosols by the steam jet aerosol collector (SJAC): extension and validation of the method-ology, Atmos. Environ., 35, 2319–2330, 2001.
Sutton, M. A., Tang, Y. S., Miners, B., and Fowler, D.: A New Diffusion Denuder System for Long-Term, Regional Monitoring of Atmospheric Ammonia and Ammonium, Water Air Soil Poll.: Focus 1: 145–156, 2001.
Thomas, R. M., Trebs, I., Otjes, R., Jongejan, P. A. C., ten Brink, H., Philips G., Kortner, M., Meixner, F. X., and Ne-mitz, E.: An automated analyzer to measure surface-atmosphere exchange fluxes of water soluble inorganic aerosol compounds and reactive gases, Environ. Sci. Technol., 43(5), 1412–1418, doi:10.1021/es8019403, 2009.
Trebs, I., Meixner, F. X., Slanina J., Oties, R. P., and Andreae, M. O.: Real-time measurements of ammonia, acidic trace gases and water-soluble inorganic aerosol species at a rural site in the Ama-zon Basin, Atmos. Chem. Phys., 4, 967–987, 2004,
http://www.atmos-chem-phys.net/4/967/2004/.
Warland, J. S., Dias, G. M., and Thurtell, G. W.: A tunable diode laser system for ammonia flux measurements over multiple plots, Environ. Pollut., 114, 215–221, 2001.
Wells, M., Choularton, T. W., and Bower, K. N.: A modeling study of the interaction of ammonia with cloud, Atmos. Environ., 32, 359–363, 1998.
Whitehead, J. D., Twigg, M., Famuali, D., Nemitz, E., Sutton, M. A., Gallager, M. W., and Fowler, D.: Evaluation of laser absorp-tion spectroscopic techniques for eddy covariance flux measure-ments of ammonia, Environ. Sci. Technol., 42(6), 2041–2046, 2008.
Wiebe, H. A., Anlauf, K. G., Tuazon, E. C., Winer, A. M., Bier-mann, H. W., Appel, B. R., Solomon, P. A., Cass, G. R., Ellestad, T. G., Knapp, K. T., Peake, E., Spicer, C. W., and Lawson, D. R.: A Comparison of Measurements of Atmospheric Ammonia by Filter Packs, Transition-Flow Reactors, Simple and Annular Denuders and Fourier-Transform Infrared-Spectroscopy, Atmos. Environ. A-Gen., 24, 1019–1028, 1990.
Wyers, G. P., Otjes, R. P., and Slanina, J.: A continuous-flow de-nuder for the measurement of ambient concentration and surface-exchange fluxes of ammonia, Atmos. Environ, 27A, 2085–2090, 1993.