the Qinling Mountains as a Geographic Barrier Driving
the Fragmentation of a Large Population
Jun–hui Yuan1,3,4, Fang–Yun Cheng1,2*, Shi–Liang Zhou3*
1Landscape Architecture College of Beijing Forestry University, Haidian District, Beijing, China,2National Flower Engineering Research Center, Key Laboratory for the Genetic and Breeding of Forestry Trees and Ornamental Plants, Beijing, China,3State Key Laboratory of Systematic and Evolutionary Botany, Institute of Botany, the Chinese Academy of Sciences, Haidian District, Beijing, China,4Gansu Forestry Technological College, Tianshui, Gansu, China
Abstract
Background:Tree peonies are great ornamental plants associated with a rich ethnobotanical history in Chinese culture and have recently been used as an evolutionary model. The Qinling Mountains represent a significant geographic barrier in Asia, dividing mainland China into northern (temperate) and southern (semi–tropical) regions; however, their flora has not been well analyzed. In this study, the genetic differentiation and genetic structure ofPaeonia rockiiand the role of the Qinling Mountains as a barrier that has driven intraspecific fragmentation were evaluated using 14 microsatellite markers.
Methodology/Principal Findings: Twenty wild populations were sampled from the distributional range of P. rockii. Significant population differentiation was suggested (FSTvalue of 0.302). Moderate genetic diversity at the population level
(HSof 0.516) and high population diversity at the species level (HTof 0.749) were detected. Significant excess homozygosity
(FISof 0.076) and recent population bottlenecks were detected in three populations. Bayesian clusters, population genetic
trees and principal coordinate analysis all classified theP. rockiipopulations into three genetic groups and one admixed Wenxian population. An isolation-by-distance model forP. rockiiwas suggested by Mantel tests (r= 0.6074,P,0.001) and supported by AMOVA (P,0.001), revealing a significant molecular variance among the groups (11.32%) and their populations (21.22%). These data support the five geographic boundaries surrounding the Qinling Mountains and adjacent areas that were detected with Monmonier’s maximum-difference algorithm.
Conclusions/Significance: Our data suggest that the current genetic structure of P. rockii has resulted from the fragmentation of a formerly continuously distributed large population following the restriction of gene flow between populations of this species by the Qinling Mountains. This study provides a fundamental genetic profile for the conservation and responsible exploitation of the extant germplasm of this species and for improving the genetic basis for breeding its cultivars.
Citation:Yuan J–h, Cheng F–Y, Zhou S–L (2012) Genetic Structure of the Tree Peony (Paeonia rockii) and the Qinling Mountains as a Geographic Barrier Driving the Fragmentation of a Large Population. PLoS ONE 7(4): e34955. doi:10.1371/journal.pone.0034955
Editor:Keith A. Crandall, Brigham Young University, United States of America
ReceivedOctober 11, 2011;AcceptedMarch 8, 2012;PublishedApril 16, 2012
Copyright:ß2012 Yuan et al. This is an open-access article distributed under the terms of the Creative Commons Attribution License, which permits unrestricted use, distribution, and reproduction in any medium, provided the original author and source are credited.
Funding:This study was funded by the National Natural Science Foundation of China (31171984, 30930010). The funders had no role in study design, data collection and analysis, decision to publish, or preparation of the manuscript.
Competing Interests:The authors have declared that no competing interests exist.
* E-mail: [email protected] (SZ); [email protected] (FC)
Introduction
The patterns of genetic structure in plants are the result of many interacting factors, including climatic fluctuations, complicated landforms, soil types and human activities; however, a more important factor is the evolutionary history of a species. The Qinling Mountains represent an important geographic barrier in Eastern Asia that divides the current mainland of China into southern and northern and temperate and semi–tropical regions. Additionally, these mountains are a major watershed of the Yellow and Yangtze Rivers. These regional divisions have a huge impact on numerous geographic, climactic and agricultural factors [1]. The Qinling Mountains extend for nearly 2,500 kilometers in the east-west direction and are located in a key tectonic position that links the Dabie Mountains in the east with the Qilian and Kunlun Mountains in the west [2]. Due to their large area, diversified
endemic species are complicated and are closely related to geology, climate, and the process of bio-evolution. Due to the complex landforms, physiognomy and many other environmental features of this area, most of its endemic plant species exhibit complex patterns with respect to the genetic diversity, structure and evolutionary history of their populations [6–8]. However, given the geographical and biological significance of the Qinling Mountains as geographic barriers, studies on plants in this area are lacking.
Tree peonies are an important group of plants that are referred to as ‘the king of flowers’ due to their rich palette of horticultural varieties and deep ethnobotanical history in Chinese culture; in addition, this group of plants has recently been used as an evolutionary model [9,10]. These species are valuable ornamental and medicinal plants commonly found in China, although they are observed in other parts of the world. Approximately 2,000 cultivars of tree peonies are grown throughout the world, and more than 1,000 cultivars are found in China [9–12]. Tree peonies belong to section Moudan of the genus Paeonia in the family Paeoniaceae, and all 9 species of these plants are endemic to China [9–15]. These nine species, Paeonia jishanensis, P. suffruticosa, P. cathayana, P. ostii,P. qiui,P. decomposita,P. rockii,P. delavayi andP. ludlowii, are distributed in the Yunnan, Sichuan, Gansu, Shaanxi, Shanxi, Henan, Hubei, Anhui and Xizang (Tibet) provinces [9– 15]. Paeonia rockii is endemic to the Qinling Mountains and the adjacent area; additionally, this species is associated with the widest distribution range and the greatest numbers of extant plants among all nine species [9–11]. Additionally,P. rockiiis one of the most important ancestral species that has contributed to establishing the cultivated tree peonies. It includes two allopatric infraspecific taxa,P. rockiissp.rockii(subspeciesrockii) andP. rockii ssp. atava (subspecies atava), based on their morphological characteristics [12–15]. In China, subspeciesrockiiis found in the western and eastern parts of the Qinling Mountains and has been observed in the Bashan Mountains in Hubei province, whereas subspecies atava is limited to only the northern slopes of the Qinling Mountains and further northward in this vicinity [9–12]. These subspecies can be easily identified based on morphological differences: subspeciesatavapresents ovate (or rounded) and totally (or mostly) lobed leaflets, whereas subspecies rockii exhibits lanceolate to ovate–lanceolate and totally (or mostly) unlobed leaflets [9–12,15].
Molecular phylogeographic approaches examining both nuclear and organellar genomes have become popular for understanding the patterns of population genetic structure [16,17]. A recent report showed that the four groups (the western, eastern and northern groups and the Taibai Mountain group) of P. rockii closely coincide with the geographic distribution of this species, as revealed by three chloroplast genes, suggesting that the high Qinling Mountains have acted as a geographic barrier contribut-ing to this phylogeographic structure [10]. However, the results also showed a few disparities that the clade of the Taibai Mountain (TM) population of subspecies atava, which is located on a northern slope of the Qinling Mountains, is more closely related genetically to the clades of the populations of the western group of subspecies rockiithan to the clades of other populations (i.e., the Heshui and Tongchuan populations) of the northern group of subspeciesatava. In addition, the clade of the Ganquan population (GQ) of subspeciesatavathat is located to the north of the Qinling Mountains is much closer to the clades of the Luanchuan population (LC) of the eastern group, which is located in the Xun’er Mountains of the eastern Qinling Mountains [10]. As we known, the chloroplast genome shows only a single gene genealogy and is easily affected by various kinds of demographic events (e.g.,
bottlenecks, vicariance, and the accidental loss of lineages) [18,19]. In addition, the occurrence of lineage sorting and ancestral polymorphism has been proposed inPaeonia[10,20]. Comparison to chloroplast markers, the nuclear microsatellite markers with relatively more fast evolutionary rates are more useful for providing a higher resolution with respect to phylogeographic events [21,22] and are highly informative regarding genetic drift and determining bottleneck effects [23–25]. Moreover, several microsatellite markers with moderate to high levels of genetic variation within and among tree species have been detected [9,26], and using these more informative markers will reveal the nature of the population structure ofP. rockiiin greater detail.
The distribution ofP. rockiihas recently been decreasing, similar to that of all other tree peony species, and it has been listed as an endangered species in the Chinese Red Data Book [27]. The major reasons for the reduced distribution in this species are habitat destruction and genetic fragmentation [10,12]. Habitat fragmentation is becoming important to molecular ecologists and conservation geneticists, as it alters genetic diversity, which ultimately changes the entire population structure. Evidence regarding the role of genetic factors in population extinction is increasing [28–30]. Given the important role of P. rockii in breeding new cultivated tree peonies and because it is currently facing endangered status, continuing study of the genetic diversity and genetic structure of this species is worthwhile. The original development of landforms of the Qinling Mountains was promoted by Yanshanian tectonic events in the latest Cretaceous approximately 70 Ma (million years ago) and the subsequent lateral extrusion of the Tibet plateau in the early Cenozoic (approximately 40 Ma). Additionally, its relatively stable land-forms (with a gentle hillside and flat lands) formed in the early Quaternary period (2.4–1.2 Ma). Then, the present high topo-graphic gradients with a height drop of 1,000–2,000 m in the Qinling Mountains and the highest peak, Taibai Mountain, which is 3767 m, resulted from the latest rapid uplift activated by the Himalaya orogenic belt during the Pleistocene (approximately 0.7 Ma) [1,2]. Studies ofP. rockiiin this region could provide a good model for examining the intraspecific evolutionary processes and dynamics associated with this history of complicated landform development in the Qinling Mountains. Furthermore, these studies could provide fundamental genetic information for developing effective and sustainable conservation plans and material for the breeders of this important ornamental plant. Therefore, the major objectives of the present study were 1) to reveal the genetic diversity and population genetic structure ofP. rockiiusing nuclear markers (microsatellite markers) and compare the similarities and differences between the results obtained from chloroplast DNA (cpDNA) and nuclear microsatellite markers and 2) to determine whether and how the Qinling Mountains as a geographic barrier has deeply impacted the population evolution of the endemic speciesP. rockii.
Materials and Methods
Sampling, DNA extraction and microsatellite amplification and scoring
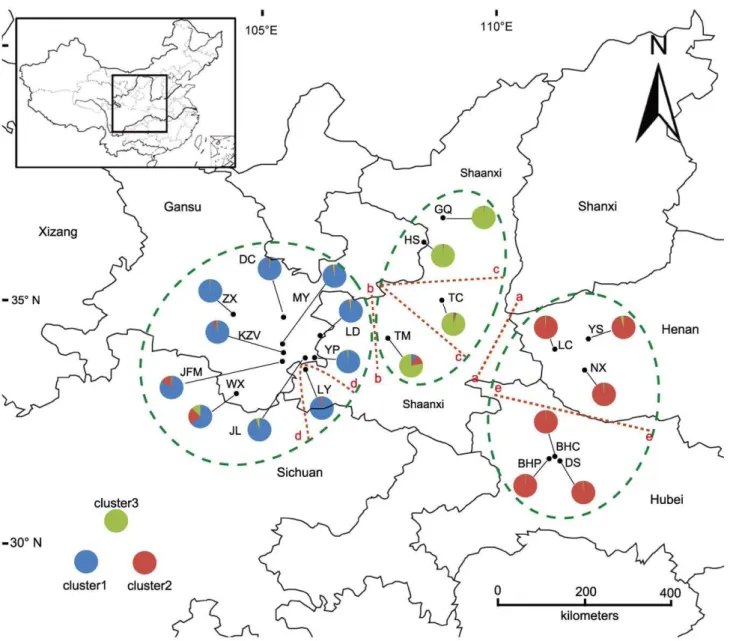
to obtain the greatest possible genetic representation, a minimum distance of 20 m was always maintained between individuals. Because the populations of this species are still declining due to human overexploitation, only 3–30 individuals were collected from each population [11]. Fresh leaves were collected from individual adult plants ofP. rockii(including both subspeciesrockii and subspeciesatava) and immediately placed in silica bags. The samplings included 335 wild individuals of 20 populations that contained four populations (GQ, HS, TC and TM) of subspecies atavaand the other 16 populations of subspeciesrockii, as shown in Figure 1 (Table S1. All necessary permits were obtained for the described fields.)
For each sampling site, the altitude, longitude and latitude were recorded using a GPS (eTrex Venture, Garmin Ltd., Olathe USA) (Table S1). The genomic DNA was extracted from 100 mg of dried leaf tissue using a modified cetyltrimethylammonium bromide (CTAB) method [32]. The polymerase chain reaction (PCR) analysis of theP. rockiicollection was carried out using 14 microsatellite markers, as shown in Table S2 [9]. The 14
microsatellite markers were selected from 59 microsatellite loci developed forPaeonia[9,26]. To ensure the integrity and specificity of the PCR, the products were sequenced using an ABI 3730xl automated sequencer (Applied Biosystems, Foster City, CA, USA). PCR amplifications were performed in 10-mL reaction volumes containing 16PCR buffer (10 mM Tris–HCl [pH 8.3], 50 mM KCl, and 1.5 mM MgSO4), 2.5 mM MgCl2, 0.2 mM each dNTP, 0.25mM reverse primer and 0.25mM forward primer tagged with JOE, NED, FAM or PET fluorescent dye to facilitate post-PCR multiplexing. The PCR amplifications were performed using an initial denaturation at 94uC for 3 minutes, followed by 25 cycles of 30 seconds of denaturation at 94uC, 30 seconds of annealing at 54uC and 1 minute of polymerization at 72uC, with a final extension step of 10 minutes at 72uC. The PCR products were detected using an ABI 3730xl DNA Analyzer with GeneScanTM-600 LIZ (Applied Biosystems, Foster, California, USA) as an internal size standard, and each locus was genotyped with GeneMapper ver. 4.0 (both supplied by Applied Biosystems, Foster, USA). Samples in which the alleles were uncertain were
Figure 1. Geographic and topographic barriers, ancestral gene pools, and locations of populations sampled inPaeonia rockii.
double-checked by repeating the amplification and proofreading the raw data.
Data analysis
For each microsatellite locus, the genetic diversity was analyzed to calculate the total number of alleles (TA), observed heterozy-gosity (Ho), average genetic diversity (HS) both within populations and among populations and total gene diversity (HT) [33]. For each population, the genetic diversity was measured across all of the loci in terms of the observed number of alleles (AO), observed heterozygosity (HO), unbiased expected heterozygosity (HE), private alleles (AP) and allelic richness (AR) [34]. The allelic richness (AR[10]) was standardized for 5 individuals (by discarding all of the populations with,5 individuals) using FSTAT version 2.9.3.2 [35].
The significance of any deviations from Hardy-Weinberg equilibrium, as indicated by deviations of the fixation index (FIS) [36], was tested by randomization using FSTAT version 2.9.3.2 [35]. Genotypic disequilibrium was tested for all of the loci in each population by randomization, and the obtainedP-values ( = 0.05) were adjusted using a sequential Bonferroni correction [37] to avoid false positives with FSTAT version 2.9.3.2 [35].
To examine the geographic gradients in the genetic diversity within populations, the relationships between the genetic diversity within populations (AR and HE) and their geographic locations (latitude and longitude) were tested by linear regression. Reduction in the effective population size was estimated using Wilcoxon’s signed-rank tests (one-tailed) with the null hypothesis, HE.HEQ, and the alternative hypothesis,HE,HEQ, under the assumption of mutation-drift equilibrium in the infinite-alleles model (IAM) and the stepwise mutation model (SMM) using BOTTLENECK version 1.2.02 [38–40].
The genetic differentiation among populations was estimated at each locus and across all of the loci by calculating FST using GenAlEx version 6.2 [41]. The presence of isolation-by-distance (IBD) patterns in population differentiation was investigated by a Mantel test [42] with 1000 random permutations to evaluate the correlation between the matrix of pairwise genetic distances measured by FST/(12FST) according to Rousset [43,44]. To investigate the geographic structure of genetic variation further, a hierarchical analysis of molecular variance (AMOVA) was performed using ARLEQUIN version 3.10 [45], while the total genetic variance was partitioned into covariance components at different levels, including among groups, among populations and within populations.
The pattern of genetic variation among populations was assessed using three different methods. First, the software package, STRUCTURE 2.1 [46], applied a Bayesian method to infer the number of clusters (K) without using prior information on the individual sampling locations. This program distributes the individuals among K clusters based on their allelic frequencies and estimates the posterior probability of the data given each particular K. STRUCTURE was run for the K= 1 to K= 30 clusters. Each run was pursued for 106MCMC iterations, with an initial burn-in of 56105, and an ancestry model that allowed for admixture, with the same alpha for all of the populations. To assess stability, 10 independent simulations were performed for each K. The final posterior probability of K, lnP(x|K), was computed, as suggested by Pritchard et al. [46], using the analyses with the highest probability for eachK. lnP(x|K) usually plateaus or increases slightly after the ‘right’ K is reached. Thus, following Evanno et al. [47],DKwas calculated. The sensitivity of the final result to the specific previous assumptions of alpha and with regard to the independence of the allelic frequencies was also computed.
The second method was a distance-based clustering analysis using a neighbor-joining tree based on genetic distance (DA) [33] using POWERMARKER version 3.25 [48]; the third method was a principal coordination analysis (PCA) based on allele frequencies using the Multivariate Statistical Package (MVSP) version 3.13b (Kovach Computing Services, Anglesey, Wales, UK).
The genetic barriers associated with each geographical location and population were investigated using Monmonier’s maximum-difference algorithm [49] in BARRIER version 2.2 [50]. MICROSATELLITE ANALYSER (MSA) version 4.05 [51] was used to determine the genetic boundaries, and their significance was estimated using bootstrap values based on 2,000 permuted distance matrices.
Results
Overall genetic diversity and diversity within populations ofP. rockii
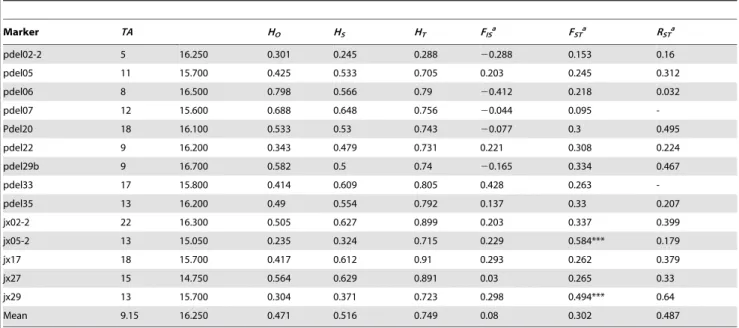
Estimates of the diversity among the microsatellite loci are shown in Table 1. The total number of alleles per locus in the entire germplasm ranged from 5 to 22, with a total of 183 alleles. The average genetic diversity (HS) among the loci was 0.516 and ranged from 0.245 to 0.648. Similarly, the average overall genetic diversity (HT) estimate among the populations was 0.749, ranging from 0.288 to 0.899. The mean number of alleles per locus was 15.9 and ranged from 1.71 (TC) to 24.71 (JL). The mean values for the observed heterozygosity (HO) and unbiased expected heterozygosity (HE) were 0.459 and 0.492, respectively. The value of the private alleles per population (AP) was 2.3, and the mean within the population allelic richness (AR[10]) was 2.65, as shown in Table 2. As shown in Table 1, theFISover all the loci was found to be significant in eight populations (BHC, DC, DS, HS, JL, KZV, LD, and ZX), whereas theFISwithin populations was significant for eight loci (pdel05, pdel22, pdel33, pdel35, jx02-2, jx05-2, jx17, and jx29), as shown in Table 2. These results suggest a significant deviation from the Hardy-Weinberg equilibrium. However, no evidence of significant genotypic linkage disequilibrium was observed in any of the 1,820 permutation tests among 92 locus pairs in each population. Therefore, the 14 loci analyzed were determined to be sufficiently independent for use in Bayesian clustering.
No significant relationships existed between the genetic diversity in terms of theARwithin populations (orHE) and their geographic locations (latitude and longitude). According to Wilcoxon’s signed-rank test performed using BOTTLENECK, three populations (DC, GQ and LC) showed a significant deviation (excess heterozygosity) from the mutation-drift equilibrium under the IAM (after sequential Bonferroni correction), as shown in Table 3, suggesting that decreases in the population size had occurred due to a bottleneck effect.
The genetic diversity was found to be relatively high, but no significant differences between subspecies atava (AR[12]= 2.38; HO= 0.442; HS= 0.456) and subspecies rockii (AR[12]= 2.69; HO= 0.493; HS= 0.523) were observed after 1000 permutation tests (P.0.05).
Genetic differentiation
value ofFSTof 0.57 was found between TC and BHC, and the lowest FST value of 0.01 was found between JFM and JL. However, no significant difference between ssp.atava(FST= 0.368) and ssp.rockii(FST= 0.284) was detected at fourteen microsatellite loci (1000 permutations,P.0.05).
The Mantel test revealed a significant and strong correlation between the geographic and genetic distances of the populations (R2= 0.369, P,0.001; Figure S1). The AMOVA results for the microsatellites were also significant (P,0.001, Table 3), revealing that 67.45% of the total variance was partitioned within populations, whereas 11.32% and 21.22% of the total variance were explained by differences among the groups (WG, NG, EG) and among the populations within groups, respectively.
Population structure ofP. rockii
When using the Bayesian-based clustering approach of Pitchard et al. [46], the inference of the number of gene pools (K) was not straightforward because log-likelihood values for the data conditional on K, and lnP(x|K), increased progressively as K increased, as shown in Figure 2. In such a case, it may not be possible to determine the true value ofK. However, thenKvalues [47] computed for allKclasses indicated a strong signal atK= 3, as shown in Figure 2. Changing the assumptions of an ‘equal alpha for each population’ and ‘correlated allele frequencies’ did not change this final result. The proportion of individuals in each
population assigned into three clusters (or gene pools) is shown in Figure 2, and the corresponding 20 populations were plotted onto the map, as shown in Figure 1. The Bayesian clustering approach revealed that gene pool 1 (P1) was most abundant in the Western Qinling Mountains and that this pool included nine populations: JL, YP, LY, LD, KZV, JFM, DC, ZX and MY. Gene pool 2 (P2) was predominant across the Eastern Qinling Mountains (the Funiu Mountains and Xun’er Mountains in Western Henan province) and in the Shennongjia forestry area in Western Hubei province and included six populations: NX, LC, YS, DS, BHC and BHP. Gene pool 3 (P3) was predominant on the northern slope of the Qinling Mountains and in the Ziwuling forestry area and encompassed four populations: HS, GQ, TC and TM. However, only one population, WX, which was located in the southernmost region of Gansu, showed a mixture of the three ancestral genetic resources (Figure 1). With the exception of WX, it was obvious that the three gene pools were almost in accordance with the natural pattern of distribution ofP. rockii.
The results of the distance-based clustering analysis using a neighbor-joining tree based on theDAare presented in Figure S2 and showed that the 20 populations were clustered into three major clades, except for the single clade that included WX. The western clade (WC) comprised JL, YP, LY, LD, KZV, JFM, DC, ZX and MY, whereas the eastern clade (EC) comprised NX, LC, YS, DS, BHC and BHP. Similarly, the northern clade (NC)
Table 1.Genetic diversity measures estimated using 14 microsatellite loci in each of 20Paeonia rockiipopulations.
Population n A AR[10] HO HE FISa IAMb SMMb
BHC 6 1.93 1.81 0.25 0.319 0.236 0.064 0.18
BHP 6 3.29 2.71 0.469 0.391 20.227 0.055 0.151
DC 25 5.29 2.86 0.493 0.554 0.116 0.38 0.999
DS 22 4.29 2.6 0.38 0.494 0.235 0.38 0.979
GQ 29 3.71 2.64 0.543 0.519 20.046 0.002** 0.768
HS 26 3.21 2.13 0.347 0.395 0.122 0.428 0.979
JFM 4 3.43 - 0.673 0.691 0.03 -
-JL 27 6.64 3.58 0.543 0.667 0.189 0.010* 0.979
KZV 13 4.64 3.16 0.509 0.609 0.17 0.052 0.866
LC 12 2.71 2.43 0.507 0.434 20.178 0.001** 0.055
LD 24 4.21 2.6 0.476 0.533 0.11 0.034 0.709
LY 3 2.07 - 0.333 0.41 0.222 -
-MY 24 5.36 3.12 0.616 0.642 0.041 0.001*** 0.749
NX 24 4.07 2.48 0.552 0.512 20.068 0.148 0.955
TC 2 1.43 - 0.286 0.274 20.067 -
-TM 3 1.86 - 0.381 0.352 20.103 -
-WX 30 5.14 2.77 0.538 0.566 0.051 0.047* 0.905
YP 26 4.79 2.62 0.508 0.515 0.014 0.665 1
YS 3 2.29 - 0.393 0.488 0.241 -
-ZX 26 3.43 2.29 0.384 0.471 0.188 0.086 0.787
Average 16.75 3.69 2.65 0.459 0.492
Note: n, sample size;A, number of alleles per locus;AR[10], mean within-population allelic richness for a standardized sample size of ten gene copies;HO, observed heterozygosity;HE, unbiased expected heterozygosity;FIS, fixation index. Sequential Bonferroni correction was used to determine significance levels in multiple tests.
aDeviations of
FISfrom 0 in each population were evaluated by permutation tests.
bProbabilities associated with Wilcoxon’s signed-rank tests (one-tailed) forH
E.HEQ, whereHEQis the heterozygosity expected at mutation-drift equilibrium under the infinite-allele model (IAM) and the stepwise-mutation model (SMM) (Cornuet and Luikart 1996; Piry et al. 1999).
*P,0.05, **P,0.01, ***P,0.001.
comprised HS, GQ, TC and TM. The clustering results are in agreement with the clustering results obtained using STRUC-TURE. The NJ tree also clearly showed that these three clades were distinct from each other; this result was supported by moderate to high bootstrap values of 60% for WC, 91% for EC, and 71% for NC (Figure S2).
The PCA clustered these populations into three groups, as shown in Figure S3, which corresponded to the three gene pools (Figure 2) or three clades (Figure S2). However, there was some ambiguity regarding the placement of the individuals of popula-tion WX, as the individuals of this populapopula-tion represented a mixture of the other groups. The three clustering results from the three different analysis methods were clearly in total agreement with each other.
Geographic barrier among populations
Analysis of the genetic boundaries between the populations supported the five boundaries shown in Figure 1 and Figure 3. The first boundary found, between population LC and TC, separated the populations of P2 from the populations of P3 (e.g., TC) with 79% bootstrap support. The second boundary was found
between TM and LD and the isolated TM population of P3 from the other populations of P1 (e.g., LD) with bootstrap values ranging from 91 to 76. The third boundary separated the populations of P1 into three groups, consisting of populations TM, TC and GQ-HS, with 81% bootstrap support. The fourth boundary isolated only one population, LY, from the other populations of P1 with 90% bootstrap support. The fifth boundary separated the populations of P2 into two groups, DS-BHC-BHP and NX-LC-YS, with 89% bootstrap support.
Discussion
High population differentiation, bottlenecks and the distinct genetic structure ofP. rockii
Significant population differentiation was indicated by the high FSTvalues (averaging 0.302); additionally, we detected moderate genetic diversity at the population level (HS= 0.516,HE= 0.492) and high population diversity (HT= 0.749) at the species level. The finding of high genetic diversity at the species level was similar to the results obtained from three cpDNA sequences in a previous study [10] and from other molecular studies [52–54]. It was also
Table 2.Genetic diversity measures estimated at each of 14 microsatellite loci across the 20Paeonia rockiipopulations.
Marker TA HO HS HT FISa FSTa RSTa
pdel02-2 5 16.250 0.301 0.245 0.288 20.288 0.153 0.16
pdel05 11 15.700 0.425 0.533 0.705 0.203 0.245 0.312
pdel06 8 16.500 0.798 0.566 0.79 20.412 0.218 0.032
pdel07 12 15.600 0.688 0.648 0.756 20.044 0.095
-Pdel20 18 16.100 0.533 0.53 0.743 20.077 0.3 0.495
pdel22 9 16.200 0.343 0.479 0.731 0.221 0.308 0.224
pdel29b 9 16.700 0.582 0.5 0.74 20.165 0.334 0.467
pdel33 17 15.800 0.414 0.609 0.805 0.428 0.263
-pdel35 13 16.200 0.49 0.554 0.792 0.137 0.33 0.207
jx02-2 22 16.300 0.505 0.627 0.899 0.203 0.337 0.399
jx05-2 13 15.050 0.235 0.324 0.715 0.229 0.584*** 0.179
jx17 18 15.700 0.417 0.612 0.91 0.293 0.262 0.379
jx27 15 14.750 0.564 0.629 0.891 0.03 0.265 0.33
jx29 13 15.700 0.304 0.371 0.723 0.298 0.494*** 0.64
Mean 9.15 16.250 0.471 0.516 0.749 0.08 0.302 0.487
Note:TA, total number of alleles;HO, observed heterozygosity;HS, gene diversity;HT, overall gene diversity;FIS, fixation index;FStandRST, measures of relative genetic differentiation among populations under the infinite-allele model and the stepwise-mutation model, respectively. Sequential Bonferroni correction was used to determine significance levels in the multiple tests.
aDeviations ofF
IS,FSTandRSTfrom 0 were evaluated by permutation tests. ***P,0.001.
doi:10.1371/journal.pone.0034955.t002
Table 3.Results of the analysis of molecular variance (AMOVA) for 20 populations ofPaeonia rockiicategorized into three geographical regions.
Source of variation d.f. Sum of squares Variation components Variation (%)
Among groups 2 358.542 0.77859 16.04***
Among populations within group 17 565.003 1.00544 20.72***
Within populations 315 1891.071 3.06892 63.24***
d.f., degrees of freedom.
suggested that the existence of restricted gene could have contributed to the development of distinct subpopulations. Bottlenecks occurred in three populations: DC, which was located in Western Qinling; LC, in the Xun’er Mountains in the eastern-to-central part of the Qinling Mountains; and GQ, in the Ziwuling forestry area far north of the Qinling Mountains. Our results indicated that population bottlenecks had occurred over the entire distributional range of P. rockii. The cold climatic fluctuation during the glacial cycles of the Quaternary Period might have been responsible for the whole population bottlenecks, leading to genetic drift and further increases in population differentiation. This prediction was also supported by the cpDNA data reported by Yuan et al. [10]. The subpopulations ofP. rockii would have subsequently diverged rapidly due to founder events, habitat fragmentation, or human disturbance. The fact that clear signals of recent bottlenecks were found in only three of the twenty populations might be attributed to the biparental inheritance characteristics of the microsatellite loci that prevented the detection of additional bottleneck events because of homoplasy characteristics or to most populations reaching a new mutation-drift equilibrium at a new effective population size following the last bottleneck events.
A significant deviation from the Hardy-Weinberg (HW) equilibrium was also observed in the P. rockii populations, as indicated by both theFISvalue over all the loci (Table 1) and the FIS within individual populations per locus (Table 2). The main
causes of the significant positive values of theFISare the existence of excess homozygosity and inbreeding populations [55,56]. BecauseP. rockii is an allogamous species [31,57], the observed excess homozygosity may not be due to inbreeding; rather, it may be due to the population substructure, selection favoring homozygotes, and null alleles.
In the present study, the same clear population structure forP. rockii, comprising three major genetic distinct groups, P1 (the western clade), P2 (the eastern clade) and P3 (the northern clade), and only one mixed population, was detected by Bayesian analysis, Neighbor-joining tree and PCA on the basis of microsatellite data. Additionally, the genetic relationships among the populations ofP. rockiireflecting the natural geographic locations of the populations were supported by an isolation-by-distance model forP. rockiiusing the Mantel test [40]. We found that the geographically close populations were characterized by low genetic differentiation, but as the distance among the populations increased, the genetic differentiation among the populations also increased. The observed patterns of population differentiation were also support-ed by the results of AMOVA (P,0.001), which revealed significant molecular variance both among groups (11.32%) and within groups (21.22%) (Table 3). Only population WX exhibited admixed ancestral genetic information on the basis of the microsatellite genotype data, and this population may represent the remnants of ancestral polymorphism or the original population of P. rockii. In addition, the population WX was found to be Figure 2. Bayesian inference of the number of clusters (K) ofPaeonia rockii.Kwas estimated using (A) the posterior probability of the data given eachK(10 replicates) and (B) the distribution ofnK, and (C) the three colored clusters were detected from STRUCTURE analysis. The name of each site is given below.
associated with a long branch in a cpDNA phylogenetic tree [10]. This population was located in the farthest southwestern area of the distribution range ofP. rockii, near the range ofP. decomposita; thus, it was worth investigating the wild germplasm at the boundary between the two species in detail to determine the evolutionary history of these populations.
Five geographic barriers indicating that the current pattern of genetic structure is a result of the
fragmentation of a panmicticlarge populationofP. rockii
Five boundaries, consisting of two boundaries between three groups of populations (P1, P2 and P3) and three additional boundaries within the three groups, were detected using BARRIER software [50] with Monmonier’s maximum-difference algorithm [49]. The detected genetic structure potentially identifies a historical limitation of migration and gene flow among and within the three groups of P. rockii populations. The first boundary, between the northern clade and the eastern clade, was located between the TC population of the Weihe Basin and population LC of the Xun’er Mountains in the eastern-to-central Qinling Mountains. This boundary was obvious in nature and was supported by the existence of the tectonic boundary of the Luonan-Luanchuan Fault [2]. This Fault isolated the populations of P. rockii in the Eastern Qinling Mountains and the Bashan Mountains from the other populations in the Central Qinling Mountains. The second boundary, between the northern clade and the western clade, was located between the TM population in the Taibai Mountains at the northern boundary of the Qinling Mountains and the LD population in the mountain area of Southern Gansu in the western part of the Qinling Mountains. As a result of the normal fault growth and footwall flexure of the mountains, especially after a large-magnitude rapid uplift in 0.7 Ma, the Taibai Mountain became the highest peak of the
Qinling Mountains [1,2]. The third boundary, corresponding to the Weihe River, was detected between the populations of the northern clade and separated the TC population of the Weihe Basin from the populations of the Taibai Mountains and Ziwuling forestry area of the Loess Plateau. The Weihe Basin, located between Taibai Mountains and the Loess Plateau, is a down-faulted basin that was produced from an upper wall extensional normal fault during the Cenozoic [2]. The fourth boundary was found within the western clade and isolated only one population, LY, on the southern slope of the Qinling Mountains from the populations of the mountainous area in Gansu. The fifth boundary was detected within the eastern clade and separated the NX-LC-YS populations of the Xun’er Mountains in the Western Qinling Mountains from the DS-BHC-BHP populations of the Bashan Mountains.
It was highly unexpected that the genetic subpopulations ofP. rockiiwould be so perfectly in line with the existing geographical barriers. The current landform and topographical features of the Qinling Mountains mainly formed by beginning with a small-magnitude uplift of 70–40 Ma and a rapid large-small-magnitude uplift beginning at 1.2–2.4 Ma (or 0.7 Ma), especially with respect to the higher mountain features of the Taibai Mountains [1,2,5,58]. In the last 5000 years, the climate of the Qinling Mountains has repeatedly changed, according to historical records [1,5,59]. The major trend of climatic change in this region has been a shortening of warming periods and a lengthening of cold periods, such that the climate type on the northern slope of the Qinling Mountains has gradually changed from subtropical to temperate [5,59]. Following the Qing Dynasty (AD 1636–1911), the human population growth in mountainous areas, the use of new types of crops and the implementation of unreasonable development policies led to serious damage to the forestry cover and the overall deterioration of the Qinling Mountain ecosystem [5,59]. The estimated divergence time for the P. rockii populations using Figure 3. The first five genetic boundaries (thick lines) detected by BARRIER version 2.2 using genetic distance.The order of the alphabetical pairs represents the sequence of the boundary formation. Large numbers correspond to the population numbers plotted along the ordination. Small numbers represent the bootstrap values indicating support for the respective boundaries. Thin dashed lines and solid lines represent the Voronoi tessellation and the Delaunay triangulation, respectively.
cpDNA sequences ranges from 0.4 to 1.6 Ma according to Yuan et al. [10] and is concurrent with the time scale of the latest rapid uplifts of the Qinling Mountains. Thus, it is strongly suggested that the genetic differentiation ofP. rockiipopulations is greatly related to the rapid, large-magnitude uplift of the Qinling Mountains. Although the estimation of divergence rates or times using the molecular clock hypothesis has been based on uncertain assumptions and approximate values with respect to the lack of Paeonia fossils, these estimations are still useful for attempts to understand the rate of evolution and the historical biogeography of Paeonia. In addition, geographic isolation has been proposed by Sang et al. [60] as a major driving force of speciation and rapid diversity forPaeoniaspecies, and the timing of the intercontinental disjunction of peonies had been roughly estimated to 16.6 Ma in the Miocene based on cpDNA sequences [60]. We could not rule out the possibility that the genetic clusters of the P. rockii populations that were detected based on both microsatellite and cpDNA data were merely random coincidence; however, it is clear that the geographic isolation that has occurred in the Qinling Mountains has contributed to limiting the gene flow between the P. rockiipopulations [9,10].
How and why has this type of genetic structure developed inP. rockii? We hypothesize that a formerly continuously distributed panmictic large population of P. rockii has fragmented into small, isolated populations. Such changes would lead to an erosion of the genetic variation and an increase of genetic differentiation among populations due to enhanced genetic drift and reduced gene flow [29,30]. This hypothesis was supported by a series of findings. An isolation-by-distance model forP. rockii, based on the Mantel test, indicated a significant correlation between the genetic distance and the geographic distance. The recent bottleneck events detected, the high degree of population differentiation among three gene pools and the existence of five natural geographic barriers suggest that the genetic differentiation among the studied populations has been impacted by impediments to gene flow and that geographic distance has played an important role in the current genetic pattern (Figure 1 and Figure 3).
The other possible causes leading to the three distinctP. rockii gene pools are inefficient pollen flow, low seed dispersal, and low germination rates across the distributional range of this species [10,52,54,61]. These results suggest that the geographically close populations ofP. rockiiexhibited a low genetic differentiation, but as the distance among the populations increased, the genetic differentiation among the populations also increased. These differences with respect to the genetic differentiation are due to the geographic barriers that have separated the different gene pools, which each subsequently evolved individually.
Although many lines of evidence presented above support the hypothesis that the population structure inP. rockiican be mainly explained by a simple isolation-by-distance model associated with geographic barriers, this hypothesis requires the evaluation of additional factors that may have influenced the observed genetic population structure, such as natural selection. Environmental factors also contribute to the current population differentiation to some degree, and it is worth continuing to investigate how these populations that are isolated by natural geographic barriers adapt to their niches and evolve independently.
Comparison of molecular and morphological variation in P. rockii
When the genetic groups, as determined based on the microsatellite loci, were compared with the groups based on cpDNA sequences, the results were essentially in agreement [10]. However, there were two points of disparity: the first was that the
TM population was grouped into the northern clade using the SSR (simple sequence repeats) data, but it was indicated as an independent clade, isolated from the other populations of the northern group and closer to the western clade in the cpDNA tree [10]; the second point was that the GQ population was grouped into the northern clade using the SSR data but into the eastern clade in the cpDNA tree [10]. In general, different evolutionary histories and events are reflected in different molecular markers, such that the SSRs, which are representative of the nuclear genome, mainly reflect pollen flow, and the cpDNA sequences, which are representative of the chloroplast genome, only reflect seed flow in Paeonia [9,21–23]. The SSR data are suitable for reflecting the relatively recent intraspecies evolutionary historical events, ranging from at least 3,000–30,000 to more than 200,000 years [62–65], whereas the cpDNA sequences are more suitable for detecting long-term events, such as more than 16.6 Ma in Paeonia and tracing the evolutionary history for all higher plant species across millions of years [60,66]. However, the chloroplast genome shows only a single gene genealogy [18] and is easily affected by various types of demographic events (e.g., bottlenecks, vicariance, and the accidental loss of lineages) [17,19]. In addition, lineage sorting and ancestral polymorphism has been proposed to occur inPaeonia [10,20] and was also suggested by the results of this study; furthermore, lineage sorting and/or ancestral polymor-phism were responsible for the first disparity related to population TM [9–12,20], as mentioned above. The second point of disparity, associated with population GQ, reflects one evolutionary event of long-distance seed dispersal reported by Yuan et al. [10].
Phenotypic variation followed the geographical distribution of this species. The populations that are geographically distributed in the north of Qinling Mountains and further north in its vicinity (populations TM, GQ, HS and TC) exhibit ovate or rounded and totally or mostly lobed leaflets, classified as P. rockii ssp. atava. However, the other populations of this species, mainly distributed in the eastern or western part of the Qinling Mountains, present lanceolate or ovate–lanceolate and totally or mostly unlobed leaflets, classified asP. rockiissp.rockii. With respect to phenotypic variation, the nuclear genes, reflected in SSR data, and environmental factors are both responsible for the morphological development ofP. rockii; however, the chloroplast genome is not. Thus, the results of this study support the idea that a more comprehensive understanding of evolutionary history and speci-ation is provided by the integrated analysis of data from two genomes (nuclear and chloroplast genome).
Cultivated tree peonies, respected as ‘the king of flowers’ in China, are very popular ornamental plants, and breeding programs will greatly benefit from this study. More new cold-resistant, wet-cold-resistant, or hot-resistant varieties with more ornamental value could be bred in the future using the different genetic germplasms from the different gene pools of P. rockii because the isolated gene pools of this species might have accumulated a number of mutations to adapt to the different ecologic niches within the different climates after independently evolving for almost 0.7–2.4 Ma.
provide a fundamental genetic profile for the conservation and responsible exploitation of the extant germplasm of this species to improve the genetic basis for breeding its cultivars. Finally, this study offers new insight into the abundant biodiversity of plant species that are endemic to the Qinling Mountains of China and provides a model case for studying their complex evolutionary history.
Supporting Information
Figure S1 Mantel test for matrix correlation between the genetic distance and log geographical distance. (TIF)
Figure S2 Clustering analysis of the 20 Paeonia rockii
populations based on genetic distance. The phylogenetic tree was constructed with the POWERMARKER software package (Liu et al., 2005) based on the populations’ pair-wise genetic distances (Nei 1983). The shapes near site names on the tree indicate STRUCTURE grouping.
(TIF)
Figure S3 Principal coordinate analysis (PCA) of Paeo-nia rockiipopulations based on microsatellite data.
(TIF)
Table S1 Population locations and sample sizes for
Paeonia rockii.
(DOC)
Table S2 Repeat motifs, annealing temperatures (Ta),
primer sequences and the range of alleles detected per locus for the microsatellite loci.
(DOC)
Table S3 A pair-wise matrix of geographic distance (upper right) and FST (below left)_between the 20
populations ofPaeonia rockii.
(DOC)
Acknowledgments
We are grateful to the anonymous reviewers and the editor for their critical review; their comments substantially contributed to the revision and improvement of this work. We also give much thanks to Mr. Jia-jue Li, Dr. Jia Wang, Mrs. Ya-Ling Tian, Mr. Jian-Hong Wang and the administra-tive staff of the Gansu Forestry system for their help during the sample collection and fieldwork. We thank Dr. Rehan Naeem for his helpful advice on a previous version of the manuscript.
Author Contributions
Conceived and designed the experiments: JY FC SZ. Performed the experiments: JY. Analyzed the data: JY. Contributed reagents/materials/ analysis tools: JY FC. Wrote the paper: JY FC.
References
1. Ying TS (1994) An analysis of the flora of Qinling Mountain range: its nature, characteristics and origins. Acta Phytotax Sin 32: 389–410.
2. Dong YP, Zhang GW, Neubauer F, Liu XM, Genser J, et al. (2011) Tectonic evolution of the Qinling orogen, China: Review and synthesis. J Asian Earth Sci 41: 213–237.
3. Zhang YP, Wang XX, Ryder OA, Li HP, Zhang HM, et al. (2002) Genetic diversity and conservation of endangered animal species. Pure Appl Chem 74(4): 575–584.
4. Lei FM, Qu YH, Lu JL, Yin ZH (2003) Conservation on diversity and distribution patterns of endemic birds in China. Biodivers Conserv 12(2): 239–254.
5. Ying JS, Zhang YL (1994) The Endemic Genera of Seed Plants in China. Sciences Press, Beijing, China.
6. Bai WN, Liao WJ, Zhang DY (2010) Nuclear and chloroplast DNA phylogeography reveal two refuge areas with asymmetrical gene flow in a temperate walnut tree from East Asia. New phytologist 188(3): 892–901. 7. Shen L, Chen XY, Zhang X, Li YY, Fu CX, et al. (2005) Genetic variation of
Ginkgo bilobaL. (Ginkgoaceae) based on cpDNA PCR-RFLPs: inference of glacial refugia. Heredity 94: 396–401.
8. Wang HW, Ge S (2006) Phylogeography of the endangeredCathaya argyrophylla (Pinaceae) inferred from sequence variation of mitochondrial and nuclear DNA. Mol Ecol 15: 4109–4122.
9. Yuan JH, Cheng FY, Zhou SL (2010) Hybrid origin ofPaeonia6yananensis revealed by microsatellite markers, chloroplast gene sequences, and morpho-logical characteristics. Int J Plant Sci 171: 409–420.
10. Yuan JH, Cheng FY, Zhou SL (2011) The phylogeographic structure and conservation genetics of the endangered tree peony,Paeonia rockii(Paeoniaceae), inferred from chloroplast gene sequences. Conserv Genet 12: 1539–1549. 11. Cheng FY (2007) Advances in the breeding of tree peonies and a cultivar system
for the cultivar group. Int J Breed 1: 89–104.
12. Li JJ (2005) Chinese Tree Peony (Xibei, Xinan, Jiangnan Volume). China Forestry Publishing House, Beijing.
13. Hong DY (1998)Paeonia rockiiand its one new subspecies from Mt. Taibai, Shaanxi of China. Acta Phytotax Sin 36: 538–543.
14. Hong DY, Pan KY (2005) Notes on taxonomy ofPaeonia sect.MoutanDC. (Paeoniaceae). Acta Phytotax Sin 43: 169–177.
15. Hong DY (2010) Peonies of the world: taxonomy and phytogeography. Royal Botanic Gardens, Kew, UK.
16. Comes HP, Kadereit JW (1998) The effect of Quaternary climatic changes on plant distribution and evolution. Trends Plant Sci 3: 432–438.
17. Nordborg M (2001) Coalescent Theory. Handbook of Statistical Genetics Balding D, Bishop M, Cannings C, eds. 179–212. Wiley, Chichester. 18. Heuertz M, Hausman JF, Hardy OJ, Vendramin GG, Frascaria-Lacoste N, et al. (2004) Nuclear microsatellites reveal contrasting patterns of genetic structure
between western and southern European populations of the common ash (Fraxinus excelsiorL.). Evolution 58: 976–988.
19. Knowles LL, Maddison WP (2002) Statistical phylogeography. Mol Ecol 11: 2623–2635.
20. Zhang JM, Wang JX, Xia T, Zhou SL (2009) DNA barcoding: species delimitation in tree peonies. Sci China Ser C-Life Sci 52(6): 568–578. 21. Aizawa M, Yoshimaru H, Katsuki T, Kaji M (2008) Imprint of post-glacial
history in a narrowly distributed endemic spruce,Picea alcoquiana, in central Japan observed in nuclear microsatellites and organelle DNA markers. J Biogeogr 35: 1295–1307.
22. Sousa V, Penha F, Collares-Pereira MJ, Chikhi L, Coelho MM (2008) Genetic structure and signature of population decrease in the critically endangered freshwater cyprinidChondrostoma lusitanicum. Conserv Genet 9: 791–805. 23. Burg TM, Gaston AJ, Winker K, Friesen VL (2005) Rapid divergence and
postglacial colonization in western North American Steller’s jays (Cyanocitta stelleri). Mol Ecol 14: 3745–3755.
24. Takahashi T, Tani N, Taira H, Tsumura Y (2005) Microsatellite markers reveal high variation in natural populations ofCryptomeria japonicanear refugial areas of the last glacial period. J Plant Res 118: 83–90.
25. Tsuda Y, Ide Y (2005) Wide-range analysis of genetic structure of Betula maximowicziana, a long-lived pioneer tree species and noble hardwood on the cool temperature zone in Japan. Mol Ecol 14: 3929–3941.
26. Wang JX, Xia T, Zhang JM, Zhou SL (2009) Isolation and characterization of fourteen microsatellites from a tree peony (Paeonia suffruticosa). Conserv Genet 10: 1029–1031.
27. Fu LG (1992) Chinese red Data Book: Rare and Endangered Plants. Sci Press, Beijing.
28. Keyghabadi N (2007) The genetic implication of habitat fragmentation for animals. Can J Zoo 85: 1049–1064.
29. Young A, Boyle T, Brown, Tony (1996) The population genetic consequences of habitat fragmentation for plants. Trends Ecol Evol 11(10): 413–418. 30. Honnay O, Jacquemyn H (2007) Susceptibility of common and rare plant
species to the genetic consequences of habitat fragmentation. Conserv Biol 21(3): 823–831.
31. Cheng FY, Li JJ, Chen DZ (1997) The natural propagation characteristics of wild tree peony species in China. Acta Hort Sin 24: 180–184.
32. Doyle JJ, Doyle JL (1987) A rapid DNA isolation procedure for small quantities of fresh leaf material. Phytochem Bull 19: 11–15.
33. Nei M, Tajima F, Tateno Y (1983) Accuracy of estimated phylogenetic trees from molecular data. J Mol Evol 19: 153–170.
35. Goudet J (2002) FSTAT, a program to estimate and test gene diversities and fixation indices (version 2.9.3.2). Available: http://www2.unil.ch/popgen/ softwares/fstat.htm. Accessed 2012 March 15.
36. Weir BS, Cockerham CC (1984) Estimating F-Statistics for the Analysis of Population Structure. Evolution 38: 1358–1370.
37. Rice WR (1989) Analyzing s of statistical test. Evolution 43(1): 223–225. 38. Cornuet JM, Luikart G (1996) Description and power analysis of two tests for
detecting recent population bottlenecks from allele frequency data. Genetics 144: 2001–2014.
39. Nei M, Maruyama T, Chakraborty R (1975) The bottleneck effect and genetic variability in populations. Evolution 29: 1–10.
40. Maruyama T, Fuerst PA (1985) population bottlenecks and nonequilibrium models in population genetics. 2. Number of alleles in a small population that was formed by a recent bottleneck. Genetics 111: 675–689.
41. Peakall R, Smouse PE (2006) GENALEX 6: genetic analysis in Excel. Population genetic software for teaching and research. Mol Ecol Notes 6: 288–295.
42. Mantel N (1967) Detection of disease clustering and generalized regression approach. Cancer Res 27: 209–220.
43. Rousset F (1997) Genetic differentiation and estimation of gene flow from F-statistics under isolation by distance. Genetics 145: 1219–1228.
44. Slatkin M (1995) A measure of population subdivision based on microsatellite allele frequencies. Genetics 139: 457–462.
45. Excoffier L, Laval G, Schneider S (2005) Arlequin ver. 3.0: An integrated software package for population genetics data analysis. Evolutionary Bioinfor-matics Online 1: 47–50.
46. Pritchard JK, Stephens M, Donnelly P (2000) Inferernce of population structure using multilocus genotype data. Genetics 155: 945–959.
47. Evanno G, Regnaut S, Goudet J (2005) Detecting the number of clusters of individuals using the software STRUCTURE: a simulation study. Mol Ecol 14: 2611–2620.
48. Liu K, Muse SV (2005) PowerMarker: Integrated analysis environment for genetic marker data. Bioinformatics 21: 2128–2129.
49. Monmonier M (1973) Maximum-difference barriers: an alternative numerical regionalization method. Geogr Anal 3: 245–61.
50. Manni F, Guerard E, Herer E (2004) Geographic patterns of (genetic, morphologic, linguistic) variation: how barriers can be detected by ‘‘Mon-monier’s algorithm’’. Hum Biol 76: 173–190.
51. Dieringer D, Schlo¨tterer C (2003) Microsatellite analyser (MSA): a platform independent analysis tool for large microsatellite data sets. Mol Ecol Notes 3(1): 167–169.
52. Meng L, Zheng GS (2004) Phylogenetic relationship analysis among Chinese wild species and cultivars ofPaeoniasect.Moutanusing RAPD markers. Scientia Silvae Sinicae 40: 110–115.
53. Pei YL, Zou Y, Yin Z, Wang XQ, Zhang ZX, Hong DY (1995) Preliminary report of RAPD analysis inPaeonia suffruticosasubsp.spontaneaandPaeonia rockii. Acta Phototax Sin 33: 350–356.
54. Zou YP, Cai ML, Wang ZP (1999) Systemic studies onPaeoniasect.MoudanDC, based on RAPD analysis. Acta Phytotax Sin 37: 220–227.
55. Hartl DL, Clark AG Principles of Population Genetics, Sinauer Associates, Sunderland, Mass.
56. Chapuis M-P, Estoup A (2007) Microsatellite Null Alleles and Estimation of Population Differentiation. Mol Biol Evol 24(3): 621–631.
57. Cheng FY, Li JJ, Chen DZ, Zhang ZS Chinese Flare Tree Peonies, Chinese Forestry Publishing House, Beijing.
58. Liu JH, Zhang PZ, Zheng DW, Wang JL, Wang WT (2010) The cooling history of Cenozoic exhumation and uplift of Taibai Mountain, Qinling, China: evidence from the apatite fission track (AFT) analysis. Chinese J Geophys 53(10): 2405–2414.
59. Wang Y, Yan JP (2011) Evolution of the Qinling Mountain and the impact factors. J Northwest University (Natural Science Edition) 41(1): 163–169. 60. Sang T, Crawford DJ, Stuessy TF (1997) Chloroplast DNA phylogeny, reticulate
evolution, and biogeography of Paeonia (Paeoniaceae). Am J Bot 84(9): 1120–1136.
61. Jing XM, Zheng GH (1999) The characteristics in seed germination and dormancy of four wild species of tree peonies and their bearing on endangerment. Acta Phytophysio Sin 25: 214–221.
62. Angers B, Bernatchez L (1998) Combined use of SMM and non-SMM methods to infer fine structure and evolutionary history of closely related brook charr (Salvelinus fontinalis, Salmonidae) populations from microsatellites. Mol Bio Evol 15: 143–159.
63. Paetkau D, Waits LP, Clarkson PL, Craighead L, Strobech C (1997) An empirical evaluation of genetic distance statistics using microsatellite data from bear (Ursidae) populations. Genetics 147: 1943–1957.
64. Richard M, Thorpe RS (2001) Can microsatellites be used to infer phylogenies? Evidence from population affinities of the Western Canary island lizard (Gallotia galloti). Mol Phylogenet Evol 20: 351–360.
65. Schwarzbach AE, Rieseberg H (2002) Likely multiple origins of a diploid hybrid sunflower species. Mol Ecol 11: 1703–1715.