AbstrAct:Objective: To compare the sensitivity and speciicity of body mass index (BMI)-based classiication systems and to determine the optimal cut-ofs for predicting excess body fatness in schoolchildren. Methods: 2795 schoolchildren aged 7 – 10 years were examined. Excess body fatness was deined as the standardized residuals of the sum of three skinfold thickness ranking at or above the 90th percentile. The international BMI-based system recommended by the World Health Organization (WHO-2007) was evaluated on the basis of its sensitivity and speciicity for detecting excess body fatness and compared with a national BMI reference (Brazil-2006). Likelihood ratios analysis was used to select the optimal cut-ofs in each curve. Results: The two classiication systems presented high sensitivity (92.5 – 98.6%) and moderate speciicity (75.9 – 85.0%) for both sexes. The optimal BMI cut-ofs improved speciicity with no marked loss of sensitivity. Using the proposed BMI cut-ofs, the post-test probability of predicting excess body fatness for children classiied as non-overweight decreased from 10 (pre-test probability) to 1.4% in girls and to 1.1% in boys. For overweight children, this probability increased to more than 46.0%.
Conclusion: The results showed that both the WHO-2007 and Brazil-2006 classiication systems can be used as screening instruments for excess body fatness, and that one of the limitations of using the BMI-for-age references could be improved by reining the existing cut-ofs.
Keywords: Body Mass Index. Adiposity. Children. Sensitivity. Speciicity. Likelihood ratio analysis.
Performance of references based on body
mass index for detecting excess body fatness
in schoolchildren aged 7 to10 years
Desempenho de referências baseadas no índice de massa corporal para a
detecção do excesso de gordura corporal em escolares de 7 a 10 anos de idade
Danielle Biazzi LealI, Maria Alice Altenburg de AssisI,II, Wolney Lisboa CondeIII, France BellisleIV
IPostgraduate Program in Physical Education, Universidade Federal de Santa Catarina – Florianópolis (SC), Brazil. IIPostgraduate Program in Nutrition, Universidade Federal de Santa Catarina – Florianópolis (SC), Brazil. IIIDepartment of Nutrition, School of Public Health, Universidade de São Paulo – São Paulo (SP), Brazil. IVCRNH Ile-de-France, INRA, SMBH Universite´ Paris13 – Paris, France.
Corresponding author: Corresponding author: Maria Alice Altenburg de Assis. Department of Nutrition. Campus da Trindade. Universidade Federal de Santa Catarina. CEP: 88010-979, Florianopolis, SC, Brazil. Email: [email protected]
IntroductIon
Over the last decade there has been a steady increase in the number of studies on the diagnostic accuracy of age- and sex-speciic body mass index (BMI) references for children and adolescents1.
Most of these studies have used the International Obesity Task Force (IOTF)2 approach vs. national
reference data to identify children and adolescents with excess body fatness3-8. The recently
updated World Health Organization (WHO-2007) BMI reference9 for children and adolescents
aged 5 to 19 years has been recommended as an international reference and is being adopted by countries concerned with the growing problem of childhood obesity. However, only a few studies have evaluated its performance in detecting excess body fatness7,10.
In the absence of a “gold standard” to measure body fat content, such as the multi-component models, studies have typically used an indirect method (e.g. bioimpedance, skinfolds), and defined a proportion of participants as excessively fat on the basis of these measurements1. Subsequently, estimation is made of the extent to which the
optimal cut-off points in the BMI-for-age distribution classified such children correctly. Previous studies on diagnostic accuracy of BMI used summary statistics, such as sensitivity and speciicity, area under the curve3,5-8,10-12, and likelihood ratio (LR) analysis5,10,13.
resumO:Objetivo: Comparar a sensibilidade e especiicidade de sistemas de classiicação baseados no índice de massa corporal (IMC) e determinar os melhores pontos de corte na predição do excesso de gordura corporal em escolares. Métodos: 2795 escolares com idade entre 7 a 10 anos foram examinados. O excesso de gordura corporal foi deinido como os resíduos padronizados do somatório de três dobras cutâneas iguais ou superiores ao percentil 90. O sistema internacional baseado no IMC, recomendado pela Organização Mundial de Saúde (OMS-2007), foi avaliado com base em sua sensibilidade e especiicidade para detecção do excesso de gordura corporal e comparado com uma referência do IMC nacional (Brasil-2006). A análise da razão de verossimilhança foi usada para selecionar os melhores pontos de corte em cada curva. Resultados: Os dois sistemas de classiicação apresentaram alta sensibilidade (92,5 – 98,6%) e moderada especiicidade (75,9 – 85,0%) para ambos os sexos. Os ótimos pontos de corte melhoraram a especiicidade sem perda acentuada da sensibilidade. Usando os pontos de corte propostos, a probabilidade pós-teste de predizer o excesso de gordura corporal para crianças classiicadas sem excesso de peso diminuiu de 10% (probabilidade pré-teste) para 1,4% em meninas e para 1,1% em meninos. Para crianças classiicadas com excesso de peso, essa probabilidade aumentou para mais de 46,0%, em ambos os sexos. Conclusão: Os resultados mostraram que ambos os sistemas de classiicação, OMS-2007 e Brasil-2006, podem ser usados como instrumentos de rastreio do excesso de gordura corporal. As limitações do uso de referências do IMC-para-idade podem ser melhoradas pelo reinamento dos pontos de corte existentes.
In the majority of the studies a signiicantly higher sensitivity was reported using national reference data than when using the IOTF3-7 or the WHO-2007 approach7, and the reverse
for speciicity3,6,7. Other studies reported similar values of speciicity between the IOTF and
national BMI reference data4,5.
In light of the recommendations made in recent guidelines for using BMI national reference data on the management of obesity in youth14,15, this study evaluates the performance of the
last age- and sex-speciic BMI reference values proposed for Brazilian children and adolescents (Brazil-2006)16, against excess body fatness in a representative sample of schoolchildren from
Florianópolis. In addition to the comparison of sensitivity and speciicity of the Brazil-2006 with that of the WHO-2007, a LR analysis was performed to select the optimal cut-ofs for classifying children as overweight (including obesity) according to WHO-2007 and Brazil-2006 BMI reference curves, allowing the calculation of the post-test probabilities of excess body fatness.
MEtHodoLoGY
SubjectS
Data were extracted from the database of a cross-sectional epidemiological study17 which
reported the prevalence of overweight and obesity in Florianopolis’ schoolchildren in 2002. Florianopolis is the capital of the province of Santa Catarina, in the south of Brazil. The city has a total area of 433 km2; its demographic density is 760 hab/km2. At the time this study
was conducted, the population was 369,102 inhabitants (urban 94.1%), life expectancy at birth was 72.8 years, and infant mortality rate was 18.5/1000 live births18,19.
Sample size was calculated considering 10% overweight prevalence20 and 95% conidence
limits. The sampling error was 2.0 and the design efect 2%. The reference population consisted of students enrolled in public and private elementary schools. The study population was selected using a stratiied cluster sampling design. The study was conducted from September to November 2002. Public and private elementary schools were irst stratiied by geographic area and then randomly selected from a list of schools within each area, with probability weight proportional to the size of the school. Of 122 schools (44 private and 78 public), 16 were selected (nine public and seven private). In each school selected, all classes were included and all the children attending the irst four grades were invited to participate, but only 7 to 10-year-old children were included in this study. Elementary school is obligatory in Florianopolis and nearly all 7 to 10-year-old children attend the irst four years of school.
Post hoc analysis to estimate power for diagnostic accuracy parameters was calculated using the lowest overweight prevalence of 22.7% according to WHO-2007 BMI reference (Table 1), an expected value of 90% for sensitivity/speciicity as the mid-point of their range between 85 and 95% in Brazil-2006 BMI reference (Table 2), and 5% error for minimal acceptable lower conidence limit21. This method estimated 474 and 1614 children with and
Prior to the data collection the informed consent form was delivered to the school, along with a letter addressed to parents with information about the survey, data to be collected, and assurance that it would not present any risks. Information included anthropometric data (height, weight, skinfolds and arm, waist and hip circumferences) and sociodemographic status of the family. This study addresses the children’s measurements of height, weight, and thickness of three skinfolds (triceps, subscapular, and the median calf ).
Children who were absent on the days of data collection or who returned the sociodemographic questionnaire with missing information were contacted at the end of the research by phone and by their school teacher putting reminders in the child’s notebook, trying to schedule a new date to collect the information. Of the 3522 children attending the irst four grades of elementary school, 209 were excluded because they were not in
Variables Girls (n = 1341)
Mean (95%CI)
Boys (n = 1454)
Mean (95%CI) p-value
Age (years) 8.51 (8.45 – 8.57) 8.54 (8.48 – 8.60) 0.426*
Weight (kg) 30.3 (29.9 – 30.7) 31.3 (30.9 – 31.7) < 0.001*
Height (cm) 133.2 (132.7 – 133.7) 134.0 (133.6 – 134.5) 0.010**
BMI (kg/m2) 16.9 (16.8 – 17.0) 17.2 (17.1 – 17.4) < 0.001*
Sum of skinfolds (mm) 31.5 (30.9 – 32.1) 27.6 (27.0 – 28.3) < 0.001*
Overweight (including obesity) % (95%CI) p-value
WHO-2007 22.7 (20.5 – 25.0) 31.6 (29.2 – 34.0) < 0.001***
Brazil-2006 25.7 (23.3 – 28.0) 23.6 (21.4 – 25.8) 0.218***
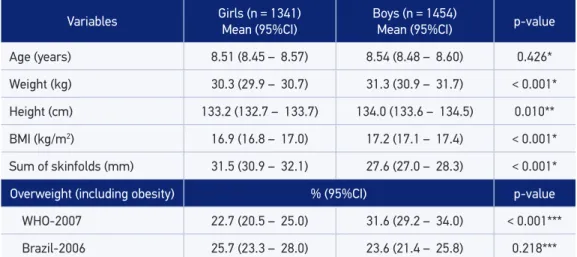
Table 1. Anthropometric measurements and frequencies of overweight using two body mass index deinitions among 2795 schoolchildren in Florianópolis, 2002.
BMI: body mass index; WHO: World Health Organization; *Student’s t-test for equal variances; **Student’s t-test for une
-qual variances; ***χ2 test.
Table 2. Sensitivity and speciicity for excess body fatness according to body mass index-based references.
WHO: World Health Organization; Sen: sensitivity; Spe: speciicity.
WHO-2007 Brazil-2006
Sen (95%CI) Spe (95%CI) Sen (95%CI) Spe (95%CI)
Girls
92.5 (88.1 – 97.0) 85.0 (83.0 – 87.0) 94.8 (91.0 – 98.5) 82.0 (79.9 – 84.2)
Boys
the age range of the protocol (< 7.0 or > 10.0 years old), and 377 because of missing data (170 children absent or ill; 207 parents or children refused to participate).
Parents gave a written consent for their child’s participation in this study, which received approval from the Committee on Human Studies of the Federal University of Santa Catarina (Protocol nº 037/02).
Anthropometric measurement
The administrative department of each school provided information on the children’s age and gender. The BMI and the sum of three skinfold thickness (SFT) measurements were selected to assess the nutritional status of the participants. Anthropometry was performed in each school by two trained physical education teachers. Theoretical and practical workshops on measurement technique were held in order to standardize the anthropometric measurements. Measurements of the weight, height, and SFT of participants were taken, following the standard techniques recommended by Lohman et al.22. Anthropometric
measurements were taken in lightly-dressed children, without shoes. Weight was measured with a digital-solar 180 kg scale (Marte®, model PP) and height was measured using a metric
tape ixed to a wall without a baseboard. The BMI was computed as weight in kilograms divided by height in meters squared.
SFTs were measured at three regional body sites: triceps, subscapular, and the median calf using a skinfold caliper (Cescorf®, scientiic sports equipment, Porto Alegre, RS, Brazil)
over the right side of the body. The measurements were done in duplicate and a third measurement was performed if the duplicates difered by more than 1 mm. The average of two readings at each site or of the two nearest readings was used for analysis.
Statistical analysis
The subjects were classiied as overweight (including obesity) according to two BMI-based classiication systems: WHO-2007 and Brazil-2006. Both references have summarized the weight/height ratio, constructed as BMI, in three independent parameters: L (power in the Box Cox transformation), M (median), and S (coeicient of variation)23. Using
the equation:
C = M[1+(LSZ)]^1/L
it is possible to estimate any centile of a reference distribution9,16. The BMI-for-age
Z-scores were calculated based on the following equation:
In both curves the BMI critical values for classifying nutritional status as overweight were expressed as centiles and Z-scores equivalent to 25 kg/m² in adults. Using Brazil-2006 curves, those values corresponded to + 1.2 Z for girls and + 1.32 Z for boys. Using the WHO-2007, those values corresponded to + 1 Z.
Due to the importance of age in body fat variation, the sum of SFT values was modeled as a polynomial function of age in linear regression models. Using the model with the highest Pearson coeicient, the standardized residual for each sex was estimated (skinfolds variation independent of the linear age efect). Values exceeding ± 4 standard deviations of the standardized residual values were excluded (50 boys, 91 girls) because they were considered as outliers. The unconventional value ± 4 deviations has been chosen to preserve, as much as possible, the sample heterogeneity. These standardized residuals were then converted into percentiles. In this way, subjects were efectively ranked according to their Z-score. The sum of SFT (standardized residuals) ranking at or above the 90th percentile was adopted as the reference standard for the evaluation of excess body fatness. Currently, no skinfold cut-ofs for deining excess body fatness in children have been internationally accepted. In this study the arbitrary cut-of of the sum of skinfolds ranking at or above the 90th percentile, by sex and age group, has been adopted as the deinition for excess body fatness. This percentile was chosen as a conventional cut-of in clinical terms to ensure adequate numbers for statistical analysis, and to account for typical high-adiposity individuals maintaining some variability among them, which cannot be reached with the choice of the 95th percentile.
The sensitivity and speciicity analysis were performed using the 85th, 90th, and 95th percentiles
of the sum of SFT as the standard reference and BMI cut-ofs as the diagnostic test (data not shown). Although there were no signiicant diferences for both sensitivity and speciicity values between the three critical values for excess body fatness, the 90th percentile presented the best
compromise between sensitivity and speciicity rates for both BMI references. Furthermore, we believe that a child with the sum of SFT greater than or equal to the 90th percentile should be identiied as having excess body fatness because even this degree of adiposity was associated with adverse levels of cardiovascular disease risk factors24.
Sensitivity was deined as the percentage of children with excess body fatness (children in the top 10% of the body fatness distribution based on SFT-standardized residuals) classiied as overweight by BMI. Speciicity was deined as the percentage of children without excess body fatness (children not in the top 10% of the body fatness distribution based on SFT-standardized residuals) classiied as non-overweight by BMI.
LR analysis stratiied by sex was used to determine the optimal cut-ofs of WHO-2007 and Brazil-2006 Z-score curves with the highest accuracy for detection of excess body fatness in each sex. LR states how many times more likely the particular test results are in patients with excess body fatness than in those without excess body fatness. Positive LRs [sensitivity/(1 − speciicity)] above 10 and negative LRs [(1 − sensitivity)/speciicity] below 0.1 have been noted as providing convincing diagnostic evidence, whereas those above 5 and below 0.2 give strong diagnostic evidence25. Thus, in this study the optimal BMI
The probability of excess body fatness in children identified as non-overweight or overweight (including obesity), according to the WHO-2007 and Brazil-2006 optimal BMI cut-ofs, was computed by means of Bayes’ theorem, where
post-test odds = pre-test odds × LR (LR+ and LR−) and pre-test odds = prevalence/1 − prevalence.
In clinical practice, it is essential to know how a particular test result predicts the risk of abnormality26. For the calculation of the pre-test odds, the prevalence of excess body fatness
based on the 90th percentile of the sum of SFT (standardized residuals) of the sample itself was used. Finally, the post-test odds wereconverted into probabilities: post-test probability = post-test odds/1 + post-test results.
The signiicance level was set at p < 0.05. Statistical analyses were performed with SPSS version 10.0 (Statistical Package for Social Sciences, Chicago, IL, USA) and STATA version 10.0 (Stata Corporation, College Station, TX, USA).
rEsuLts
The inal analytical population consisted of 2795 schoolchildren (48% girls). Table 1 shows the subjects characteristics and the prevalence of overweight (including obesity) according to the WHO-2007 and Brazil-2006 BMI references, stratiied by sex. Compared to the girls, the boys were signiicantly taller, heavier, and presented higher mean BMI. The girls had a signiicantly higher mean sum of SFT than the boys. According to the WHO-2007 reference, the boys were signiicantly more likely than their female counterparts to be overweight. No signiicant diferences between the sexes were observed for overweight prevalence according to the Brazil-2006 BMI references.
Table 2 compares the sensitivity and specificity of BMI cut-offs for overweight (including obesity) from WHO-2007 and Brazil-2006 references in detecting excess body fatness in children defined by the sum of SFT (standardized residuals) ranking at or above the 90th percentile as the standard reference. The WHO-2007 classification showed significant statistical differences between genders for specificity values. In contrast, there were no significant differences in either sensitivity and specificity between girls and boys when the Brazil-2006 classification was used. In the case of boys, a significant statistical difference in the specificity rate was found between the WHO-2007 and Brazil-2006 references.
Z-score LR+ LR− Sen (%) Spe (%) P
Girls
WHO-2007 1.00 6.21 0.09 92.5 85.1 84
WHO-2007 optimal BMI cut-of† 1.12 7.87 0.13 88.1 88.8 87
Brazil-2006 1.02 5.25 0.06 94.8 81.9 85
Brazil-2006 optimal BMI cut-of† 1.28 7.99 0.13 88.1 89.0 90
Boys
WHO-2007 1.00 4.09 0.02 98.6 75.9 84
WHO-2007 optimal BMI cut-of† 1.61 10.01 0.10 91.0 90.9 95
Brazil-2006 1.32 5.97 0.07 94.5 84.2 91
Brazil-2006 optimal BMI cut-of† 1.60 9.93 0.10 91.0 90.8 95
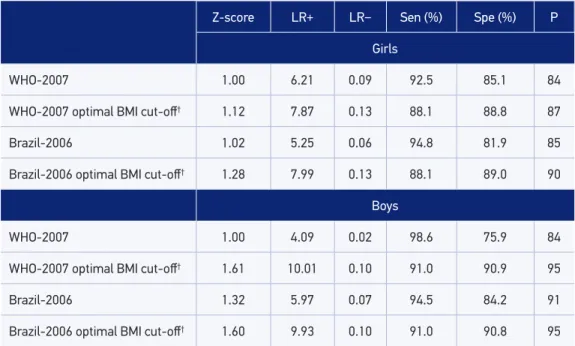
Table 3. Performance of the reference values and the proposed cut-ofs for body mass index-based criteria to screen for excess body fatness.*
WHO: World Health Organization; LR: likelihood ratio; Sen: sensitivity; Spe: speciicity; P: percentile; *Standardized
residuals ranking at/or above the 90th percentile of the sum of skinfolds; †The optimal cut-offs for BMI Z-values,
derived by likelihood ratio analysis.
percentiles. For both sexes, the optimal BMI cut-ofs were higher than both the WHO-2007 and Brazil-2006 BMI Z-values for overweight. For example, with the use of the optimal BMI cut-of, a girl with excess body fatness would be 7.87 times (using WHO-2007 BMI curves) or 7.99 times (using Brazil-2006 BMI curves) as likely as a girl without excess body fatness to be classiied as overweight. On the other hand, a girl without excess body fatness would be only 0.13 times (using both, WHO-2007 or Brazil-2006 BMI curves) as likely to be classiied as overweight. Using the optimal BMI cut-ofs, a boy with excess body fatness would be 10.01 times (using WHO-2007 BMI curves) or 9.93 times (using Brazil-2006 BMI curves) as likely as a boy without excess body fatness to be classiied as overweight, whereas a boy without excess body fatness would be only 0.10 times (using WHO-2007 or Brazil-2006 BMI curves) as likely to be classiied as overweight.
Brazil-2006 optimal BMI cut-ofs), the child’s probability of having excess body fatness increased to 50.0% for boys and 46.0% for girls. The negative and positive post-test probabilities of excess body fatness in schoolchildren diagnosed as non-overweight or overweight according to the existing BMI Z-values from the WHO-2007 and Brazil-2006 references were lower than using the optimal BMI cut-ofs. When data from non-overweight children were assessed, both BMI reference values produced similar results to the optimal BMI cut-ofs for the negative post-test probability of excess body fatness. On the other hand, in the detection of positive cases the changes obtained with the use of optimal BMI cut-ofs were signiicant. For girls, the positive post-test probability of excess body fatness using the WHO-2007 and Brazil-2006 optimal BMI cut-ofs increased 1.14 and 1.27 times, respectively, compared to BMI reference values. For boys, the reinement of the WHO-2007 optimal BMI cut-of was higher than the Brazil-2006 optimal BMI cut-of (1.69 versus 1.31 times).
dIscussIon
The main indings of this study were that, in terms of both sensitivity and speciicity, both BMI-based references performed well in detecting excess body fatness in 7 to 10-year-old
Table 4. Post-test probability of excess body fatness in 2795 schoolchildren diagnosed as non-overweight or overweight according to the reference values and WHO-2007 and Brazil-2006 optimal cut-offs.
WHO: World Health Organization; *Negative post-test probability: probability of excess body fatness with diagnosis of non-overweight by BMI; Positive post-test probability: probability of excess body fatness with diagnosis of overweight by BMI; †The optimal cut-ofs for BMI Z-values, derived by likelihood ratio analysis.
Post-test probability of excess body fatness*
Negative (%) Positive (%)
Girls
WHO-2007 1.0 40.6
WHO-2007optimal cut-of† 1.4 46.4
Brazil-2006 0.7 36.6
Brazil-2006 optimal cut-of† 1.4 46.8
Boys
WHO-2007 0.2 31.0
WHO-2007optimal cut-of† 1.1 52.4
Brazil-2006 0.8 39.6
schoolchildren. In addition, once the optimal cut-ofs for each BMI reference curve had been selected, the Brazil-2006 reference showed superior performance in the positive post-test probability for girls, and the WHO-2007 reference for boys. The optimal BMI cut-ofs were higher than the BMI Z-scores recommended by the WHO-2007 and Brazil-2006 references for the diagnosis of overweight.
In order to define obesity, it is necessary to decide upon both a suitable measure of body fat and a suitable cut-off. Due to its association with body composition and risk factors, as well as to the widespread availability of measurements, the BMI has been largely accepted as a valid indirect measure of adiposity in children. Consequently, grades of nutritional status are commonly assessed by way of a reference population27.
Reference curves serve as an “empirical health model”, and can be used to assess the nutritional status of an individual or a population, for both calculation either for comparing to a reference population or for diagnosis in order to identify healthy and unhealthy individuals.
Most studies that evaluated the performance of recommended BMI cut-off values of the reference system based their comparisons on estimates of sensitivity and specificity3-13. In this study the above-mentioned measures were used to compare the
two classification systems, whereas the LR estimation was used to select the optimal cut-offs in each curve, allowing the calculation of the post-test probabilities for each BMI reference. The comparison of the obtained results with those of other studies is limited because of differences in age of the children, methods to measure body fat content, the reference standard and the definition of cut-off values for the evaluation of excess body fatness, as well as the analytical approaches for data analysis.
By way of comparison, we screened the literature to identify studies reporting sensitivity and specificity values of BMI which used the same two references as those used here, and conducted in populations with similar age ranges to our study. In general, the sensitivity obtained for WHO-2007 (98.6% for boys and 92.5% for girls) and Brazil-2006 (94.5% for boys and 94.8% for girls) classifications in this study were higher than those reported in previous studies. In Brazil, the performance of three BMI-based classification systems was analyzed (IOTF, WHO-2007, and Brazil-2006) in 1570 schoolchildren aged 7 to 12 years from the city of Paraíba. The sensitivities and specificties using the percentage of body fatness as reference criteria (estimated from SFT measurements) for WHO-2007 were 64.7 and 97.9% in boys; 47.7 and 97.8% in girls and using the Brazil-2006 classification the values were 90.6 and 92.0% in boys; 97.2 and 84.8% in girls7. In a sample of 10 to 19-year-old Brazilian adolescents4, the
Brazil-2006 classification for overweight using percentage of body fatness (estimated by bioelectric impedance) as the reference standard were 95.2 and 75.6% for boys; 86.8 and 88.0% for girls, respectively6. In 6991 Singaporean adolescents aged 12 to
18 years, the sensitivities and specificities of WHO-2007 criteria using the top 5% of body fatness (estimated by four skinfolds measurements) as the reference standard were 69.4 and 95.0% for boys; 53.0 and 98.1% for girls, respectively10.
The present study found small differences in values of specificities between boys and girls (but only for WHO-2007 reference), whereas the BMI classification systems analyzed by other studies showed, in general, better sensitivity for boys and better specificity for girls4–6,10,13. A systematic review study1 showed higher values of sensitivity
and similar values of specificity for obesity definition when a national reference data was compared to the IOTF approach. In addition the authors pointed out that no statically significant results for sensitivity and specificity were identified between sexes. The optimal BMI cut-offs to correctly classify children according to their excess body fatness found in the present study were higher than those recommended by the WHO-2007 and Brazil-2006 references for the diagnosis of overweight. They were chosen firstly as a result of the strong relationship between true-positive vs false-positive cases (tests with high LR+ values give very strong evidence for the diagnosis when positive) and secondly, due to a low frequency of false-negative cases (tests with low LR− values are best for ruling out disease). Since the essence of this work is screening, i.e. ruling out disease, LR− values are very important. However, the optimal cut-offs showed both LR+ and LR− values with moderate diagnostic evidence, which would be considered adequate for public health interventions. Thus, the performance of derived cut-offs justifies the loss in sensitivity imposed by the higher cut-off.
Previous studies used LR analysis to compare the performance of the recommended BMI cut-off values5,10,13. However, if a test is intrinsically dichotomous, the results may
be reported in terms of either sensitivity and specificity, or LR+ and LR−, because there are no important advantages of LR in this case28. When test results are measured
on a continuous scale (e.g. BMI Z-scores) LR can be estimated for a series of test result intervals. In this study the use of the LR analysis allowed us to make use of the information contained in the test and achieve a fine-tuning of optimal BMI cut-offs for the diagnosis of overweight in each curve.
Computing post-test odds after a series of diagnostic tests is much easier than using the sensitivity/specificity method29. It is an alternative method that could be used for
additional information beyond the BMI criteria; for example, if we have LR values for other diagnostic tests, such as cardiovascular risk markers.
Among the relevant aspects of this study, the large sample size and the use of the LR and post-test probability analysis should be highlighted, both of which go beyond sensitivity and specificity. It should also be mentioned that there was no use of any sophisticated measurement reference for body fatness due to the fact that this is a population-based study. The absolute measurement of SFT, despite the low reproducibility reported by other studies, is not based on reference models used to estimate the body fat percentage through predictive equations, as these are susceptible to errors30,31. Furthermore, the use of standardized residuals of the SFT
rendered the variable independent of the linear effect of age in the variation of body fat. The measurement of SFT has been used in other studies of the BMI diagnostic performance as the reference measure7,10,12. A limitation of this study relates to the
lack of assessment of the technical error of measurement by the anthropometrists in the original project, as the reliability of the SFT measurement can be affected by inter- and intra-observer variabilities. Information about technical error of measurement could more effectively assess the reliability of anthropometric measures taken. However, the rigorous elimination of outliers values, was specifically aimed at preventing such problems.
The results of this study refer to children from Florianópolis aged 7 to 10 years. Further studies of this nature could be conducted in other Brazilian states to refine the debate on the use of national and international references based on BMI to classify children according to nutritional status. It is also suggested that these studies should be conducted with the purpose of stimulating review of the critical BMI values in the reference Brazil-2006.
Based on the results of the present study, in terms of clinical practice and public health programs, both the WHO-2007 and the Brazil-2006 BMI classification systems can be used as screening instruments. When the general data presented by this study are analyzed, we cannot indicate the superiority of a determined BMI reference, because the performances of the curves to correctly identify children with or without excess body fatness were similar. At the national level, given the probable population differences in relative risks at certain BMI values, the Brazilian BMI-based reference is likely to be more suitable. One of the limitations of using the age- and sex-specific BMI references for classifying children as overweight can be minimized by choosing the appropriate cut-offs (chosen for increased accuracy in detecting excess body fatness).
1. Reilly JJ, Kelly J, Wilson DC. Accuracy of simple clinical and epidemiological deinitions of childhood obesity: systematic review and evidence appraisal. Obes Rev 2010; 11(9): 645-55.
2. Cole TJ, Bellizzi MC, Flegal KM, Dietz WH. Establishing a standard deinition for child overweight and obesity worldwide: international survey. BMJ 2000; 320(7244): 1240-3.
3. Vieira ACR, Alvarez MM, Marins VMR, Sichieri R, Veiga GV. Accuracy of different body mass index reference values to predict body fat in adolescents. Cad Saude Publica 2006; 22(8): 1681-90.
4. Vitolo MR, Campagnolo PDB, Barros ME, Gama CM, Lopez FA. Evaluation of two classiications for overweight among Brazilian adolescents. Rev Saude Publica 2007; 41(4): 653-6.
5. Neovius MG, Linné YM, Barkeling BS, Rossner SO. Sensitivity and speciicity of classiication systems for fatness in adolescents. Am J Clin Nutr 2004; 80(3): 597-603.
6. Fernandes RA, Rosa CSC, da Silva CB, Bueno DR, de Oliveira AR, Júnior IFF. Desempenho de diferentes valores críticos de índice de massa corporal na identiicação de excesso de gordura corporal e obesidade abdominal em adolescentes. Rev Assoc Med Bras 2007; 53(6): 515-9.
7. Silva KS, Lopes AS, Silva FM. Sensitivity and speciicity of diferent classiication criteria for excess weight in schoolchildren from João Pessoa, Paraíba, Brazil. Rev Nutr 2010; 23(1): 27-35.
8. Gläßer N, Zellner K, Kromeyer-Hauschild K. Validity of body mass index and waist circumference to detect excess fat mass in children aged 7-14 years. Eur J Clin Nutr 2011; 65(2): 151-9.
9. de Onis M, Onyango AW, Borghi E, Siyam A, Nishida C, Siekmann J. Development of a WHO growth reference for school-aged children and adolescents. Bull World Health Organ 2007; 85(9): 660-7. 10. Deurenberg-Yap M, Niti M, Foo LL, Ng SA, Loke
KY. Diagnostic accuracy of anthropometric indices for obesity screening among Asian adolescents. Ann Acad Med Singapore 2009; 38(1): 3-8.
11. Moreno LA, Blay MG, Rodríguez G, Blay VA, Mesana MI, Olivares JL, et al. Screening performances of the International Obesity Task Force body mass index cut-of values in adolescents. J Am Coll Nutr 2006; 25(5): 403-8.
12. Zimmermann MB, Gübeli C, Püntener C, Molinari L. Detection of overweight and obesity in a national sample of 6–12-y-old Swiss children: accuracy and
validity of reference values for body mass index from the US Centers for Disease Control and Prevention and the International Obesity Task Force. Am J Clin Nutr 2004; 79(5): 838-43.
13. Nichols SD, Cadogan F. BMI-based obesity cut-ofs and excess adiposity in a Caribbean adolescent population of African origin. Eur J Clin Nutr 2009; 63(2): 253-8. 14. August GP, Caprio S, Fennoy I, Freemark M, Kaufman
FR, Lustig RH, et al. Prevention and treatment of pediatric obesity: an endocrine society clinical practice guideline based on expert opinion. J Clin Endocrinol Metab 2008; 93(12): 4576-99.
15. Tomkins A. Measuring obesity in children: what standards to use? J Pediatr 2006; 82(4): 246-8. 16. Conde WL, Monteiro CA. Body mass index cutof
points for evaluation of nutritional status in Brazilian children and adolescents. J Pediatr 2006; 82(4): 266-72. 17. de Assis MA, Rolland-Cachera MF, Grosseman S,
Vasconcelos FA, Luna ME, Calvo MC, et al. Obesity, overweight and thinness in schoolchildren of the city of Florianópolis, Southern Brazil. Eur J Clin Nutr 2005; 59(9): 1015-21.
18. IBGE (2002): Diretoria de Pesquisas, Coordenação de População e Indicadores Sociais, Pesquisa Nacional por Amostra de Domicílios, 2002. Available from: www.ibge.br
19. IPEA (2002) Instituto de Pesquisas Econômicas Aplicadas. Atlas de Desenvolvimento Humano Nota do IPEA sobre o Relatório do Desenvolvimento Humano 2002. Brasília: IPEA.
20. Abrantes MM, Lamounier JA, Colosimo EA. Overweight and obesity prevalence in Northeast and Southeast regions of Brazil. Rev Assoc Med Bras 2003; 49(2): 162-6. 21. Flahault A, Cadilhac M, Thomas G. Sample size
calculation should be performed for design accuracy in diagnostic test studies. J Clin Epidemiology 2005; 58(8): 859-62.
22. Lohman TG, Roche AF, Martorell R. Anthropometric standardization reference manual. Champaign, IL: Human Kinetics; 1988.
23. Cole TJ. The LMS method for constructing normalized growth standards. Eur J Clin Nutr 1990; 44(1): 45-60. 24. Freedman DS, Katzmarzyk PT, Dietz WH, Srinivasan SR, Berenson GS. Relation of body mass index and skinfold thicknesses to cardiovascular disease risk factors in children: the Bogalusa Heart Study. Am J Clin Nutr 2009; 90(1): 210-6.
25. Deeks JJ. Systematic reviews in health care: systematic reviews of evaluations of diagnostic and screening tests. BMJ 2001; 323(7305): 157-62.
26. Deeks JJ, Altman DG. Diagnostic tests 4: likelihood ratios. BMJ 2004; 329(7458): 168-9.
27. Rolland-Cachera MF. Childhood obesity: current deinitions and recommendations for their use. Int J Pediatr Obes 2011; 6(5-6): 325-31.
28. Sonis J. How to use and interpret interval likelihood ratios. Fam Med 1999; 31(6): 432-7.
29. Parikh R, Parikh S, Arun E, Thomas R. Likelihood ratios: clinical application in day-to-day practice. Indian J Ophthalmol 2009; 57(3): 217-21.
30. Reilly JJ, Wilson J, Durnin JV. Determination of body composition from skinfold thickness: a validation study. Arch Dis Child 1995; 73(4): 305-10.
31. Roche AF, Siervogel RM, Chumlea WC, Webb P. Grading body fatness from limited anthropometric data. Am J Clin Nutr 1981; 34(12): 2831-8.
Received on: 03/20/2012