Original article
Sarcopenia and cardiovascular risk in physically
active adult and elderly women
Eliane Aparecida de Castro Luciana Moreira Lima Federal University of Viçosa, Brazil
Matheus Santos Cerqueira
Federal Institute of Education, Science and Technology, Brazil
Sebastião Gobbi São Paulo State University, Brazil
Leonice Aparecida Doimo Federal University of Viçosa, Brazil
Abstract—The purpose of this study was to assess the prevalence of sarcopenia and its association with risk factors for cardiovascular diseases (CVD) in non-sedentary women. Study participants were 124 women (control group (CG) n = 33; 24.5 ± 2.9 years and study group (SG) n = 91; 61.9 ± 8.7 years). Anthropometric measurements, blood parameters, body composition (DXA), anthropometric indices and questionnaire answers were analyzed. Sarcopenia was considered as a standard deviation below mean values for young people, corresponding to 7.3 kg/m² and classifying 34.1% of SG as sarcopenic. Prevalence of risk for CVD considered low, moderate and high was 21%, 60% and 19%, respectively. Logistic regression showed no relationship between sarcopenia and risk factors for CVD, except for body mass index as a protection factor. There was a tendency for sarcopenia to assume associations as risk factor for variables smoking, trigly-cerides, obesity, abdominal fat, and Framingham Risk Score and as a protection factor for variable physical activity level.
Keywords: sarcopenia, cardiovascular risk factors, women
Resumo—“Sarcopenia e risco cardiovascular em mulheres adultas e idosas isicamente ativas.” Objetivou-se veriicar a prevalência de sarcopenia e sua associação com fatores de risco para doenças cardiovasculares (DCV) em mulheres
isicamente ativas. Participaram 124 mulheres (Grupos Controle (GC) n = 33; 24,5 ± 2,9 anos e de Estudo (GE) n = 91; 61,9 ± 8,7 anos). Analisaram-se medidas antropométricas, parâmetros sanguíneos, composição corporal (DEXA), índices antropométricos e respostas de questionários. Considerou-se sarcopenia um desvio-padrão abaixo da média para a
popu-lação jovem, correspondendo a 7,3 kg/m², classiicando 34,1% do GE como sarcopênico. Prevalência do risco para DCV
considerando baixo, moderado e alto foi, respectivamente, 21%, 60% e 19%. A regressão logística não mostrou relação
entre sarcopenia e fatores de risco para DCV, exceto para o índice de massa corporal como fator de proteção.
Observou-se tendência da sarcopenia assumir associações como fator de risco nas variáveis tabagismo, triglicerídeos, obesidade, gordura abdominal e Escore de Risco de Framingham e como fator de proteção na variável nível de atividade física.
Palavras-chave: sarcopenia, fatores de risco cardiovascular, mulheres
Resumen—“Sarcopenia y riesgo cardiovascular en mujeres adultas y mayores isicamente activas.” El objetivo fue comprobar la prevalencia de sarcopenia y su relación con factores de riesgo para el desarrollo de enfermedades cardiovasculares (ECV)
en mujeres activas. Participaron 124 mujeres (Grupo Control (GC) n = 33; 24,5 ± 2,9 años y de Estudio (GE) n = 91; 61,9 ± 8,7 años), a las cuales se le realizó: cuestionario, antropometría, análisis bioquímico y densitometría ósea (DEXA). La
sarcopenia fue considerada una desviación estándar por debajo de la media para la población joven, lo que corresponde a 7,3 kg/m², clasiicando 34,1% el GE como sarcopénico. La prevalencia del riesgo para ECV considerando bajo, moderado
y alto riesgo fue respectivamente, 21%, 60% y 19%. La regresión logística no mostró relación entre sarcopenia y factores de riesgo para ECV, excepto para el índice de masa corporal como factor de protección. También se observó que la sarco-penia está asociada a factores de riesgo como tabaquismo, hipertrigliceridemia, obesidad, grasa abdominal y puntuación de riesgo de Framingham. La variable de actividad física se mostró como factor de protección.
Introduction
Sarcopenia is deined as the loss of muscle mass and, conse -quently, reduction in muscle strength during the aging process (Fielding et al., 2011). Cellular, structural, functional, and beha-vioral changes are causes of sarcopenia, which is multifactorial in most cases. Among these changes, the most relevant are contractility mechanism alterations, innervation disorders,
hor-mone depletion, increased inlammatory mediators, decreased
protein intake, and physical inactivity (Scott, Blizzard, Fell, &
Jones, 2011; Silva, Frisoli Júnior, Pinheiro, & Szejnfeld, 2006).
The decline in muscle mass and strength are directly related to increased frailty, dependency, disability and falls (Rexach, 2006; Zong, Chen, & Thompson, 2007), which contribute for
the high mortality rate in elderly subjects (Bunout, de la Maza,
Barrera, Leiva, & Hirsch, 2011), being a public health problem. Moreover, cardiovascular diseases (CVD) are at the top of the list of death causes in adult and elderly individuals. According to the American Hearth Association (Mosca et al., 2011), in the United States, deaths attributed to CVD in women was 54% in 2009. In Brazil, data from the Ministry of Health (Datasus, 2011) show that CVD account for approximately 36% of deaths in women over 40 years of age.
The relationship between sarcopenia, as assessed by Dual -energy X-ray absorptiometry (DXA), and risk factors for CVD has not been widely studied (Sanada et al., 2010), especially in females. Since sarcopenia and CVD, together, are responsible for the high morbidity and mortality rates in older adults, it is important to clarify the relationship between them to adopt preventive measures and consequent reduction of the high costs with regard to treatment resulting from complications involving these variables, and promote overall health and quality of life.
Thus, the objective of this study was to determine the pre -valence of sarcopenia and its association with cardiovascular risk factors in physically active adult and elderly women.
Methods
Study type and sample
This is a cross-sectional and descriptive study with
proba-bilistic and non-intentional samples. Overall, 124 physically
active women participated in the study, which were divided into control group (CG) and study group (SG). CG consisted of 33 healthy students coming from various undergraduate courses at Federal University of Viçosa, aged between 20 and 30 years (24.5 ± 2.9 years). The inclusion criterion adopted was moderate or
high physical activity levels (PAL), veriied by the International
Physical Activity Questionnaire (IPAQ) - long version (Matsu-do et al., 2001). SG was composed of 91 healthy women aged between 45 and 83 years (61.9 ± 8.7 years), all participants in a
itness project offered by the Department of Physical Education,
Federal University of Viçosa. The inclusion criterion adopted was
participation in the project activities for at least six months. Both
groups included women of white, brown and black skin color. The survey was conducted after signing an informed consent form, according to ethical standards approved by the
Ethics Research Committee of the Federal University of Viçosa (Protocol 073/2011).
Procedures
The research was conducted in two phases. The main
ob-jective of Phase I was to identify the key data regarding body
composition and physical activity habits of both groups. The
inclusion of the CG at this stage aimed speciically to generate
reference values for appendicular lean mass (ALM). From these reference values, the criteria to determine sarcopenia in the SG were used, seeking thereby to approximate the characteristics of the control sample to those of the study group, since these values
are speciic to each population group. Phase II, conducted only
with SG, aimed at evaluating aspects related to cardiovascular risk. Blood parameters and pressure were measured and ques-tionnaires on smoking, pre-existing diseases and medications
used were illed out, and anthropometric measurements were
taken, which were used to calculate the different anthropometric indexes mentioned in literature as associated with CVD.
Phase I
The irst phase consisted of illing the IPAQ - long version
(Matsudo et al., 2001), to obtain body mass (BM, kg) and height (H, cm) measurements and to assess body composition through DXA, with the participation of all involved in the study (CG
and SG). The questionnaires were individually illed out, with
assistance from the researcher, if necessary. BM and H were respectively measured using Filizola® scale with precision of 100 g and Sanny stadiometer®, scaled in 1 mm, according to Lohman (1992). During evaluation, participants wore light clothing and all equipment used was in proper operation and calibration conditions. Body Mass Index (BMI) was obtained by the ratio between BM (kg) and the square of H (m²). The equip-ment used for DXA was the densitometer GE Healthcare Lunar Prodigy Advance DXA System, 13:31 version, whose handling was performed by specialized technician at the Department of X-Ray and Bone Densitometry, Federal University of Viçosa. From DXA, body fat percentage (BF%) and appendicular lean mass (ALM; kg) were extracted, which was obtained by the sum of the lean masses of lower (LMLL; kg) and upper limbs (LMUL; kg). To relate it to the size of the mass evaluated, this sum was divided by the squared height in meters, which was
called appendicular lean mass adjusted for height (ALMH; kg/
m²). ALM and especially ALMH were constantly used, from values that can be observed in the DXA evaluation as predictor factor of the appendicular muscle mass and possible sarcopenic process (Goodpaster et al., 2006; Hairi et al., 2010; Kirchengast & Huber, 2009; Lee et al., 2007).
Literature does not show a speciic value or rating, as occurs
for BMI, to identify sarcopenia or possible disabilities relative to appendicular lean mass. Thus, as in other studies (Lim et al., 2010; Tanko, Movsesyan, Mouritzen, Christiansen, & Svendsen, 2002), this study assessed the prevalence of sarcopenia similarly
for osteopenia and osteoporosis, that is, loss from one to two and a half standard deviations (1 to 2.5 SD) and loss over two and a half standard deviations (> 2.5 SD) below the mean for the young population. It is known that the decrease of bone mass in one SD already may have health consequences. Similarly, it could be inferred that from 1 SD of lean mass loss, the individual might already have impaired functionality of the appendicular
skeleton (Janssen, Heymsield, & Ross, 2002). For comparison
purposes, in this study, women included in the above two criteria
were classiied as sarcopenic.
Phase II
This phase included only women in the SG (n = 91). All participants were submitted to blood count and blood pressure
measurements and illed out the questionnaire on smoking,
pre-existing diseases and use of medications to compose the
Framingham Risk Score (FRS) (Anderson, Wilson, Odell, &
Kannel, 1991). Blood parameters analyzed were fasting plasma glucose, total cholesterol and fractions, and triglycerides. Blood was collected by specialized technician and analyzed at the Laboratory of Clinical Analysis, Federal University of Viçosa.
Anthropometric measurements were taken for calculation
of different indexes. Waist circumference (WC, cm) and hip
circumference (HC, cm) were measured, respectively, at the midpoint between the last rib and the iliac crest and at the point of greatest gluteus circumference (Heyward, 2004). The
Waist-Hip Ratio (WHR) was calculated by dividing the WC by HC (Bray & Gray, 1988). The Waist-Height Ratio (WHER) was obtained by dividing WC (cm) by H (cm) (Ho, Lam, &
Janus, 2003). The Conicity Index (CI) was calculated using
the formula: CI = WC(m) / 0.109*((BM(kg)/H(m)1/2)) (Valdez, Seidell, Ahn, & Weiss, 1993).
Statistical analyses
Descriptive analysis used mean, standard deviation, median and interquartile difference for age, physical activity level, body mass, height, BMI, body fat percentage, ALM, ALMH, LMLL, and LMUL. For comparisons of variables between CG and SG, the Student t-test was used when variables were normally
distri-buted and the Mann-Whitney test when data did not show this
condition. To assess the association between cardiovascular risk factors and sarcopenia, multiple logistic regression models were
performed and odds ratios were computed with conidence inter -vals (CI = 95%) for age, hypertension, smoking, total cholesterol
and fractions, triglycerides, diabetes, obesity, FRS, WHR, CA, IC, WHER, and BMI. The signiicance level was set at p <0.05.
For processing and statistical analysis, Statistical Package for the Social Sciences software (SPSS) version 17 was used.
Control group (n=33) Study group (n=91)
Mean (SD) Median Interquartile Difference
Mean (SD) Median Interquartile Difference
Age (years) 24.4 (2.9) 25.0 22.0 – 26.0 61.9* (8.7) 62.0 55.0 – 68.0
PAL (mets/week) 5973 (5388) 3954 2304 – 7968 3208* (2991)
2166 1050 - 4181
Body mass (kg) 58.3 (7.8) 57.0 52.7 – 61.9 64.5* (8.3) 63.8 58.9 – 70.4
Height (cm) 161 (5.0) 161 159 – 166 154* (5.0) 154 150 - 159
BMI (kg/m²) 22.3 (2.6) 21.8 20.3 – 23.6 27.0* (3.1) 26.8 25.0 – 28.9
BF (%) 28.5 (5.6) 28.6 24.2 – 31.8 36.9* (6.2) 37.0 32.4 – 41.3
ALM (kg) 20.9 (2.3) 20.8 20.0 – 22.2 17.9* (2.0) 17.9 16.5 – 19.2
ALMH (kg/m²) 8.0 (0.6) 8.0 7.5 – 8.5 7.5* (0.7) 7.5 7.1 – 7.9
LMLL (kg) 16.7 (1.8) 16.7 16.1 – 17.8 14.1* (1.7) 14.1 13 – 15.3
LMUL(kg) 4.2 (0.6) 4.1 3.8 – 4.5 3.8* (0.5) 3.8 3.4 – 4.3 * Signiicant at p <0.05. PAL - Physical Activity Level, BMI - Body Mass Index; BF - Body Fat; ALM - Appen-dicular Lean Mass; ALMH - AppenAppen-dicular Lean Mass corrected by Height; LMLL - Lean Mass of Lower Limbs; LMUL - Lean Mass of Upper Limbs.
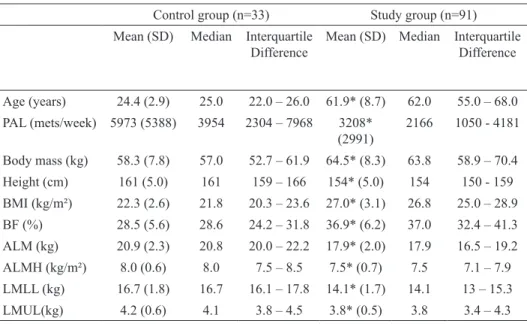
Table 1. Characteristics of the study samples and comparisons between control and study groups.
Age groups (years)
N ALM (kg) ALMH (kg/m²)
LMLL (kg)
LMUL (kg)
20 – 30 33 20.9 8.0 16.7 4.2
45 - 49 8 20.2 7.9 15.9 4.3
50 - 54 14 17.8*¶ 7.5¶ 14.2*¶ 3.8*¶
55 – 59 10 18.0¶ 7.4 14.0¶ 3.9
60 – 64 23 17.5*¶ 7.3*¶ 13.8*¶ 3.7*¶
65 – 69 21 17.8*¶ 7.5¶ 13.9*¶ 3.9
> 70 15 17.4*¶ 7.5¶ 13.8*¶ 3.6*¶
Table 2. Mean values of ALM, ALMH, LMLL, and LMUL in different age groups - control group aged 20 to 30 years and study group over 45 years.
* Signiicant at p <0.05 versus 45-49 years; ¶ signiicant at p <0.05 versus
Age (years)
N Low Risk (%)
Moderate Risk (%)
High Risk (%)
45 - 49 8 87.5 12.5 0.0
50 - 54 14 50.0 50.0 0.0
55 – 59 10 20.0 70.0 10.0
60 – 64 23 13.0 78.0 9.0
65 – 69 21 0.0 67.0 33.0
> 70 15 0.0 53.0 47.0
TOTAL 91 21.0 60.0 19.0
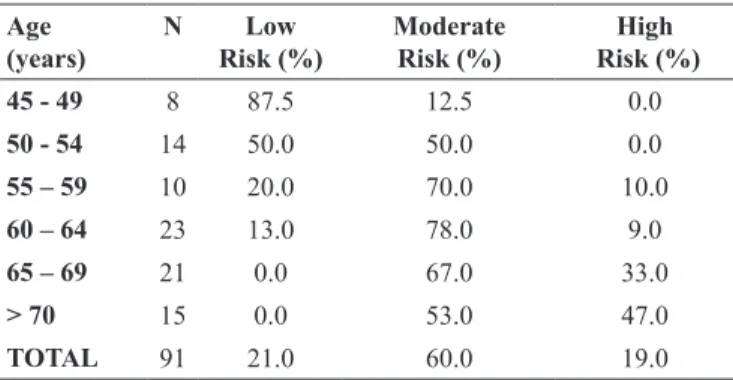
Table 4. Risk of cardiovascular diseases in the next10 years in middle -aged and elderly women according Framingham criteria and American Hearth Association.
Results
Table 1 shows the mean, standard deviation (SD), median, interquartile difference (25% - 75%) and the comparison of means of the main characteristics of the groups studied. As can
be seen in Table 1, all variables showed signiicant differences
between study and control groups. Regarding body composi-tion, increased body mass index in the study group appears to be linked to higher body fat percentage, since all lean mass variables are below their counterparts in the control group.
Table 2 shows the comparison of means for ALM, ALMH,
LMLL, and LMUL in different age groups. When divided by
age groups, it was observed that sarcopenia seems to start after
the age of 50, with no signiicant differences in any of the varia -bles analyzed in the study group aged 45 to 49 years compared to the control group. Table 2 also shows that the lean mass of lower limbs and lean mass of upper limbs remained relatively unchanged over the years, resulting in proportional reduction in the sum of both.
Table 3 shows the prevalence of sarcopenia in the study group for ALM, ALMH LMLL, and LMUL. The prevalence is described in accordance with losses between one and two and a half (1 - 2.5 SD) and more than two and a half (> 2.5 SD) standard deviations
below the mean for the young population. Overall, the prevalence
of sarcopenia increased with advancing age, being greater when the lean mass of lower limbs was considered.
Table 4 shows the cardiovascular risk according to the Framingham Risk Score (Anderson et al., 1991) and cutoffs according to the American Heart Association (Mosca et al.,
2011). Women with score equal to or greater than 13 points,
which is equivalent to 10% higher risk of developing CVD in
the next 10 years, were considered high risk. Women whose
score was greater than nine and lower than or equal to 13 (risk
between 5 and 10%) were classiied as moderate risk, and
those whose score was lower than nine (risk less than 5%)
were classiied as low risk. Table 4 shows that cardiovascular risk by Framingham score increases signiicantly with age,
and women over 65 years have the highest percentage in the high-risk class and women younger than 50 years had the highest percentage in the low-risk class.
As seen in Table 3, 90% of women who had sarcopenia were included in criteria between 1 and 2.5 SD below the mean for the young population. Thus, Table 5 shows the association between sarcopenia and several risk factors for cardiovascular diseases, considering women from 1 SD below the mean for the young population as sarcopenic. Information on the presence or absence of hypertension and smoking ha-bits were taken from questionnaire responses. Cutoff points for total cholesterol (> 200mg/dL), LDL (> 130mg/dL),
HDL (<40mg/dL), triglycerides (> 150mg/dL) and WHR (>
0.80) were adopted for women aged 40 to 49 years; > 0.82 for women aged 50 to 59 years; > 0.84 for women over 60
years, according to Heyward (2004). Women with fasting
glucose greater than 126 mg/dL (SBD, 2009) were considered diabetic. The cutoff used for obesity was 35% of total body fat measured by DXA (Romero-Corral et al., 2008). The limit adopted for FRS was equal to or greater than 13 points (Mosca et al., 2011). As for abdominal fat (android) and CI, there is lack of evaluation and comparison parameters, women whose values were above the median value were considered at increased risk, which is equivalent to 42.1% for abdominal fat and 1.16 for CI. The cutoff point for waist
circumference was 80 cm, classiied according to Lean, Han, and Morrison (1995). For WHER, women showing values
greater than 0.5 were considered at increased risk (Hsieh, Yoshinaga, & Muto, 2003). PAL was sectioned in 3000 mets/
week (IPAQ, 2005). BMI was classiied according to World
1 – 2.5 SD > 2.5 SD
Age (years) N ALM ALMH LMLL LMUL ALM ALMH LMLL LMUL
45 - 49 8 12.5 12.5 25.0 12.5 0.0 0.0 0.0 0.0
50 - 54 14 71.4 21.4 64.3 50.0 0.0 0.0 14.3 0.0
55 – 59 10 20.0 20.0 30.0 20.0 20.0 20.0 30.0 10.0
60 – 64 23 65.2 39.1 65.2 34.8 8.7 4.4 13.0 0.0
65 – 69 21 47.6 33.3 42.9 23.8 9.5 0.0 23.8 0.0
> 70 15 60.0 40.0 60.0 46.7 6.7 0.0 20.0 0.0
TOTAL 91 51.6 30.8 51.6 33.0 7.7 3.3 17.6 1.1
ALM - Appendicular Lean Mass; ALMH - Appendicular Lean Mass corrected by Height; LMLL - Lean Mass of Lower Limbs; LMUL - Lean Mass of Upper Limbs.
upper limbs, although in proportional terms, the decline becomes practically identical, since LMUL corresponds approximately to one third of LMLL.
The prevalence of sarcopenia observed in this study as recommended by Baumgartner et al. (1998), who is pioneer in
studies on this subject and assumes sarcopenia as the ALMH two
standard deviations below the mean for young individuals, was much lower than the prevalence found in the cited work. The author obtained prevalence of 24% for Hispanic women and 23% for non-Hispanic white women aged below 70 years. This study showed prevalence of approximately 12% following the same cri-teria. This prevalence increases to 34.1% when considering only one standard deviation below the mean for the young population. The average ALMH for the SG in this work was 7.5 kg/m² and the cutoffs for sarcopenia in 1 and 2.5 SD were respectively 7.3 kg/m² and 6.4 kg/m². These values are higher than those found in
other studies (Lau, Lynn, Woo, Kwok, & Melton, 2005; Sanada
et al., 2010; Tanko et al., 2002), which may be associated with
the level of habitual physical activity and other speciic features of the sample studied. Other works (Lau et al., 2005; Tanko et
al., 2002) also found lower prevalence compared to the study of Baumgartner et al. (1998) and closer to those observed in this study. Iannuzzi-Sucich, Prestwood, and Kenny (2002) adopted the same cutoff points used by Baumgartner et al. (1998) and reported a prevalence of 12% lower than that reported for women in similar age groups. The study by Tanko et al. (2002) found prevalence of 40.2% and 12.3% for ALM and ALMH respectively in women over 70 years of age and considering 2 SD below the mean for the young population. In this study, values of 26.7% and 6.7% were found for the same conditions. Table 3 shows that women over 55 years had higher prevalence of sarcopenia according to ALMH,
when considering the sum of the two criteria adopted. Women
above 50 years showed sharp drop in LMLL, regardless of the standard deviation adopted as criterion, which is worrisome due to the high relationship between LMLL and physical disabilities and falls (Janssen, Baumgartner, Ross, Rosenberg, & Roubenoff,
2004; Woo, Leung, Sham, & Kwok, 2009; Zong et al., 2007). In
addition, according to data in Table 3, the decrease in LMLL is higher in women aged over 70 years, which may be a key factor in the independence of elderly individuals due to the great im-portance of these muscles in the walking process (Rexach, 2006). The data in Table 4 allow concluding that the
cardiovascu-lar risk according to the Framingham risk score signiicantly increases with advancing years, indicating that age is a major factor in the present calculation. Women included in the “high risk” group are those whose risk for developing CVD over the
next 10 years was equal to or greater than 10%. By 2010, men and women with risk equal to or greater than 20% to develop coronary problems in the same period were considered high risk patients. In 2011, the American Heart Association published a
guideline (Mosca et al., 2011) speciic for women, adopting cutoff for high risk classiication of 10%, which is equivalent to
13 points in the Framingham scale, considering the new values assigned to each variable in this calculation. According to the
new guideline, the number of “high risk” women increased from
10% to 30%, which in absolute terms represents 21 million Brazilian women.
Health Organization (WHO, 1997) for women up to 60 ye -ars of age and to Lipschitz (1994) for women aged over 60
years. Women with excess weight, overweight or obesity of
any level were considered at increased risk. Data presented
in Table 5 show that only BMI has statistically signiicance
compared to sarcopenia for analyzed factors.
Discussion
The averages of all sample characterization variables statis-tically differed between CG and SG. However, when dividing by age groups, there are no differences between averages for ALM, ALMH, LMLL, and LMUL in the age group from 45 to 49 years compared to the control group. It was also observed that in relative terms, LMLL and LMUL suffered similar changes over the years, resulting in a proportional decrease also in the sum of lean masses of lower and upper limbs (ALM), which in this study was approximately 13% when compared with
data from the irst and last age groups. Data from the study by
Gallagher et al. (1997) involving LMLL and LMUL suggest that the loss of lean mass in the lower limbs is about 0.3 kg per decade, three times greater than the loss of lean mass in the
% Odds Ratio¶(CI 95%) p
Age >70 years 16.48 0.69 (0.12 - 3.88) 0.68
Hypertension 53.85 1.47 (0.57 – 3.77) 0.34
Smoking 6.59 1.87 (0.28 – 12.64) 0.07
Total Cholesterol 42.86 0.28 (0.06 – 1.30) 0.10
LDL Cholesterol 19.78 0.49 (0.05 – 4.92) 0.54
HDL Cholesterol 14.28 0.35 (0.11 – 2.38) 0.34
Triglycerides 24.17 2.08 (0.73 – 5.95) 0.10
Diabetes 7.69 0.33 (0.02 – 7.04) 0.48
Obesity 58.24 1.59 (0.45 – 5.69) 0.02
Framingham Risk Score (FRS)
18.68 1.35 (0.42 – 4.28) 0.06
Abdominal Fat 50.55 1.80 (0.51 – 6.34) 0.01
Waist-Hip Relation
(WHR) 52.75 0.81 (0.16 – 4.14) 0.80
Waist Circumference
(WC) 58.24 0.22 (0.02 – 3.37) 0.28
Conicity Index (CI) 49.45 0.82 (0.11 – 6.03) 0.85
Waist-Height Relation
(WHER) 70.33 1.10 (0.15 – 8.05) 0.92
Physical activity Level (PAL)
37.36 0.54 (0.13 – 2.27) 0.40
Body Mass Index (BMI)
60.45 0.02 (0.00 – 0.42) 0.01§
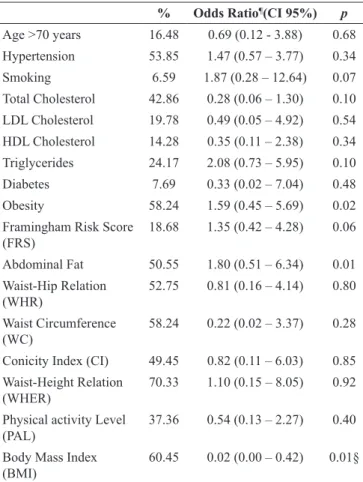
Table 5. Association between sarcopenia* and cardiovascular risk factors.
* Appendicular Lean Mass (kg / m²) of less than one standard deviation below the mean for the young population.
¶ Odds ratios for hypertension, smoking, triglycerides, obesity, FRS and abdo
-minal fat were adjusted for age, total cholesterol, LDL, HDL, diabetes, WHR, WC, CI, WHER, PAL and BMI.
The data in Table 5 show that there is no statistically
signi-icant association between the factors analyzed and sarcopenia,
except for BMI, which appears to be a protective factor, which agrees with results from other studies that indicate a high cor-relation between low BMI and sarcopenia (Lau et al., 2005; Sanada et al., 2010). BMI also plays a protective role when compared to ALM. However, higher odds ratios observed for hypertension, smoking, triglycerides, obesity, Framingham risk score, and abdominal fat showed a trend of association between sarcopenia and risk factors for CVD and together explained 67% of the variation in appendicular lean mass corrected by height.
The metabolic effects of sarcopenia include a decrease in resting metabolic rate due to the decrease in lean body mass and physical activity, which can lead to an increased prevalence of insulin resistance, type-2 diabetes mellitus, dyslipidemia and hypertension (Karakelides & Nair, 2005). In this study, the prevalence of hypertension was 54%, which is considered high, since population-based studies show prevalence from 22% to 44% in Brazilian cities (Boing & Boing, 2007), but considered normal according to VIGITEL (2010) data, which show prevalence of 53.4% for women aged between 55 and 64 years and 62% for women over 65 years. Additional statistical
analyses showed signiicant association between hypertension and LMUL (p <0.05). Although in this study sarcopenia was
not associated with hypertension, in the study by Sanada et al. (2010), who also assessed the association between sarcopenia and cardiovascular risk factors, arterial stiffness (given by in-creased diastolic blood pressure ≥ 85 mmHg), it was strongly associated with sarcopenia in women.
Smoking and triglyceride levels are related to lifestyle, being
inluenced by cultural and socio-economic issues, including diet.
According to Reicher et al. (2009), the cessation of smoking
has rapid consequences in inlammatory biomarkers in women at risk for CVD. Other studies evaluating the relationship be
-tween these two variables and sarcopenia found no signiicant
differences (Baumgartner et al., 1998; Sanada et al., 2010). The Framingham score also tended to show an association with sarcopenia, since its calculation takes into account some of the variables with the same condition (hypertension and smoking).
Unlike the results found in the study by Baumgartner et al. (1998), where obesity was mentioned as a protective factor to sarcopenia, the odds ratio of 1.68 found in this study shows a convergence of sarcopenia to risk factor. More recent studies (Kim et al., 2011; Lim et al., 2010) consider sarcopenic obesity as the combination of factors adopted for predicting obesity and sarcopenia, with prevalence of 5.7% in women aged ≥ 65 years. The present study showed prevalence of 24.2% of
wo-men classiied as obese-sarcopenic, with the same obesity and
sarcopenia criteria shown in Table 5. In a longitudinal study by Stephen and Janssen (2009), where 2033 women aged 65
or older were evaluated for 8 years, no signiicant associations between CVD and obesity-sarcopenia were found. The indings
suggest that muscle strength may be more important than muscle mass in the protection against CVD in the elderly. However, the etiology of sarcopenic obesity is unknown (Zamboni, Mazzali, Fantin, Rossi, & Di Francesco, 2008) and may help clarify the
relationship between obesity, morbidity and mortality in the elderly (Baumgartner et al., 2004). Thus, studies involving the relationship between obesity and sarcopenia should be con-ducted, assessing the different factors that can cause changes in the behavior of the association between these two variables.
The fact that high BMI is a protective factor and that higher obesity levels behave as a risk factor can be partly explained by the failure of BMI in classifying body adiposity. Exploratory
analysis showed that 90% of women were classiied as normal
weight by BMI and those showing BF% above 35% were
sar-copenic, while 100% of overweight women by BMI classiica -tion and with BF% below 35% were not sarcopenic. There is a tendency of the former situation to be more prevalent in the age group above 60 years, and with decreasing age, it seems that the second situation is more likely to occur, since women aged below 60 years had increased physical activity levels. Since BMI and BF% are positively correlated, the overall trend would be that an increase of one would lead to an increase in the value of the other. However, this study observed that if BF% is high, but the BMI value is considered eutrophic, the individual will probably be sarcopenic, lean mass will be reduced, with great replacement by body fat. However, a decreased BF% and high
BMI will lead to a beneit to the individual in relation to sarcope -nia, because excess weight should be linked to higher lean mass levels. Then, none of these variables alone can assess the level of sarcopenia. Due to that fact that BMI is a more appropriate method for assessing nutritional status, the use of additional techniques is needed to better characterize the individual in relation to aspects related to differences in body composition.
Abdominal fat and CI, despite not having cutoff points to identify individuals with greater propensity to CVD, are considered by several studies as factors directly related to cardiovascular risk, as they are indicative of central obesity (Costa, Soares, Lemos, Maranhao, & Azevedo, 2010; Kim et al., 2011; Pitanga & Lessa, 2005) and DXA can be an interesting method for estimating body fat, including visceral fat (Kaul et al., 2012; Toombs, Ducher, Shepherd, & De Souza, 2012). However, this study observed a trend of sarcopenia only as a risk factor for body fat.
PAL showed considerable tendency as a protective factor. Studies that include behavioral changes and increased physical activity in different age groups (Mayer et al., 2011; Subirats, Subirats, & Soteras, 2012) clearly demonstrate an inverse rela-tionship between increased physical activity and slow decline in lean body mass. Thus, further studies involving more repre-sentative samples in each age group should be carried out, with different levels of physical activity interventions.
Conclusions
In short, the prevalence of sarcopenia in non-sedentary
Score, abdominal fat and as a protective factor in the variable physical activity level.
Future studies of the same nature can overcome some limita-tions found in the present study such as reduced sample, absence of a sedentary control group and the way of establishing the level of physical activity (indirect measure). These limitations duly taken into account may make the results even more enriching.
References
Anderson, K. M., Wilson, P. W., Odell, P. M., & Kannel, W. B. (1991). An updated coronary risk proile. A statement for health professio -nals. Circulation, 83, 356-362.
Baumgartner, R. N., Koehler, K. M., Gallagher, D., Romero, L.,
Heyms-ield, S. B., Ross, R. R., … Lindeman, R. D. (1998). Epidemiology
of sarcopenia among the elderly in New Mexico. American Journal of Epidemiology, 147, 755-763.
Baumgartner, R. N., Wayne, S. J., Waters, D. L., Janssen, I., Gallagher,
D., & Morley, J. E. (2004). Sarcopenic obesity predicts instrumental activities of daily living disability in the elderly. Obesity Research, 12, 1995-2004.
Boing, A. C., & Boing, A. F. (2007). Hipertensão arterial sistêmica: o que nos dizem os sistemas brasileiros de cadastramentos e infor-mações em saúde. Revista Brasileira de Hipertensão, 14, 84-88.
Bray, G. A., & Gray, D. S. (1988). Obesity. Part I--Pathogenesis.
Western Journal of Medicine, 149, 429-441.
Bunout, D., de la Maza, M. P., Barrera, G., Leiva, L., & Hirsch, S. (2011). Association between sarcopenia and mortality in healthy older people. Australasian Journal on Ageing, 30, 89-92. Costa, E. C., Soares, E. M., Lemos, T. M., Maranhao, T. M., &
Azevedo, G. D. (2010). Índices de obesidade central e fatores de risco cardiovascular na síndrome dos ovários policísticos [Central obesity index and cardiovascular risk factors in polycystic ovary syndrome]. Arquivos Brasileiros de Cardiologia, 94, 633-638.
Datasus. (2011). Taxa de mortalidade especíica por doenças do
aparelho circulatório. Retrieved from http://www.datasus.gov.br
Fielding, R. A., Vellas, B., Evans, W. J., Bhasin, S., Morley, J. E., Newman, A. B., … Zamboni, M. (2011). Sarcopenia: an undiag
-nosed condition in older adults. Current consensus deinition:
prevalence, etiology, and consequences. International working group on sarcopenia. Journal of the American Medical Directors Association, 12, 249-256.
Gallagher, D., Visser, M., De Meersman, R. E., Sepulveda, D.,
Baum-gartner, R. N., Pierson, R. N., … Heymsield, S. B. (1997). Appen -dicular skeletal muscle mass: effects of age, gender, and ethnicity. Journal of applied physiology (Bethesda, Md.: 1985), 83, 229-239.
Goodpaster, B. H., Park, S. W., Harris, T. B., Kritchevsky, S. B., Nevitt, M., Schwartz, A. V., … Newman, A. B. (2006). The loss of skeletal
muscle strength, mass, and quality in older adults: the health, aging and body composition study. The Journals of Gerontology. Series A, Biological Sciences and Medical Sciences, 61, 1059-1064. Hairi, N. N., Cumming, R. G., Naganathan, V., Handelsman, D. J., Le
Couteur, D. G., Creasey, H., … Sambrook, P. N. (2010). Loss of muscle strength, mass (sarcopenia), and quality (speciic force) and
its relationship with functional limitation and physical disability:
the Concord Health and Ageing in Men Project. Journal of the American Geriatrics Society, 58, 2055-2062.
Heyward, V. H. (2004). Avaliação física e prescrição de exercício: técnicas avançadas. Porto Alegre, RS: Artmed.
Ho, S. Y., Lam, T. H., & Janus, E. D. (2003). Waist to stature ratio is
more strongly associated with cardiovascular risk factors than other
simple anthropometric indices. Annals of Epidemiology, 13, 683-691.
Hsieh, S. D., Yoshinaga, H., & Muto, T. (2003). Waist-to-height ratio,
a simple and practical index for assessing central fat distribution and metabolic risk in Japanese men and women. International Journal of Obesity and Related Metabolic Disorders, 27, 610-616. Iannuzzi-Sucich, M., Prestwood, K. M., & Kenny, A. M. (2002). Pre-valence of sarcopenia and predictors of skeletal muscle mass in healthy, older men and women. The Journals of Gerontology. Series A, Biological Sciences and Medical Sciences, 57, M772-M777. IPAQ. (2005). International Physical Activity Questionnaire -
Guide-lines for data processing and analysis of the International Physical Activity Questionnaire (IPAQ) - Short and Long Forms. Retrieved from http://www.ipaq.ki.se/scoring.pdf
Janssen, I., Baumgartner, R. N., Ross, R., Rosenberg, I. H., & Roube-noff, R. (2004). Skeletal muscle cutpoints associated with elevated physical disability risk in older men and women. American Journal of Epidemiology, 159, 413-421.
Janssen, I., Heymsield, S. B., & Ross, R. (2002). Low relative skeletal
muscle mass (sarcopenia) in older persons is associated with func-tional impairment and physical disability. Journal of the American Geriatrics Society, 50, 889-896.
Karakelides, H., & Nair, K. S. (2005). Sarcopenia of aging and its meta-bolic impact. Current Topics in Developmental Biology, 68, 123-148.
Kaul, S., Rothney, M. P., Peters, D. M., Wacker, W. K., Davis, C.
E., Shapiro, M. D., & Ergun, D. L. (2012). Dual-energy X-ray
absorptiometry for quantiication of visceral fat. Obesity (Silver Spring, Md.), 20, 1313-1318.
Kim, T. N., Park, M. S., Lim, K. I., Yang, S. J., Yoo, H. J., Kang, H. J.,
… Choi, K. M. (2011). Skeletal muscle mass to visceral fat area
ratio is associated with metabolic syndrome and arterial stiffness:
The Korean Sarcopenic Obesity Study (KSOS). Diabetes Research and Clinical Practice, 93, 285-291.
Kirchengast, S., & Huber, J. (2009). Gender and age differences in lean soft tissue mass and sarcopenia among healthy elderly. An-thropologischer Anzeiger, 67, 139-151.
Lau, E. M., Lynn, H. S., Woo, J. W., Kwok, T. C., & Melton, L. J.
(2005). Prevalence of and risk factors for sarcopenia in elderly Chinese men and women. The Journals of Gerontology. Series A, Biological Sciences and Medical Sciences, 60, 213-216.
Lean, M. E., Han, T. S., & Morrison, C. E. (1995). Waist circumference
as a measure for indicating need for weight management. British Medical Journal, 311, 158-161.
Lee, J. S., Auyeung, T. W., Kwok, T., Lau, E. M., Leung, P. C., & Woo,
J. (2007). Associated factors and health impact of sarcopenia in older chinese men and women: a cross-sectional study. Geronto-logy, 53, 404-410.
Lim, S., Kim, J. H., Yoon, J. W., Kang, S. M., Choi, S. H., Park, Y. J., … Jang, H. C. (2010). Sarcopenic obesity: prevalence and associa -tion with metabolic syndrome in the Korean Longitudinal Study on Health and Aging (KLoSHA). Diabetes Care, 33, 1652-1654. Lipschitz, D. A. (1994). Screening for nutritional status in the elderly.
Primary Care, 21, 55-67.
Lohman, T. G. (1992). Advances in body composition assessment. Champaign, IL: Human Kinetics Publishers.
Matsudo, S. M., Araújo, T., Matsudo, V. K. R., Andrade, D., An
-drade, E., Oliveira, L. C., & Braggion, G. (2001). Questionário
Internacional de Atividade Física (IPAQ): estudo de validade e reprodutibilidade no Brasil [International physical activity ques-tionnaire (IPAQ): study of validity and reliability in Brazil]. Revista Brasileira de Atividade Física e Saúde, 6, 5-18.
Mosca, L., Benjamin, E. J., Berra, K., Bezanson, J. L., Dolor, R. J., Lloyd-Jones, D. M., … Wenger, N. K. (2011). Effectivenes -s-based guidelines for the prevention of cardiovascular disease in women--2011 update: a guideline from the American Heart Association. Circulation, 123, 1243-1262.
Pitanga, F. J. G., & Lessa, I. (2005). Anthropometric indexes of obesity as an instrument of screening for high coronary risk in adults in the city of Salvador – Bahia. Arquivos Brasileiros de Cardiologia, 85, 26-31. Reichert, V., Xue, X., Bartscherer, D., Jacobsen, D., Fardellone, C.,
Folan, P., … Metz, C. N. (2009). A pilot study to examine the effects of smoking cessation on serum markers of inlammation
in women at risk for cardiovascular disease. Chest, 136, 212-219. Rexach, J. A. S. (2006). Consecuencias clínicas de la sarcopenia.
Nutrición Hospitalaria, 21, 46-50.
Romero-Corral, A., Somers, V. K., Sierra-Johnson, J., Thomas, R. J.,
Collazo-Clavell, M. L., Korinek, J., … Lopez-Jimenez, F. (2008).
Accuracy of body mass index in diagnosing obesity in the adult gene-ral population. International Journal of Obesity (2005), 32, 959-966. Sanada, K., Miyachi, M., Tanimoto, M., Yamamoto, K., Murakami,
H., Okumura, S., … Higuchi, M. (2010). A cross-sectional study
of sarcopenia in Japanese men and women: reference values and association with cardiovascular risk factors. European Journal of Applied Physiology, 110, 57-65.
SBD. (2009). Diretrizes da Sociedade Brasileira de Diabetes. Retrieved
From http://www.diabetes.org.br/attachments/diretrizes09_inal.pdf
Scott, D., Blizzard, L., Fell, J., & Jones, G. (2011). The epidemiology of sarcopenia in community living older adults: what role does lifestyle play? Journal of Cachexia, Sarcopenia and Muscle, 2, 125-134.
Silva, T. A. A., Frisoli Júnior, A., Pinheiro, M. M., & Szejnfeld, V. L.
(2006). Sarcopenia associada ao envelhecimento: aspectos etio-lógicos e opções terapêuticas [Sarcopenia and aging: etiological aspects and therapeutic options]. Revista Brasileira de Reumato-logia, 46, 391-397.
Stephen, W. C., & Janssen, I. (2009). Sarcopenic-obesity and cardio -vascular disease risk in the elderly. Journal of Nutrition, Health, and Aging, 13, 460-466.
Subirats, B. E., Subirats, V. G., & Soteras, M. I. (2012). Exercise pres-cription: indications, dosage and side effects. Medicina Clínica, 138, 18-24.
Tanko, L. B., Movsesyan, L., Mouritzen, U., Christiansen, C., &
Svend-sen, O. L. (2002). Appendicular lean tissue mass and the prevalence
of sarcopenia among healthy women. Metabolism, 51, 69-74. Toombs, R. J., Ducher, G., Shepherd, J. A., & De Souza, M. J. (2012).
The impact of recent technological advances on the trueness and precision of DXA to assess body composition. Obesity (Silver Spring, Md.), 20, 30-39.
Valdez, R., Seidell, J. C., Ahn, Y. I., & Weiss, K. M. (1993). A new index
of abdominal adiposity as an indicator of risk for cardiovascular disease. A cross-population study. International Journal of Obesity and Related Metabolic Disorders, 17, 77-82.
VIGITEL. (2010). Vigilância de fatores de risco e proteção para doenças crônicas por inquérito telefônico - Ministério da Saúde. Retrieved from http://bvsms.saude.gov.br/bvs/publicacoes/vigitel_2010.pdf
WHO. (1994). Assessment of fracture risk and its application it scre-ening for post menopausal osteoporosis: report of a WHO study group. Geneva: World Health Organization.
WHO. (1997). Obesity: preventing and managing the global epidemic (report of a WHO consultation on obesity). Geneva: World Health
Organization.
Woo, J., Leung, J., Sham, A., & Kwok, T. (2009). Deining sarcopenia
in terms of risk of physical limitations: a 5-year follow-up study of
3,153 chinese men and women. Journal of the American Geriatrics Society, 57, 2224-2231.
Zamboni, M., Mazzali, G., Fantin, F., Rossi, A., & Di Francesco, V. (2008). Sarcopenic obesity: a new category of obesity in the elderly. Nutrition, Metabolism, and Cardiovascular Diseases, 18, 388-395. Zong, S., Chen, C. N., & Thompson, L. V. (2007). Sarcopenia of
ageing: functional, structural and biochemical alterations. Revista Brasileira de Fisioterapia, 11, 91-97.
Authors’ note
Eliane Aparecida de Castro is Master in Physical Education, Depart-ment of Physical Education, Federal University of Viçosa, Viçosa, MG, Brazil.
Luciana Moreira Lima is an Assistant Professor, Department of Medi-cine, Federal University of Viçosa, Viçosa, MG, Brazil.
Matheus Santos Cerqueira is an Assistant Professor, Federal Institute of Education, Science and Technology, Southeastern Minas Gerais, Rio Pomba, MG, Brazil.
Sebastião Gobbi is an Assistant Professor, Department of Physical Education, São Paulo State University, Rio Claro, SP, Brazil.
Leonice Aparecida Doimo is an Assistant Professor, Department of Physical Education, Federal University of Viçosa, Viçosa, MG, Brazil.
Corresponding author:
Eliane Aparecida de Castro
Av. Bueno Brandão, 112/302, Centro, Viçosa, MG, 36570-000. Phone: + 55 31 8878-3071
Email: [email protected]
Acknowledgments:
To all students, trainees and staff of the “Good about life: itness for seniors” project, developed in the Department of Physical Education,
Federal University of Viçosa in partnership with the City Hall of Viçosa, for their collaboration with this work, and to the Coordination for the
Improvement of Higher Level Personnel (CAPES) for inancial support.
This study is part of a Master’s degree dissertation.