Alberto Hideki KanamuraI
Ana Luiza D’Ávila VianaII
I Programa de Pós-graduação. Departamento de Medicina Preventiva. Faculdade de Medicina (FM). Universidade de São Paulo (USP). São Paulo, SP, Brasil
II Departamento de Medicina Preventiva. FM-USP. São Paulo, SP, Brasil
Correspondence: Alberto Hideki Kanamura
R. Dr. Virgilio de Carvalho Pinto, apto. 34 05415-020 São Paulo, SP, Brasil E-mail: [email protected] Received: 5/17/2006
Reviewed: 2/1/2007 Approved: 6/20/2007
High expenditure on a private
healthcare plan: for whom and
in what
ABSTRACT
OBJECTIVE: To assess expenditures and the profi le of benefi ciaries of a private health plan and the impact of these expenditures on the fi nances of both the plan and of benefi ciaries.
METHODS: Descriptive study including 64,219 costumers of a health insurance plan of the State of São Paulo in the year of 2003. The characteristics of high spenders were assessed according to age group, gender, type of expenditure, and related diseases.
RESULTS: Among all customers, 642 benefi ciaries (1%) were the highest spender in the year, accounting for 36% of the total. Among these benefi ciaries, 45% were elderly, over 60 years old. Greatest expenditure was with medical supplies and drugs. Circulatory diseases, cancer, musculoskeletal diseases, respiratory tract diseases and the external causes were most frequently associated with these expenditures.
CONCLUSIONS: Age is an important factor associated with high expenditures, being closely connected with chronic degenerative diseases. Thus, ageing of the population points out to the need for strategic changes in the management of private health care plans.
KEY WORDS: Health maintenance organizations, economics. Health expenditures. Health care costs. Health care economics and organiza-tions.
INTRODUCTION
Health is a duty of the State, according to the Constitution. Brazil has a public health system that grants universal and free access to all people. In spite of that, the Law 9,656 from 1998, regulated what we call “health care plans”, which are private and with access restricted to those who pay. Since then, adjustment to the new rules has not occurred completely, according to Bahia1
(2001). Companies and customers are still not satisfi ed. The critical points for companies are the costs and, for customers, prices charged.
A disease free world seems to be closer, but at what cost? Weinstein & Stason10
(1977) state: “Now it is almost universal the belief that available resources for he-alth care are fi nite. This fact may had not been noticed some decades ago, before the spreading of health insurance and increase in current medical technology”. Carvalho & Garcia2 (2003) signaled to the fast ageing of the Brazilian
popula-tion, which has a strong impact on health expenses. According the projection by Kilsztajn et al,7 these expenses may reach 25% of the Gross Domestic Product
* Ministry of Health. National Health Foundation. National Epidemiology Center. Information System on Mortality. Table 10.1 – Propor-tional Mortality per Group of Selected Causes (1) Regions of Brazil and Unities of the Federation, 1999. In: Ministério da Saúde. Anuário Estatístico de Saúde do Brasil 2001 [accessed on Jan.13 2004]. Available at: http://portal.saude.gov.br/portal/aplicacoes/anuario2001/mortal/ Mmortalt10.1a.cfm
One of the main challenges in managing a private medical-hospital health insurance is managing mor-bid events that result in higher expenditures. Up to the enactment of Law 9,656, health plans reduced the risk represented by these events, limiting coverage of hospital stay (especially for intensive therapy), high cost examinations, or even excluding certain diseases, which is now prohibited. Health expenditures do not affect people equally, and it is almost intuitive that a minority will spend excessively, whereas the vast majority will spend little. This distribution fi ts Pareto’s principle, observing a proportion where the minority of actions produces most results this concept is widely known in the business environment.
The present study aimed at assessing the greatest ex-penditures and the profi le of benefi ciaries from a private health care plan and the impact of these expenditures on the fi nances of the plan and benefi ciaries. Additionally, on the epidemiological perspective, the characteristics of benefi ciaries who had high expenses were studied.
METHODS
The study population was benefi ciaries of a health care plan of a service company working in the state of São Paulo running a health insurance for employees, their dependents and relatives. The plan has been organized for over ten years as a self-management being part of the União Nacional das Instituições de Autogestão em Saúde (National Association of Institutions of Self-Management on Health).* Access to the database was authorized by the company, respecting the confi dentia-lity of the information.
“Cost” and “expense” are used as synonyms once va-lues expressed in Brazilian “reais” is cost for the service company and expense for the payments. Defi nition of “high expense” has been inspired on the works of Pochman et al9 (2004), whose study object was the
fi ve thousand families with assets equivalent to 42% of all the income fl ow of the country in one year. In this study rich were generally defi ned as the highest centile of the income distribution. This idea was used to defi ne the concept of high expense, considering as such any expense as of the 99 percentile, adopted as a separatrix in a distribution of expenses made for one year for each benefi ciary, organized in ascending order. The criteria defi nes high expense as relative value, keeping a constant proportion of benefi ciaries regarding the whole, enabling assessment of the impact of the expenses of these benefi ciaries on the fi nances of health care plans.
Because the adopted period was one year, the value between an expense made in January and another in December, was infl uenced by 14.7% infl ation, this variation was assessed by the National Consumer Price Index (INPC) in 2002. The values were not corrected every month, considering that the purchase power was constant over the year. This option implied to assume an error in the separatrix position with variation of up to 14.7%.
Data came from a secondary source, supplied on three fi les on electronic spreadsheet. The fi rst fi le referred to the profi le of the population (amount of individuals and total expenses) by age group, according to the distribution recommended at the time by the Agência Nacional de Saúde Suplementar (ANS – National Agency for Supplementary Health): from zero to 17, from 18 to 29, from 30 to 39, from 40 to 49, from 50 to 59, from 60 to 69, and over 70. The second fi le referred to consolidating all the expenses paid between January 1st and December 31st, 2002, by individual of the list of
642 cases that made the high spenders group because of high expenditure. Each individual was identifi ed by a record number, their age, gender, code of procedure used, procedure description and the amount used, and the value of expense per code. The third fi le contained the number of records and the ICD-10 code declared by the service supplier and the amount of times the code had been reported. The fi rst fi le enabled to build a table of population distribution per age group, and the relative expense volume. The second fi le enabled to determine, for each individual, expenses with fees (medical services, and services of diagnoses and therapy support), hospital stay (paying for one day of admission), hospital fees (services not included such as fees or stay), and materials and medications (used individualized and discriminated as such). The third fi le reported each affected case and their reported diagnoses. Since each benefi ciary could have needed health care services several times during the year, there was more than one recorded diagnosis per benefi ciary. Criteria adopted to choose the main diagnoses was “analysis due to a single cause in morbidity”, trying to follow the guidelines of the Rules and Guidelines for Morbidity and Mortality Coding of the International Classifi cation of Diseases.8
and of the frequencies of the several combinations was performed.
The research project was sent to the Ethical Committee for Research Project Analysis of the Clinical Board of Hospital das Clínicas da Faculdade de Medicina da Universidade de São Paulo (Medical School of the University of São Paulo), which approved it in a session on 4/29/04, and the protocol number was 271/04.
RESULTS
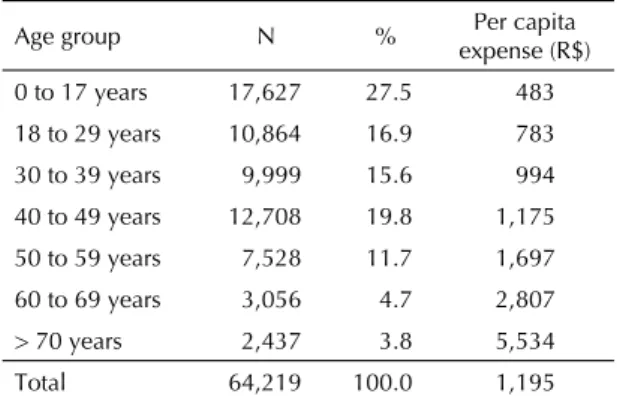
The population of the study (total of benefi ciaries of the health care plan in 2002) was made by 64,219 be-nefi ciaries, the expense was R$ 76,759,169.00; mean per capita expense was R$ 1,195.00 (Table 1) and median R$ 306.00.
The 642 people, classifi ed as high spenders (HS), had spent R$ 27,848,801.00. Expenses ranged from R$ 13,980.00 to R$ 569,899.00. Mean per capita expen-se was R$ 43,378.00 (Table 2) and median was R$ 26,705.00. The male population was 56%, whereas female was 44%. Men had spent more in all age groups,
but from 30 to 39. Mean male expenditure was R$ 46,945.00, and female was R$ 39,582.00.
In the group of benefi ciaries of the study (Table 1)mean per capita expense grew as age increased. Mean expen-ses of those over 60 and 70 were respectively 8.3 and 11.4 times greater than those under 18; mean expense of HS (Table 2) did not present the same trend. Dispersion on the mean per capita value was small. When there is high expense, a lot is spent regardless of the age.
Among HS, 45.4% were over 60, whereas in the total population 8.5% were over 60. Median age among HS was 58, whereas median of the study population was between 30 to 39 years old, close to 34. Among these users, 51.5% were females; this proportion was 49.3% in the population.
Total expenses of HS had an important impact on the per capita cost of the health care plan. These users have spent 36.2% of the total spent by the health care plan. Mean per capita expense of the high spenders accoun-ted for a spending 36.29 times greater than that of the
Table 1. Amount of benefi ciaries of a private health care plan according to age group, proportion of benefi ciaries and per capita expenses. State of São Paulo, 2002.
Age group N % Per capita expense (R$) 0 to 17 years 17,627 27.5 483
18 to 29 years 10,864 16.9 783
30 to 39 years 9,999 15.6 994
40 to 49 years 12,708 19.8 1,175 50 to 59 years 7,528 11.7 1,697
60 to 69 years 3,056 4.7 2,807
> 70 years 2,437 3.8 5,534
Total 64,219 100.0 1,195
Table 2. Amount of high-spender benefi ciaries of a private health care plan according to age group, proportion of bene-fi ciaries and per capita expenses. State of São Paulo, 2002.
Age group N % Per capita expense (R$)
0 to 17 years 29 4.5 53,338 18 to 29 years 43 6.9 36,343
30 to 39 years 42 6.5 33,396
40 to 49 years 108 16.8 34,675
50 to 59 years 128 19.9 38,754 60 to 69 years 106 16.5 46,257
> 70 years 186 28.9 52,300
Total 642 100.0 43,378
Table 3. Proportion of main diagnoses among high-spender benefi ciaries of a private health care plan, in descending order. State of São Paulo, 2002.
Diagnose %
Circulatory disease 27.7
Malignant tumors 15.7
Musculoskeletal diseases 8.6
Respiratory tract diseases 6.1
External causes 6.1
Sub-total 64.2
Nervous system diseases 5.4
Genitounirary disorders 5.3
Undetermined ICD 4.8
Digestive disorders 4.2
Metabolic, nutritional and endocrine disorders 2.9
Abnormal fi ndings 2.8
Pregnancy, delivery and post delivery 2.0
Mental disorders 1.7
Infectious diseases 1.6
Perinatal disorders 1.6
Benign tumors 1.2
Contact with health service 0.8
Eye and ear diseases 0.5
Congenital malformation 0.5
Blood diseases 0.3
Skin and subcutaneous disease 0.2
Total 100.0
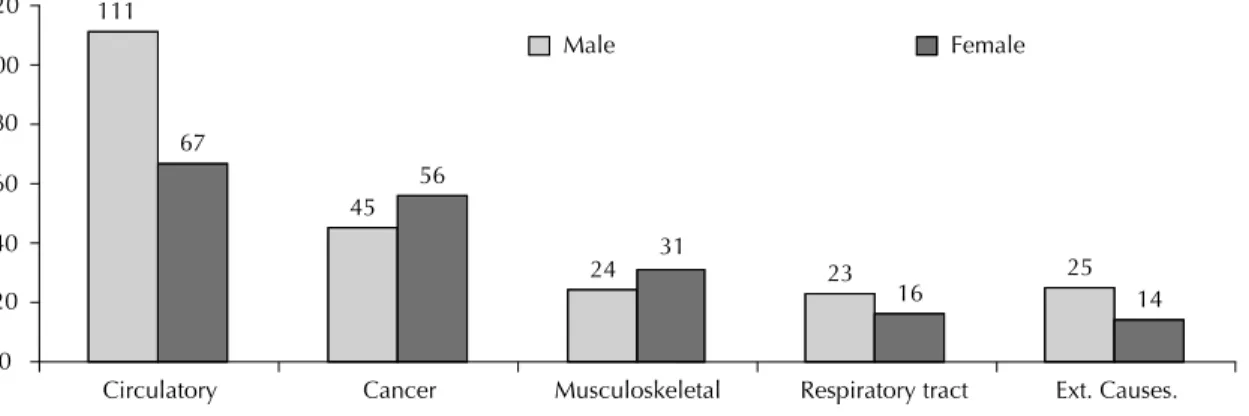
predominance on circulatory and respiratory diseases and external causes, and female predominance on can-cer and musculoskeletal diseases (Figure 2).
Assessing the group of diseases in the sub-categories, a great frequency of ischemic heart disease is observed in circulatory diseases; breast cancer in cancer; back pain in musculoskeletal diseases. Herniated disc surgery was predominant as a treatment. In diseases of the respira-tory tract, pneumonia was the most frequent sub-group. Among the external causes, the most common was lower limb trauma, and that common in elderly male, femoral neck fracture.
DISCUSSION
Although the present study was limited to the popu-lation of a certain health care plan, we believe that comparison with other plans with similar population is possible and useful.
The fact that HS had great impact on the per capita costs of health care plan (36%) is in agreement with other studies. According to Conwell & Cohen,* 1% of the civilian noninstitutionalized accounted for 22% of population. This means that the group of high spenders,
representing 1% of the benefi ciaries, used 56.38 times more resources than the other 99%.
An inverse correlation is observed when the propor-tions of benefi ciaries per age group are assessed; the proportion decreases according to age in the general population (Table 1) and increases in the population of high spenders (Table 2).
Expenditures of HS were made on the following propor-tion: 45.4% with materials and medications; 23.6% with medical fees; 17.2% hospital stay; 13.8% hospital fees. The patterns of these expenses in each age group have little variation, with predominance of higher proportion of expenses with materials and medications in all age groups (Figure 1).
Each benefi ciary with a high expense may have pre-sented one or several diseases in the period. Through the methodology adopted, only the main diagnosis was chosen, the one most accountable for the high expense. Most frequent main diagnoses are presented on Table 3, in ascending order of frequency. The fi ve most frequent diagnoses were distributed according to gender: male
Figure 1. Percentage participation of expenditures of benefi ciaries of a private health call plan, according to age group. State of São Paulo, 2002.
0.0 % 50.0 % 60.0 %
30.0 % 40.0 %
10.0 % 20.0 %
0 to 17 18 to 29 30 to 39 40 to 49 50 to 59 60 to 69 70 + % Fees % Daily stay % Hospital fees % Medical mat.
Figure 2. Most frequent diagnoses of benefi ciaries of a private health care plan, according to gender. State of São Paulo, 2002.
111
45
24 23 25
67
56
31
16 14
0 20 40 60 80 100 120
Circulatory Cancer Musculoskeletal Respiratory tract Ext. Causes.
expenses in the United States; for Halvorson5 (2005),
this proportion was 30%. Difference between the studies is because the fi rst used as a source the natio-nal survey on households conducted by the Medical Expenditure Panel Survey – Agency for Healthcare Research and Quality (MEPS-AHRQ), in 2002, in-cluding private health care, Medicare, Medicaidand private expenses. Halvorson5 studied the American
working population.
Age is an important risk factor for high spending. Prevalence-period of the outcomes studied varied 47 times among extreme age groups. Overall, the outco-me was mostly seen in males and, more signifi cant, in some conditions.
In health care plans where premiums are calculated equally regarding participation, high spenders may increase the per capita costs of lower risk participants. This impact would be lower in plans whose premium is proportional to the risk each participant represents. The law that forbids readjustment as of 60 years old forces transferring costs to younger age groups, which may contribute to make health care plans with individual and voluntary enrollment unfeasible. When enrolling to a health care plan, there is an assessment of the risk of getting sick, called “marketability of risk” by Dranove & Satterthwaite3 (2000), which is the basic principle
of heath care plans. When disproportion between the value of the premiums and the risk is too evident, the enrollment of younger people is inhibited.
Materials and medications represent a sizeable part of the expenses, making the technology used evident. Ina-dequate use or use without technical criteria may incre-ase these expenses. Carolyn & Clancy** question the cost-effectiveness of the new medical technologies; the cost of pharmaceutical care in United States increases 20% a year because of misinterpreted electrocardiogra-ms to defi ne whether a chest pain was infarction or not. Authors estimate that 200,000 unnecessary admissions occur every year, half of them in intensive care unities, US$ 728 million expenses that could be avoided. Still according to these authors, 4 million Americans (15%) with diagnoses of pneumonia are referred to hospital when they could have been treated at home, because their risk was poorly assessed.
Medical fees have a proportionally small participation (24%) among HS, ranging in the several age groups from 20% to 30%.
The sequence of main diagnoses is similar to the pro-portional mortality causes in the State of São Paulo, they are: circulatory diseases, cancer, musculoskeletal diseases, respiratory tract diseases and external causes. Data from the Ministry of Health from 1999, repeat the same groups, in the same order, except for musculoske-letal diseases: circulatory (32.8%), cancer (15.6%), external causes (15.4%), respiratory (11.2%) infectious and parasitic diseases (5.3%). Musculoskeletal diseases are not important as mortality cause (only 0.2%).
Diseases that kill most are also those that cost more, leading to the belief that there is correlation between lethality and high cost. This fi nding corroborates a fi nding of the American literature, according to Hurley6
(2001), mentioning the works of Newhouse & Weis-brod, with Medicare benefi ciaries in the United States, 28% of the health expenses occur in the last year of life of individuals.
For Halvorson5 (2005) the solution to the crisis of the
cost of health system is to identify chronic and acute conditions that lead people to high expenses and avoid this with interventions. Health planning entails choices. As Williams11 (1997) proposes, two types of choices:
one in the clinical practice level, and the other in the process of health planning. For a certain patient, the physician’s duty is to fi nd what is best within everything available. For the process of collective planning it is important to be concerned with the great groups of potential patients for a future action, taking into account the knowledge and technology that will be available in the future.
Mean per capita expense found is R$ 1,195.00 is it a suitable value to fi nance a health system? Mean expense found in the USA in 2002, was US$ 3,302 according to Kashihara & Carper.*** The discussion on how much should be spent on a health system is not that simple, and even among the 29 developed countries of the Organization for EconomicCooperation and Development (OECD) annual per capita cost of their health system varies more than ten times, according to Gerdtham & Jönsson4 (2000).
Outcomes also point out to the need for another strategic change in health insurance management. Age was the most important variable associated with high expendi-ture, being closely correlated to chronic-degenerative diseases.
* Conwell L, Cohen JW. Characteristics of Persons with High Medical Expenditures in the US Civilian Noninstitutionalized Population – 2002. Rockville (MD): Agency for Healthcare Research and Quality; 2005 (MEPS Statistical Brief, 73). [Accessed on May 12, 2005]. Available from: http://www.meps.ahrq.gov/mepsweb/data_fi les/publications/st73/stat73.pdf
** Carolyn M, Clancy MD. Testimony on Technology, Innovation and the Costs of Healthcare. Before the Joint Economic Committee, July 9, 2003. Rockville (MD): Agency for Healthcare Research and Quality; 2003 [Accessed on August 10, 2004]. Available from: http://www.ahrq. gov/news/test70903.htm
1. Bahia L. O mercado de planos e seguros de saúde no Brasil: tendências pós-regulamentação. In: Barjas N, Giovanni GD, organizadores. Brasil: Radiografi a da Saúde. Campinas: Editora UNICAMP; 2001.
2. Carvalho JAM, Garcia RA. O envelhecimento da população brasileira: um enfoque demográfi co, Cad
Saude Publica. 2003;19(3):725-33.
3. Dranove D, Satterthwaite M. The Industrial Organization of Health Care Market. In: Culyer AJ, Newhouse JP, organizadores. Handbook of Health Economics. North Holland: Elsevier; 2000. p. 1095-139.
4. Gerdtham UG, Jönsson B. International comparisons of health expenditure: theory, data and econometric analysis. In: Culyer AJ. Newhouse JP, organizadores. Handbook of Health Economics. North Holland: Elsevier; 2000. p. 13-53.
5. Halvorson GC. Healthcare tipping points. Healthcare
Financ Manage. 2005;59(3):74-80.
6. Hurley J. An overview of the normative economics of the health sector. In: Culyer AJ, Newhouse JP, organizadores. Handbook of Health Economics. North
Holland: Elsevier; 2000. p. 57-118.
7. Kilsztajn S, Rossbach A, Câmara MB, Carmo MSN. Serviços de saúde, gastos e envelhecimento da população brasileira. Rev Bras Estud Popul. 2003;20(1):93-108. [Acesso em 10/1/2005] Disponível em: http://www.abep.nepo.unicamp.br/docs/rev_inf/ vol20_n1_2003/vol20_n1_2003_8artigo_p93a108.pdf
8. Organização Mundial da Saúde. Classifi cação estatística internacional de doenças e problemas relacionados à saúde. 10ª Revisão. São Paulo: Centro Colaborador da OMS para a Classifi cação de Doenças em Português; 2001.
9. Pochmann M, Campos A, Barbosa A, Amorin R, Silva R, organizadores. Atlas da exclusão social no Brasil: os ricos no Brasil. São Paulo: Cortez; 2004. v.3.
10. Weinstein MC, Stason WB. Foundations of cost-effectiveness analysis for health and medical practices.
N Engl J Med. 1977;296(13):716-21.
11. Williams A. The Cost-Benefi t Approach In: Williams A, Culyer AJ, Maynard A, editores. Being Reasonable about the Economics of Health: Selected Essays Cheltenhan, UK: Edward Elgar ;1997.
REFERENCES
* Rosanvallon P. A nova questão social. Repensando o Estado Providência. Trad. S. Bath. Brasília: Instituto Teotônio Vilela; 1998.
Article based on the master dissertation of AH Kanamura, presented to the School of Medicine at USP, in 2005. Management of chronic and degenerative diseases
seems to be crucial to reduce high expenses. Ageing cannot be prevented, and a proactive attitude is neces-sary to control the worsening of these conditions either through prevention and early diagnoses, or, after the onset of the disease, through the adoption of procedures to minimize unnecessary expenses.
To Rosanvallon* (1998) society needs a new social protection system, after the ‘veil of ignorance’ that assumed equality of individuals in face of the different
risks has been removed, now we must consider the changes that have occurred on the perception of the risks of getting sick.