Roberta Schein BigioI
Eliseu Verly JuniorI
Michelle Alessandra de CastroI
Chester Luiz Galvão CésarII
Regina Mara FisbergIII
Dirce Maria Lobo MarchioniIII
I Programa de Pós-Graduação em Nutrição
em Saúde Pública. Faculdade de Saúde Pública (FSP). Universidade de São Paulo (USP). São Paulo, SP, Brasil
II Departamento de Epidemiologia. FSP-USP.
São Paulo, SP, Brasil
III Departamento de Nutrição. FSP-USP. São
Paulo, SP, Brasil Correspondence:
Dirce Maria Lobo Marchioni Faculdade de Saúde Pública da USP Av. Doutor Arnaldo, 715
01246-904 São Paulo, SP, Brasil E-mail: [email protected] Received: 6/15/2010 Approved: 12/8/2010
Article available from: www.scielo.br/rsp
Determinants of fruit and
vegetable intake in adolescents
using quantile regression
ABSTRACT
OBJECTIVE: To analyze fruit and vegetable intake in adolescents and to
identify associated factors.
METHODS: A population-based cross-sectional study was conducted with
a representative sample of 812 adolescents of both sexes in the city of São Paulo, Southeastern Brazil, in 2003. Food consumption was measured with the 24-hour dietary recall. Fruit and vegetable intake was described in percentiles. Quantile regression models were used to investigate the association between this intake and explanatory variables.
RESULTS: Of all adolescents interviewed, 6.4% consumed the minimum
recommendation of 400 g/day of fruits and vegetables and 22% did not consume any type of fruits and vegetables. According to quantile regression models, adjusted for energy intake, age group and sex, per capita household income and head of household’s level of education were positively associated with fruit and vegetable intake, whereas smoking habit showed a negative association. Income was signifi cantly associated with lower intake percentiles (p20 to p55); smoking, with intermediate percentiles (p45 to p75); and head of household’s level of education, with higher percentiles (p70 to 95).
CONCLUSIONS: Fruit and vegetable intake among adolescents of São Paulo
was below the Ministry of Health’s recommendations and it is infl uenced by per capita household income, head of family’s level of education and smoking habit.
DESCRIPTORS: Adolescent. Food Consumption. Fruit. Vegetables.
Socioeconomic Factors.
INTRODUCTION
Fruits and vegetables are widely known because of their relevant role in human health,a and their intake seems to have a protective effect on the risk of obesity,2 diabetes mellitus type 2,2 cardiovascular diseases12 and certain types of cancer.28,29 Estimates of the World Health Organization (WHO) points to approximately 2.7 million deaths worldwide in 2000 that could have been prevented with adequate fruit and vegetable intake, which would reduce global burden of disease by 1.8%.18
As a non-communicable chronic disease prevention strategy, the WHO and the Brazilian Ministry of Health recommend a minimum intake of 400 g per day of fruits and vegetables (equivalent to fi ve portions).29
a Ministério da Saúde. Secretaria de Atenção à Saúde. Coordenação Geral da Política de
The 2002-2003 Pesquisa de Orçamentos Familiares (Household Budget Survey) recommends that the caloric contribution of fruits and vegetables in diet be 2.3%.7 In an analysis of food availability trend in Brazilian households, Levy-Costa et al (2005)17 observed that this contribution has remained low in the last 30 years.
In Brazil, estimates of fruit and vegetable intake among adolescents are scarce and, in their majority, origi-nate from studies conducted with non-representative samples. In addition, the food frequency questionnaire, the method of investigation generally used, does not provide accurate intake measurements.5,21
The present study aimed to analyze fruit and vegetable intake among adolescents and to identify associated factors.
METHODS
A population-based cross-sectional study was conducted in 2003, resulting from the multicenter research project entitled Inquérito de Saúde de São Paulo (ISA-Capital – City of São Paulo Health Survey). The ISA-Capital was developed to collect data on the health and diet of adolescents, adults and elderly individuals of the city of São Paulo, Souhteastern Brazil. The present study used data on 812 adolescents aged between 12 and 19 years. Sample was stratifi ed into clusters, in two stages: census tract and household. More details on the sampling process can be found in Castro et al.6
Qualifi ed interviewers conducted a household survey with a structured questionnaire to investigate demo-graphic, anthropometric, socioeconomic, family and lifestyle characteristics.
Food intake was measured with the 24-hour dietary recall, a method applied according to the multiple-pass method, structured in fi ve steps: 1) quick list, where participants list all the foods and beverages consumed uninterruptedly; 2) forgotten list, where participants are asked about commonly forgotten foods consumed, such as candies, coffees and sodas; 3) time and location of food and beverage intake; 4) detailing cycle, where the way of preparation and amounts consumed are described; and 5) fi nal review, which verifi es whether a certain food consumed during the day was not previously recorded.20 This method helps individuals to recall foods and bever-ages consumed on the day before the interview and to record them in a detailed way, thus reducing dietary measurement errors.24 Adolescents were instructed to record the foods consumed according to household measures and to mention the way of preparation, seasonings and commercial brands.
Information about food intake was reviewed to identify possible errors of completion and to convert household measures of foods and beverages into grams and milli-liters, respectively.23 The Nutrition Data System for Research (NDS) software was used (2007 version, NCC, University of Minnesota, Minneapolis, USA) to obtain nutritional values.
Daily intake (in grams) of fruits and vegetables was calculated to create the fruit and vegetable variable. This variable was comprised of all types of fruits and vegetables, whether they were consumed raw or cooked, peeled or unpeeled, including those used as ingredients in preparations. Researchers chose to quantify foods of the fruit and vegetable group included in preparations such as soups, side dishes and mixed dishes, aiming to measure all and every type of fruit and vegetable consumed, thus avoiding an underestimated intake of this food group. The preparations recorded in the 24-hour recall were quantifi ed, typed and separated into their respec-tive ingredients. Foods from the group of roots and tubers, such as potato, cassava and yam, were excluded because they do not belong to the fruit and vegetable group, according to the Guia Alimentar da População Brasileira (Brazilian Population Food Guide).a Fruit and vegetable intake was considered adequate when equal to or higher than 400 g/day, according to the Ministry of Health recommendations.a
Classifi cation of the nutritional status was based on the cut-off points of Body Mass Index (BMI) according to sex and age proposed by the WHO.22 Anthropometric measurements of self-reported weight and height were used to calculate BMI. Overweight or obese adolescents were grouped and classifi ed as weight excess.
Adolescents who reported alcohol consumption, regardless of the type of beverage, frequency and quantity, were categorized as alcohol drinkers. Current or previous smoking habit was considered to defi ne adolescents as smokers.
Per capita household income was estimated by adding
the monthly incomes of all individuals of a household, divided by the total number of residents. A total of two categories of per capita household income were defi ned (up to one minimum wage; more than one minimum wage), according to the value of a minimum wage at the time of this study (R$ 240.00 or US$ 75.00).
Head of household’s level of education was categorized according to the number of years of school completed (up to eight years; nine years or more).
fruit and vegetable intake and the variables analyzed. These models enable the effect of independent variables on different points of the distribution of the dependent variable to be observed and they are also appropriate when this variable is asymmetric and heteroscedastic, compared to the remaining variables in the model.4
Fruit and vegetable intake (grams/day) was the depen-dent variable. Dichotomous variables (head of house-hold’s level of education, per capita household income, smoking habit, drinking and age group) and continuous variables (energy (kcal/day) and BMI-for-age Z-score) were tested as independent variables.
Modeling was performed using the stepwise-forward procedure and the associated variables whose 95% confi dence interval did not include zero remained in the model. Regression coeffi cients were simultane-ously estimated at every fi ve percentiles in the interval between the 20th and 95th percentiles of the same model to analyze the effect of independent variables throughout the entire distribution. This interval characterizes the distribution points in which fruit and vegetable intake is different from zero. Standard error for each of the estimated coeffi cients was calculated from the 400 replications, using the Bootstrap replication technique. Associations observed in a certain percentile may not be signifi cant in another, because regression coeffi cients were estimated in several points of distribution. The
selection of models that achieved the best adjustments was based on the following two criteria: 1) associa-tion of explanatory variables in the highest number of percentiles; and 2) lowest confi dence intervals of the coeffi cients of the main associated variables.
Stata statistical software (Statistics/Data Analysis, version 10.1, Texas, USA) was used in the analysis. The present study was approved by the Research Ethics Committee of the Faculdade de Saúde Pública da Universidade de São Paulo School of Public Health (Process 381, on 2/13/2001).
RESULTS
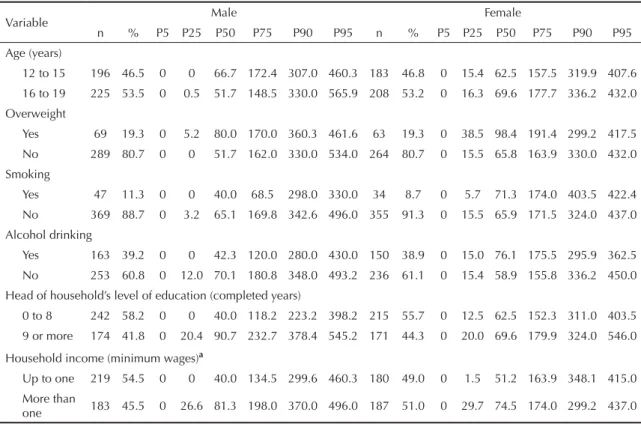
The prevalence of overweight was 19%; smoking habit, 10%; and alcohol drinking, 39%. Among approximately 57% of adolescents, heads of households had eight years of education and 52% belonged to families with incomes equal to or lower than R$ 240.00 (up to one minimum wage) (Table 1).
About 20% of adolescents did not consume fruits and vegetables on the day reported and 6.5% had an adequate intake (≥ 400 g/day). Intake was also adequate between the 90th and 95th percentiles of distribution, in the majority of variables investigated in the analysis stratifi ed by sex (Table 1). The proportion of individuals
Table 1. Percentages of fruit and vegetable intake (in grams) per adolescents, according to sociodemographic characteristics,
lifestyle and nutritional status, stratifi ed by sex. Municipality of São Paulo, Southeastern Brazil, 2003.
Variable Male Female
n % P5 P25 P50 P75 P90 P95 n % P5 P25 P50 P75 P90 P95 Age (years)
12 to 15 196 46.5 0 0 66.7 172.4 307.0 460.3 183 46.8 0 15.4 62.5 157.5 319.9 407.6 16 to 19 225 53.5 0 0.5 51.7 148.5 330.0 565.9 208 53.2 0 16.3 69.6 177.7 336.2 432.0
Overweight
Yes 69 19.3 0 5.2 80.0 170.0 360.3 461.6 63 19.3 0 38.5 98.4 191.4 299.2 417.5 No 289 80.7 0 0 51.7 162.0 330.0 534.0 264 80.7 0 15.5 65.8 163.9 330.0 432.0 Smoking
Yes 47 11.3 0 0 40.0 68.5 298.0 330.0 34 8.7 0 5.7 71.3 174.0 403.5 422.4
No 369 88.7 0 3.2 65.1 169.8 342.6 496.0 355 91.3 0 15.5 65.9 171.5 324.0 437.0 Alcohol drinking
Yes 163 39.2 0 0 42.3 120.0 280.0 430.0 150 38.9 0 15.0 76.1 175.5 295.9 362.5 No 253 60.8 0 12.0 70.1 180.8 348.0 493.2 236 61.1 0 15.4 58.9 155.8 336.2 450.0
Head of household’s level of education (completed years)
0 to 8 242 58.2 0 0 40.0 118.2 223.2 398.2 215 55.7 0 12.5 62.5 152.3 311.0 403.5 9 or more 174 41.8 0 20.4 90.7 232.7 378.4 545.2 171 44.3 0 20.0 69.6 179.9 324.0 546.0
Household income (minimum wages)a
Up to one 219 54.5 0 0 40.0 134.5 299.6 460.3 180 49.0 0 1.5 51.2 163.9 348.1 415.0 More than
one 183 45.5 0 26.6 81.3 198.0 370.0 496.0 187 51.0 0 29.7 74.5 174.0 299.2 437.0
with an intake higher than this recommendation was lower than 10% in all strata analyzed, except for female smokers, whose 90th percentile was 403 g.
The model that best met the criteria had “per capita
household income”, “head of household’s level of education” and “smoking habit” as explanatory vari-ables, adjusted for caloric intake, age group and sex. Figures 1 and 2 show the changes in regression
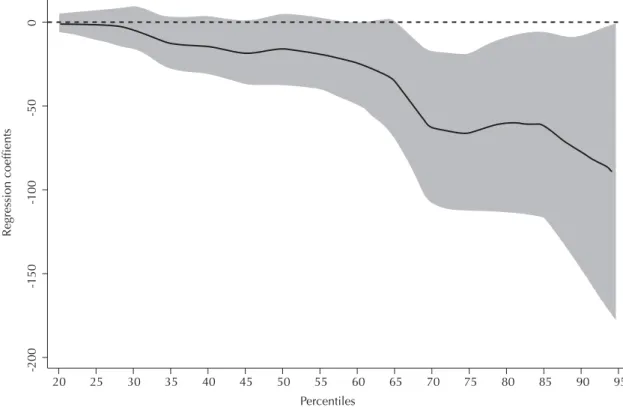
coef-fi cients throughout the distribution, with regards to head of household’s level of education and income. These coeffi cients show the difference of fruit and vegetable intake in grams among the categories of independent variables analyzed. In these graphs, the gray area represents the 95% confi dence interval of coeffi cients estimated in each percentile. Income was positively associated with fruit and vegetable intake in the 20th to 55th percentiles.
Coeffi cients remained almost constant between these percentiles, indicating an intake of approximately 20 g less in the group with the lowest income. Head of household’s higher level of education had a signifi cant infl uence after the 70th percentile and this effect varied with the increase in percentiles. The difference in fruit and vegetable intake between the categories with the highest and lowest level of education was 63 g in the
70th percentile and 77 g in the 90th percentile, regardless of the remaining variables.
After the 45th percentile, the effect of smoking habit on fruit and vegetable intake was signifi cant and it gradu-ally increased until the 75th percentile (Figure 3). The group of smokers showed an intake of 20 g and 65 g less than that of the group of non-smokers in the 45th and 75th percentiles, respectively.
DISCUSSION
In the present study, 6.5% of adolescents met the recommended fruit and vegetable intake (≥ 400 g/ day). Income, head of household’s level of education and smoking habit had an effect on the intake of this food group.
Although there are differences in dietary assessment methods, the results of the present study corroborate those of Brazilian studies on adolescents. Cross-sectional studies using food frequency questionnaires found low intake of fruits and vegetables in Brazilian adolescents.1,25 In a study conducted by the Instituto Nacional do Câncer (INCA), approximately half (45%) of adolescents aged between 15 and 24 years, living in
Figure 1. Quantile regression coeffi cients by per capita household income and fruits and vegetables intake in adolescents.
Municipality of São Paulo, Southeastern Brazil, 2003.
Notes: Coeffi cients adjusted for smoking habit, head of household’s level of education, caloric intake and BMI-per-age Z-score. The gray area corresponds to the 95% confi dence interval. Per capita household income: dichotomous variable, reference category: “more than one minimum wage”.
150
100
50
0
-50
20 25 30 35 40 45 50 55 60 65 70 75 80 85 90 95
Regression coefficients
the city of São Paulo, SP, consumed fruits or vegeta-bles less than fi ve times per week.b Among 8th grade students of municipal public schools of the city of Rio de Janeiro, Southeastern, raw and cooked vegetables were consumed at least fi ve times per week by 20% and 16.5% of the adolescents studied, respectively.5
Recent North American studies have reported a low fruit and vegetable intake among adolescents.11,15,16 However, differences in the categorization of food groups, with the inclusion of potatoes and other tubers in the fruit and vegetable group, restricted the compar-ison of results. Data from the 2003-2004 National Health and Nutrition Examination Survey (NHANES III), for example, showed that potatoes represented approximately 41% of the total intake of vegetables.15
Quantile regression models, used to investigate the association between fruit and vegetable intake and explanatory variables, are extensively applied in econometrics, although being rarely used in health sciences, especially in nutritional epidemiology. The study conducted by Variyam et al27 on factors associ-ated with nutrient intake using such models is one of
the exceptions. In the present study, the choice for this particular model is justifi ed by the asymmetry to the right of the curve of fruit and vegetable intake and to the heteroscedasticity of the dependent variable, in relation to the explanatory variables. In these cases, models based on the method of minimum squares create residues that can have a non-uniform variance, resulting in inferences originated from the biased coeffi cients. When there is no homoscedasticity, certain percentiles may be more infl uenced by explanatory variables than others. Finally, quantile regression models are additive, i.e. regression coeffi cients are interpreted as the change in a certain percentile of the dependent variable, caused by the change of an independent variable unit.
Multiple analyses show differences in the infl uence of income and head of household’s level of education on fruit and vegetable intake among adolescents, similarly to what was observed in studies that used linear regres-sion models.26 Income was signifi cantly associated in the lower intake percentiles (p20 to p55), whereas level of education was only associated in the highest percentiles of distribution (p70 to p95).
b Instituto Nacional de Câncer. Inquérito domiciliar sobre comportamentos de risco e morbidade referida de doenças e agravos não
transmissíveis. Rio de Janeiro; 2005.
Figure 2. Quantile regression coeffi cients by head of household’s level of education and fruits and vegetables intake in
ado-lescents. Minicipality of São Paulo, Southeastern Brazil, 2003.
Notes: Coeffi cients adjusted for smoking habit, caloric intake and BMI-per-age Z-score. The gray area corresponds to the 95% confi dence interval. Head of household’s level of education: dichotomous variable, reference category was the group with the highest level of education.
0
-50
-100
20 25 30 35 40 45 50 55 60 65 70 75 80 85 90 95
-150
-200
Regression coeffients
Income can be a determinant among adolescents who consume low amounts of fruits and vegetables (75 g or less, i.e. lower than one daily portion). Among those with a higher intake (between 140 g and 460 g), head of household’s level of education became a determinant.
The role of variables in fruit and vegetable intake has been investigated in different studies.7,26 Income infl u-ences access to and availability of fi nancial resources to purchase more expensive foods, such as fruits and vegetables.25 In the present study, where 52% of adoles-cents had a per capita household income equal to or lower than R$ 240.00 (US$ 75.00), low intake of fruits and vegetables can be attributed to the lower purchasing power of families, which would restrict the amount of fruits and vegetables available in the household.
Level of education, in its turn, would infl uence the foods selected, because it provides an individual with the ability to assimilate messages from nutritional education programs and understand the importance of eating as a way to promote health.26 In the present study, the higher level of education of a head of household could infl uence adolescents to consume more fruits and vegetables, as a result of this head of household’s choice for healthier foods, once they are main responsible for family decisions.
Smoking habit has an effect on fruit and vegetable intake between the 45th and 75th percentiles of intake,
regardless of the infl uence of income and head of household’s level of education. These fi ndings suggest that the effects of smoking habit on fruit and vegetable intake occur on both low (50 g) and moderate levels of intake (165 g). In a population study conducted in Canada, Birkett3 observed that smokers consumed a significantly lower amount of fruits and natural fruit juices than non-smokers. In addition, those who consumed a higher number of cigarettes per day were four to six times more likely to eat less fruits than what is recommended. Although less expressive, similar results of fruit and vegetable intake were found. Smokers, however, have increased requirements of antioxidants present in the fruit and vegetable group, because they have lower plasmatic levels of these substances, caused by the excessive amount of free radicals found in cigarette smoke.14
Fruit and vegetable intake for each individual was obtained from one single 24-hour recall. This procedure fails to capture daily variations, thus increasing distri-bution variance.8 An intake lower than the median can be underestimated, whereas that which is higher can be overestimated. Considering the fact that the recom-mendation of 400g/day of fruit and vegetable intake was met in the higher percentiles of distribution, it is possible that the proportion of adolescents with an intake lower than this value is underestimated. Another effect of the increase in variance is the attenuation of measures of
Figure 3. Quantile regression coeffi cients by smoking habit and fruits and vegetables intake in adolescents. Municipality of
São Paulo, Southeastern Brazil, 2003.
Notes: Coeffi cients adjusted for head of household’s level of education, caloric intake and BMI-per-age Z-score. The gray area corresponds to the 95% confi dence interval. Smoking habit: dichotomous variable, reference category was the group of non-smokers.
20
-300
-200
-100
0
100
25 30 35 40 45 50 55 Percentiles
60 65 70 75 80 85 90 95
association between intake and explanatory variables. This implies a possible underestimation of the coeffi -cients found. It is assumed that the associations observed would continue to exist if more than one 24-hour recall was used one per individual, although with coeffi cients of higher magnitude. Despite the fact that only one dietary measurement reduces the accuracy of percentiles of intake and attenuates regression coeffi cients, its use does not invalidate the conclusions of this study.
Fruit and vegetable intake is a socially desirable behavior, which can result in over reporting of these foods.13,19 However, this type of bias does not seem to be a relevant source of error in the sample studied, once a low percentage of adolescents met the recommenda-tions (6.5%) and a higher percentage did not report fruit and vegetable intake (20%).
Another possible limitation refers to the self-reported
weight and height, used to calculate the BMI. However, the use of an anthropometric index based on self-reported measurements is described as favorable in a population of adolescents.9;10
Fruit and vegetable intake among adolescents of the city of São Paulo is signifi cantly lower than the current recommendations and it is infl uenced by income, head of household’s level of education and smoking habit. Intersectoral actions, aimed to encourage fruit and vegetable intake and the adoption of healthy lifestyles, can improve this situation. The implemen-tation of public policies to reduce the prices of fruits and vegetables, the development of mechanisms that promote an increase in household income and the adop-tion of multiple nutriadop-tional educaadop-tion acadop-tions in schools are measures that help to increase fruit and vegetable intake among Brazilian adolescents.
1. Andrade RG, Pereira RA, Sichieri R. Consumo alimentar de adolescentes com e sem sobrepeso do Município do Rio de Janeiro. Cad Saude Publica. 2003;19(5):1485-95. DOI:10.1590/S0102-311X2003000500027
2. Bazzano LA. Dietary Intake of fruit and vegetable and risk of diabetes mellitus and cardiovascular diseases. Geneva: WHO; 2005.
3. Birkett NJ. Intake of fruits and vegetables in smokers.
Public Health Nutr. 1999;2(2):217-22. DOI:10.1017/
S1368980099000270
4. Buchinsky M. Recent advancens in quantile regression models: a practical guideline for empirical research. J
Hum Resour. 1998;33(1):88-126.
5. Castro IRR, Cardoso LO, Engstrom EM, Levy RB, Monteiro CA. Vigilância de fatores de risco para doenças não transmissíveis entre adolescentes: a experiência da cidade do Rio de Janeiro, Brasil. Cad
Saude Publica. 2008;24(10):2279-88. DOI:10.1590/
S0102-311X2008001000009
6. Castro MA, Barros RR, Bueno MB, César CLG, Fisberg RM. Trans fatty acids intake among the population of the city of São Paulo, Brazil. Rev Saude
Publica. 2009;43(6):991-7.
DOI:10.1590/S0034-89102009005000084
7. Claro RM, Carmo HCE do, Machado FMS, Monteiro CA. Renda, preço dos alimentos e participação de frutas e hortaliças na dieta. Rev Saude Publica. 2007;41(4):557-64. DOI:10.1590/S0034-89102007000400009
8. Dodd KW, Guenther PM, Freedman LS, Subar AF, Kipnis V, Midthune D, et al. Statistical methods for estimating usual intake of nutrients and foods: a review of the theory. J Am Diet Assoc. 2006;106(10):1640-50. DOI:10.1016/j.jada.2006.07.011
9. Farias Júnior JC. Validade das medidas auto-referidas de peso e estatura para o diagnóstico do estado nutricional de adolescentes. Rev. Bras Saude Mater
Infant. 2007;7(2):167-74.
DOI:10.1590/S1519-38292007000200007
10. Fonseca H, Silva AM, Matos MG, Esteves I, Costa P, Guerra A, et al. Validity of BMI based on self-reported weight and height in adolescents. Acta
Paediatr. 2010;99(1):83-8.
DOI:10.1111/j.1651-2227.2009.01518.x
11. Guenther PM, Dodd KW, Reedy J, Krebs-Smith SM. Most Americans eat much less than recommended amounts of fruits and vegetables. J
Am Diet Assoc. 2006;106(9):1371-9. DOI:10.1016/j.
jada.2006.06.002
12. He FJ, Nowson CA, MacGregor GA. Fruit and vegetable consumption and stroke: meta-analysis of cohort studies. Lancet. 2006;367(9507):320-6. DOI:10.1016/S0140-6736(06)68069-0
13. Herbert JR, Hurley TG, Peterson KE, Resnicow K, Thompson FE, Yaroch AL, et al. Social desirability trait infl uences on self-reported dietary measures among diverse participants in a multicenter multiple risk factor trial. J Nutr. 2008;138(1):226S-34S.
14. Institute of Medicine. Dietary reference intakes for vitamin C, vitamin E, selenium, and carotenoids. Washington, DC: National Academy Press; 2000.
15. Kimmons J, Gillespie C, Seymour J, Serdula M, Blanck HM. Fruit and vegetable intake among adolescents and adults in the United States: percentage meeting individualized recommendations. Medscape J Med. 2009;11(1):26.
16. Larson NI, Neumark-Sztainer DR, Harnack LJ, Wall MM, Story MT, Eisenberg ME. Fruit and vegetable intake correlates during the transition to young adulthood. Am J Prev Med. 2008;35(1):33-7. DOI:10.1016/j.amepre.2008.03.019
17. Levy-Costa RB, Sichieri R, Pontes NS, Monteiro CA. Disponibilidade domiciliar de alimentos no Brasil: distribuição e evolução (1974-2003). Rev Saude
Publica. 2005;39(4):530-40.
DOI:10.1590/S0034-89102005000400003
The research project was funded by the Conselho Nacional de Desenvolvimento Científi co e Tecnológico (CNPq – National Process: 402111.05-2)
The authors declare no confl icts of interest. 18. Lock K, Pomerleau J, Altmann DR, McKee M.
The global burden of disease attributable to low consumption of fruit and vegetables: implications for the global strategy on diet. Bull World Health
Organ. 2005;83(2):100-8.
DOI:10.1590/S0042-96862005000200010
19. Miller TM, Abdel-Msksoud MF, Crane LA, Marcus AC, Byers TE. Effects of social approval bias on self-reported fruit and vegetable consumption: a randomized controlled trial. Nutr J. 2008;7:18. DOI:10.1186/1475-2891-7-18
20. Moshfegh AJ, Rhodes DG, Baer DJ, Murayi T, Clemens JC, Rumpler WV, et al. The US Department of Agriculture automated multiple-pass method reduces bias in the collection of energy intakes. Am J Clinl Nutr. 2008;88(2):324-32.
21. Nahas MK, Barros MVG, Goldfi ne BD, Lopes AS, Hallal PC, Farias Júnior JC, et al. Physical activity and eating habits in public high schools from different regions in Brazil: the Saude na Boa Project. Rev Bras
Epidemiol. 2009;12(2):270-7.
DOI:10.1590/S1415-790X2009000200016
22. Onis M de, Onyango AW, Borgui E, Siyam A, Nishida C, Siekmann J. Development of a WHO growth reference for school-aged children and adolescents.
Bull World Health Organ. 2007;85(9):660-7.
23. Pinheiro ABV, Lacerda EMA, Benzecry EH, Gomes MCS, Costa VM. Tabela para avaliação de consumo
alimentar em medidas caseiras. 4. ed. São Paulo: Atheneu; 2000.
24. Raper N, Perloff B, Ingwersen L, Steinfeldt L, Anand J. An overview of USDA’s Dietary Intake Data System. J Food Compost Anal. 2004;17(3/4):545–55. DOI:10.1016/j.jfca.02.013
25. Santos JS, Costa MCO, Nascimento Sobrinho CL, Silva MCM, Souza KEP, Melo BO. Perfi l antropométrico e consumo alimentar de adolescentes de Teixeira de Freitas - Bahia. Rev Nutr. 2005;18(5):623-32. DOI:10.1590/S1415-52732005000500005
26. Turrell G, Hewitt B, Patterson C, Oldenburg B. Measuring socio-economic position in dietary research: is choice of socio-economic indicator important?
Public Health Nutr. 2003;6(2):191-200. DOI:10.1079/
PHN2002416
27. Variyam JN, Blaylock J, Smallwood D. Characterizing the distribution of macronutrient Intake among U.S. adults: a quantile regression approach. Am J Agric Econ. 2002;84(2):454-66.
28. World Cancer Research Fund; American Institute for Cancer Research. Food, nutrition, physical activity and the prevention of cancer: a global perspective. Washington, DC; 2007.