Introduction
Since the 1980s, the prevalence of nutritional malnutrition has decreased and the prevalence of overweight and obesity in chil-dren and adolescents has increased, in Brazil1. These changes in weight status are mainly due to the implementation of public policies that have prioritized the decline of malnutrition, but the opposite situation (overweight) has become uncontrolled around the world1. In addition, the adoption of sedentary behaviors2 and physical inactivity are also factors associated with being overweight in the pediatric population3.
Being overweight leads to health hazards, such as respiratory failure, diabetes, hyperlipidemia, arterial hypertension and cardiac complications4. These diseases usually manifest in adulthood, but their onset begins at younger ages, especially in obese children and adolescents4. In this sense, the diagnoses of overweight and obesity in childhood or adolescence is of great relevance to the area of public health, since habits and lifestyle acquired in child-hood and adolescence tend to remain in adult life5.
To estimate body fat accumulation, there are reference methods such as plethysmography and dual X-ray absorptiometry (DXA). However, these methods are costly and dificult to access6. Thus, anthropometric measures such as body mass, height, skinfolds and body perimeters are alternatives accessible to the population7. In this perspective, body mass index (BMI) has been a method used to assess weight status and health risk in children and adolescents8.
Some criteria have been proposed with the purpose of es-tablishing BMI cutoff points for children and adolescents9,10,11. However, studies have pointed out differences in the prevalence of overweight and obesity among BMI classiication criteria12,13,14,15. The Conde and Monteiro, WHO and IOTF criteria considered
sex and age for the construction of cutoff points; however, they have been established based on data from different populations. Thus, sociocultural and economic aspects, such as lifestyle, income, and schooling may inluence such differences in the prevalence of overweight16.
An international survey with 6,070 children and adolescents compared WHO and IOTF BMI classiication criteria and found that the WHO criterion classiied more overweight individuals when compared to the IOTF criterion. In addition, the WHO criteria presented greater sensitivity, while the IOTF criterion had higher speciicity in the classiication of overweight individuals15.
A study with Brazilian adolescents (11-17 years old), aimed at comparing three BMI reference criteria14 , found higher preva-lence of overweight using the Conde and Monteiro reference, followed by WHO and IOTF references. In addition, the factors that were associated with overweight were being male and the age group of 11 to 1414. Another study also found higher prevalence of overweight and obesity using the Conde and Monteiro cutoff points, followed by WHO and IOTF classiication12.
The importance of this investigation should be highlighted, since most studies have investigated the prevalence of “over-weight” (overweight and obesity) as a single weight status, grouping both categories (overweight + obesity11,12), but it is necessary to investigate them separately because prevalence, associated factors, and agreement among methods can be dif-ferentiated between the classiication of overweight and obese. Based on the above, the aim of the study was to analyze the prevalence and sociodemographic factors associated with the statuses overweight and obese in adolescents from a city in southern Brazil according to three overweight criteria (WHO, Conde and Monteiro and IOTF).
Original Article (short paper)
Comparison of three criteria for overweight and
obesity classiication among adolescents from
southern Brazil
Diego Augusto Santos Silva1*, Priscila Custódio Martins1, Eliane Cristina de Andrade Gonçalves1
1Universidade Federal de Santa Catarina, UFSC, Florianópolis, SC, Brazil
Abstract — Aim: To estimate the prevalence of the classiications of overweight and obesity in adolescents according
to three criteria for nutritional status classiication (Conde & Monteiro, International Obesity Task Force - IOTF and Word Health Organization - WHO), and to investigate whether sociodemographic factors associated with overweight and obesity differ among the three criteria. Method: cross-sectional study with 1,132 adolescents (14-19 years old) living in Brazil. Body Mass Index (BMI) was classiied according to three criteria for nutritional status. A self-administered questionnaire was used to collect sociodemographic information. Sexual maturation was measured by self-reported Tanner stage ratings. Multinomial logistic regression was used to estimate the Odds Ratio and 95% conidence intervals.
Results: The prevalence of the classiication “overweight” (from here on referred to simply as “overweight”) was 23.1%
for WHO; 23.7% for Conde & Monteiro criteria: and 19.2% for IOTF. Both boys and girls aged 17-19 were more likely to be overweight using the WHO and Conde & Monteiro criteria than those using the IOTF criteria. Girls in the post-pubertal maturational stage were less likely of being overweight or obese using the three criteria. Conclusion: The three criteria result in different prevalence measures, with WHO and Conde and Monteiro criteria being more approximate in terms of prevalence and correlated factors when compared to IOTF criteria.
Methods
This study is characterized as school-based and cross-sectional and was approved by the Ethics Committee for Research with Human Beings of the Federal University of Santa Catarina (No. 746.536 of 2014) and developed between August and November 2014. The research was conducted in accordance with the Helsinki Declaration.
The population (n = 5,182) was composed of adolescents aged 14-19 enrolled in state public schools in the city of São José, which has 209,804 inhabitants and a Municipal Human Development Index of 0.80917. São José has territorial boundaries with Florianópolis and they together form the most populous metropolitan region of Santa Catarina, Brazil.
The sampling process was determined in two stages: 1) strati -ied by state public high schools (n = 11); 2) classes clustered considering study shift and school grade (n = 170 classes). In stage two, all high school students who were present in the classroom on the days of data collection were invited to par-ticipate in the study.
For the sample calculation, unknown prevalence for the outcome (50%), tolerable error of ive percentage points, 95% conidence level and delineation effect of 1.5 were adopted, adding 20% for losses and refusals, plus 20% for association study. A sample of 751 adolescents was estimated. However, due to conglomerate sampling, all students in the classes were invited to participate in the survey, resulting in 1,132 students.
Students were deined as eligible if they were enrolled in the state education network, in the classroom on the day of data collection and between 14 and 19 years old. Adolescents who did not want to participate in the study were considered refusals and those with incomplete questionnaires or who did not per-form one or more physical test were considered sample losses.
Dependent variable
BMI was the dependent variable and to calculate this index (body mass / height²), height was collected by means of Sanny® stadiometer with tripod (São Paulo, Brazil) and body mass with G-tech® digital scale (Zhongshan, China), according to the standardization of the International Society for the Advancement of Kinanthropometry (ISAK)18. Anthropometric measurements were obtained by a single evaluator with level 1 ISAK certiica -tion. The evaluator was trained before ield work.
BMI was categorized as low weight, normal weight, over-weight and obese according to cutoff points of the International Obesity Task Force (IOTF)8, Conde and Monteiro10, and the World Health Organization (WHO)11. Cutoff points vary ac-cording to the age and sex of adolescents.
Independent variables
The independent variables were age, which was categorized as 14-16 and 17-19; economical level; and sexual maturation. The present study did not make the instruments reproducible in the
this sample. However, all instruments are valid for their given purpose. Economic level was identiied through the questionnaire of the Brazilian Association of Research Companies19, which divides the population into ive categories in decreasing order of purchasing power (“A1”, “A2”, “B1”, “B2” “C1”, “C2”, “D” and “E”). Due to the low frequency of adolescents in extreme categories (“A1”: 0.0%; “A2”: 4.1%; “B1”: 20.9%; “B2”: 44.6%; “C1”: 24.5%; “C2”: 5.3%; “D”: 0.6%; “E”: 0.0%), this variable was dichotomized into high level (“A1”, “A2”,”B1”,”B2”) and low level (“C1”,”C2”,”D”,”E”). Sexual maturation was self-assessed by adolescents, according to criteria proposed by Tanner (1962)20, validated and reproducible in the Brazilian population, with r values of 0.7121. Stages were determined by self-assessment (igures) of breast development (girls) and genitals (boys), after individual and previous explanation of the instrument by the re-searcher, always of the same sex as the adolescent. This variable was classiied as “Pre-pubertal / pubertal” and “Post-pubertal”, because the frequency of pre-pubertal adolescents was low.
Statistical analysis
Descriptive statistics (mean, standard deviation, absolute and relative frequency) was used for sample characterization. The Mann Whitney U test was used to compare values of continu-ous variables according to sex, since none of the variables had normal distribution according to normality histograms.
The heterogeneity Chi-square test was used to verify whether or not there was a statistical difference in the weight status dis-tribution according to independent variables. This information was run in each of the weight status distributions, according to IOTF, Conde and Monteiro and WHO cutoff points.
Multinomial logistic regression (reference category = normal weight) was used to estimate odds ratios and 95% conidence intervals were used in order to verify association between weight status and independent variables. Different models were used according to the cut-off point for BMI (IOTF, Conde and Monteiro and WHO). The crude and adjusted analyses were used. In the adjusted analysis, all independent variables were inserted into the model, regardless of their p value in the crude analysis. Variables with p value <0.05 were considered associated with the outcome. Analyses were performed with the total sample and stratiied by sex using the SPPSS software version 22.0.
Results
Overall, 1,132 adolescents (mean age 16.2 ± 1.14) participated in the study. Boys had higher mean values for the variables age, body mass and height when compared to girls. The majority of the sample was female (54.2%), aged between 14 and 16 years (59.8%) and were from a high economic level (69.5%). A small part of the sample (n = 124) had no body mass and height values, therefore, BMI was not possible to obtain.
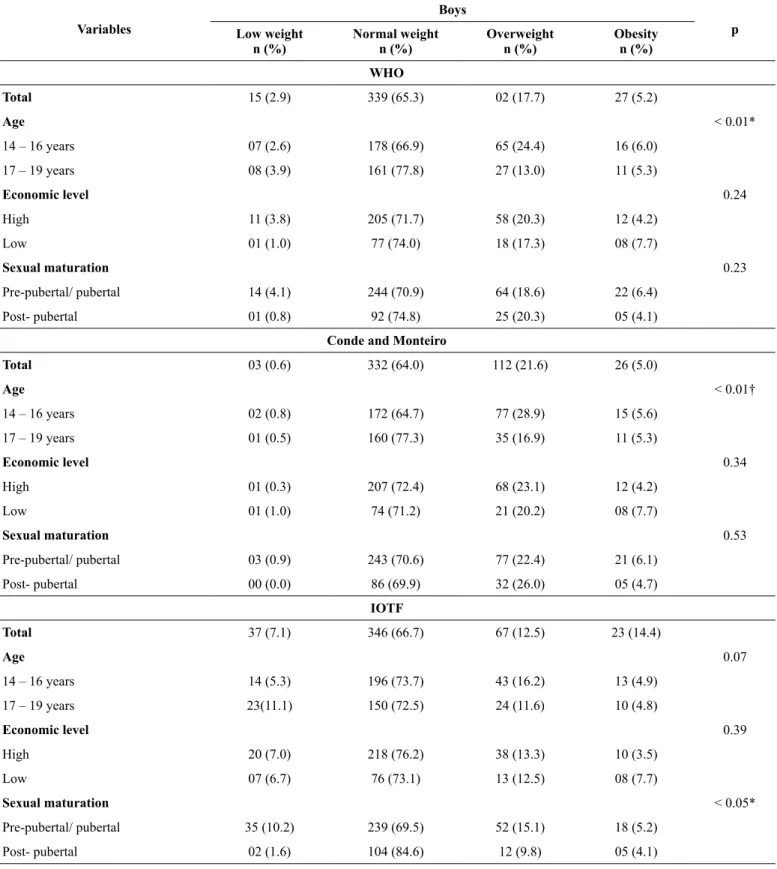
5.2%, 5.0% and 14.4% for cutoff points suggested by WHO, Conde and Monteiro and IOTF, respectively (Table 1).
For BMI cutoff points suggested by WHO and Conde and Monteiro, boys aged 14-16 years had higher prevalence of
overweight compared to boys aged 17-19. For cutoff points sug-gested by IOTF, boys at the pre-pubertal / pubertal maturational stage presented higher prevalence of overweight compared to those at the post-pubertal stage (Table 1).
Table 1. Sample distribution in relation to sociodemographic factors associated with nutritional status classiication according to three different
criteria for boys (n =519, São José, Santa Catarina, Brazil
Variables
Boys
p Low weight
n (%)
Normal weight n (%)
Overweight n (%)
Obesity n (%)
WHO
Total 15 (2.9) 339 (65.3) 02 (17.7) 27 (5.2)
Age < 0.01*
14 – 16 years 07 (2.6) 178 (66.9) 65 (24.4) 16 (6.0)
17 – 19 years 08 (3.9) 161 (77.8) 27 (13.0) 11 (5.3)
Economic level 0.24
High 11 (3.8) 205 (71.7) 58 (20.3) 12 (4.2)
Low 01 (1.0) 77 (74.0) 18 (17.3) 08 (7.7)
Sexual maturation 0.23
Pre-pubertal/ pubertal 14 (4.1) 244 (70.9) 64 (18.6) 22 (6.4)
Post- pubertal 01 (0.8) 92 (74.8) 25 (20.3) 05 (4.1)
Conde and Monteiro
Total 03 (0.6) 332 (64.0) 112 (21.6) 26 (5.0)
Age < 0.01†
14 – 16 years 02 (0.8) 172 (64.7) 77 (28.9) 15 (5.6)
17 – 19 years 01 (0.5) 160 (77.3) 35 (16.9) 11 (5.3)
Economic level 0.34
High 01 (0.3) 207 (72.4) 68 (23.1) 12 (4.2)
Low 01 (1.0) 74 (71.2) 21 (20.2) 08 (7.7)
Sexual maturation 0.53
Pre-pubertal/ pubertal 03 (0.9) 243 (70.6) 77 (22.4) 21 (6.1)
Post- pubertal 00 (0.0) 86 (69.9) 32 (26.0) 05 (4.7)
IOTF
Total 37 (7.1) 346 (66.7) 67 (12.5) 23 (14.4)
Age 0.07
14 – 16 years 14 (5.3) 196 (73.7) 43 (16.2) 13 (4.9)
17 – 19 years 23(11.1) 150 (72.5) 24 (11.6) 10 (4.8)
Economic level 0.39
High 20 (7.0) 218 (76.2) 38 (13.3) 10 (3.5)
Low 07 (6.7) 76 (73.1) 13 (12.5) 08 (7.7)
Sexual maturation < 0.05*
Pre-pubertal/ pubertal 35 (10.2) 239 (69.5) 52 (15.1) 18 (5.2)
Post- pubertal 02 (1.6) 104 (84.6) 12 (9.8) 05 (4.1)
The prevalence of overweight among girls was 16.3%, 14.7% and 14.7% for cutoff points suggested by WHO, Conde and Monteiro and IOTF, respectively. The prevalence of obesity was 7.5%, 7.0% and 6.5% for cutoff points sug-gested by WHO, Conde and Monteiro and IOTF, respec-tively (Table 2).
For girls, when considering the three criteria for nutritional status classiication, those in the post-pubertal stage of sexual
maturation had higher prevalence of overweight and obesity than girls in the pre-pubertal / pubertal stage (Table 2).
In boys, the adjusted multinomial regression analysis revealed a similarity in the factors associated with overweight between cutoff points proposed by WHO and Conde and Monteiro. These results indicated that boys in the age group of 17 to 19 were more likely to be overweight (Table 3). For obesity, no investigated factor was associated.
Table 2. Sample distribution in relation to sociodemographic factors associated with nutritional status classiication according to three different
criteria for girls (n =613, São José, Santa Catarina, Brazil).
Variables
Girls
p Low weight
n (%)
Normal weight n (%)
Overweight n (%)
Obesity n (%)
WHO
Total 01 (0.2) 388 (63.3) 100 (16.3) 46 (7.5)
Age 0.15
14 – 16 years 00 (0.0) 225 (70.3) 68 (21.2) 27 (8.4)
17 – 19 years 01 (0.5) 163 (75.8) 32 (14.9) 19 (8.8)
Economic level 0.63
High 00 (0.0) 212 (71.6) 56 (18.9) 28 (9.5)
Low 01 (0.6) 117 (71.8) 32 (19.6) 13 (8.0)
Sexual maturation < 0.01†
Pre-pubertal/ pubertal 01 (0.3) 296 (80.2) 52 (14.1) 20 (5.4)
Post- pubertal 00 (0.0) 89 (74.8) 48 (29.4) 26 (16.0)
Conde and Monteiro
Total 10 (1.6) 392 (63.9) 90 (14.7) 43 (7.0)
Age 0.07
14 – 16 years 03 (0.9) 230 (71.9) 62 (19.4) 25 (7.8)
17 – 19 years 07 (3.3) 162 (75.3) 28 (13.0) 01 (8.4)
Economic level 0.92
High 06 (2.3) 215 (72.6) 49 (16.6) 16 (8.8)
Low 04 (2.5) 118 (72.4) 29 (17.8) 12 (7.4)
Sexual maturation
Pre-pubertal/ pubertal 10 (2.7) 295 (79.9) 47 (22.7) 17 (14.6) < 0.01†
Post- pubertal 00 (0.0) 94 (57.7) 43 (26.4) 26 (26.0)
IOTF
Total 41 (6.7) 364 (59.4) 90 (14.7) 40 (6.5)
Age 0.39
14 – 16 years 20 (6.2) 219 (68.4) 58 (18.1) 23 (7.2)
17 – 19 years 21 (9.80) 145 (67.4) 32 (14.9) 17 (7.9)
Economic level 0.90
High 23 (7.8) 201 (67.9) 48 (16.2) 24 (8.1)
Sexual maturation < 0.01†
Pre-pubertal/ pubertal 37 (10.0) 270 (73.2) 48 (13.0) 14 (3.8)
Post- pubertal 04 (2.5) 91 (55.8) 42 (25.8) 26 (16.0)
WHO: World Health Organization. IOTF: International Obesity Task Force. * Chi-square and Fisher’s exact test † (p <0.05).
Table 3. Adjusted multinomial regression analysis between socio-demographic factors, sexual maturation and overweight and obesity according
to the three classiication criteria for boys (n = 519, São José, Santa Catarina, Brazil).
Variables
Boys
Overweight Adjusted analysis *
Obesity Adjusted analysis *
OR CI 95% OR CI 95%
WHO
Age
14 – 16 years 1 1
17 – 19 years 2.55 (1.49-4.34)† 1.54 (0.67-3.52)
Economic level
High 1 1
Low 1.12 (0.59-2.12) 0.53 (0.20-1.38)
Sexual maturation
Pre-pubertal/ pubertal 1 1
Post- pubertal 0.93 (0.54-1.60) 2.16 (0.72-6.49)
Conde and Monteiro
Age
14 – 16 years 1 1
17 – 19 years 2.10 (1.32-3.33)† 1.32 (0.59-2.97)
Economic level
High 1 1
Low 1.07 (0.61-1.90) 0.54 (0.21-1.39)
Sexual maturation
Pre-pubertal/ pubertal 1 1
Post- pubertal 0.88 (0.54-1.43) 1.50 (0.55-4.12)
IOTF
Age
14 – 16 years 1 1
17 – 19 years 1.48 (0.76-2.86) 1.01 (0.37-2.72)
Economic level
High 1 1
Low 1.10 (0.52-2.30) 0.41 (0.15-1.11)
Sexual maturation
Pre-pubertal/ pubertal 1 1
Post- pubertal 1.69 (0.86-3.33) 2.03 (0.66-6.19)
In girls, the adjusted multinomial regression analysis re-vealed a similarity in the factors associated with overweight between cutoff points proposed by WHO and Conde and Monteiro, with girls aged 17-19 being more likely to have
this condition. For obesity, associated factors were similar among the three classiication criteria, and girls in the post-pubertal maturation stage were more likely to have this condi-tion (Table 4).
Table 4. Multinomial regression analysis adjusted between socio-demographic factors, sexual maturation and overweight and obesity according
to the three classiication criteria for girls (n = 613, São José, Santa Catarina, Brazil).
Variables
Girls
Overweight Adjusted analysis *
Obesity Adjusted analysis *
OR CI 95% OR CI 95%
WHO
Age
14 – 16 years 1 1
17 – 19 years 1.67 (1.03-2.71)† 1.15 (0.60-2.17)
Economic level
High 1 1
Low 0.87 (0.52-1.46) 1.09 (0.53-2.23)
Sexual maturation
Pre-pubertal/ pubertal 1 1
Post- pubertal 0.31 (0.19-0.49)† 0.22 (0.12-0.43)†
Conde and Monteiro
Age
14 – 16 years 1 1
17 – 19 years 1.75 (1.05-2.92)† 1.04 (0.54-1.99)
Economic level
High 1 1
Low 0.85 (0.49-1.45) 1.00 (0.48-2.06)
Sexual maturation
Pre-pubertal/ pubertal 1 1
Post- pubertal 0.32 (0.20-0.53)† 0.22 (0.11-0.42)†
IOTF
Age
14 – 16 years 1 1
17 – 19 years 1.14 (0.67-1.95) 1.01 (0.49-2.10)
Economic level
High 1 1
Low 0.78 (0.46-1.32) 0.96 (0.45-2.04)
Sexual maturation
Pre-pubertal/ pubertal 1 1
Post- pubertal 0.31 (0.18-0.52)† 0.17 (0.08-0.36)†
Discussion
The results showed a greater concordance in the prevalence of overweight and obesity between WHO and Conde and Monteiro criteria and showed a slight increase in the prevalence of over-weight (overover-weight + obesity) when considering the cutoffs of Conde and Monteiro (23, 7%) compared to WHO (23.1%) and IOTF (19.2%). These differences in the prevalence of overweight and obesity among the three different BMI classiication criteria have also been reported in other studies 14, 15. A study carried out with 7 to 15 year-old schoolchildren from Rio Grande do Sul, Brazil, found that the prevalence of overweight and obesity was higher in comparison to WHO and IOTF criteria13.
The study by Pelegrini, Silva, Gaya, Petroski14 with adoles-cents aged 11-17 from all geographic regions of Brazil found a prevalence of overweight (overweight + obesity) of 20.6% according to the criteria of Conde and Monteiro; 20.1% for the WHO criteria; and 15.3% for the IOTF criteria14. The au-thors also observed greater agreement between cutoff points of Conde and Monteiro and WHO14. A possible explanation for the higher prevalence of overweight and obesity found using the BMI classiication criteria proposed by Conde and Monteiro is the fact that this reference was constructed using data of Brazilian children and adolescents, revealing the high prevalence of excess weight in this population. In Brazil, the process of nutritional transition, characterized by a decline in the prevalence of nutritional malnutrition and an increase in the prevalence of overweight and obesity1 , has been changing the weight status scenario.
According to the WHO and Conde and Monteiro cutoff points, boys had higher overweight values compared to girls. However, when considering only obesity, girls presented higher prevalence values compared to boys. In turn, according to the IOTF cutoff points, boys presented lower prevalence of overweight and higher prevalence of obesity than girls. These differences among classiication criteria can be explained by the sociocultural differences of each population in relation to the cutoff point, since IOTF criteria used a population of six countries: Brazil, Hong Kong, England, the Netherlands, Singapore and the United States9. The WHO classiication was developed from data of American adolescents in the age group of 5 to 19 years of age11.The Conde and Monteiro crite-ria were constructed from data of Brazilian adolescents (2-19 years old)10. Lifestyle, economic level and sexual maturation are factors that differentiate populations of each country and that may inluence the growth curves and, consequently, the cutoff points for BMI7.
Boys and girls aged 17-19 were more likely to be overweight, according to WHO and Conde and Monteiro classiication. Pelegrini, Silva, Gaya, Petroski14 observed that boys and ado-lescents aged 11-12 and 13-14 years old were more likely to be overweight and obese in the three BMI classiication criteria when compared to adolescents aged 15-17 14. Physical inactivity and the adoption of sedentary behaviors are factors associated with higher prevalence of overweight21. Physical activity practices tend to decrease with age; in addition, factors such as entry into the labor market, many hours of study and lower participation
of parents in school are factors associated with lower levels of physical activity and, consequently, increased prevalence of overweight in older adolescents22.
Girls in the post-pubertal maturational stage were less likely to be overweight and obese according to the three classiication criteria. This can be explained by changes in body composition, such as increased fat deposits in adolescents, especially in the pubertal maturational stage, which may lead to changes in body mass23 . In addition, growth spurts, an increase and distribution of adipose tissue in certain parts of the body, an increase of subcutaneous fat and of leptin concentrations, responsible for body weight and energy balance regulation, are changes that occur during puberty23.
One of the limitations of this study is related to the collection of information through self-administered questionnaire, since there is the possibility of response bias for the identiication of some variables, such as the economic level. In addition, ado-lescents aged 10-13 were not investigated, which is a period of great changes in sexual maturation, such as puberty. However, sexual maturation was one of the variables collected and used in multivariate models. The cross-sectional design of the study is also a limitation because it doesn’t permit the establishment of causal relations between the dependent variable and the independent variables.
Among the strengths of this study, the sample representative-ness stands out, as it permitted inferences to be maderegarding schoolchildren from other municipalities with characteristics similar to the sample of this study. The information presented is useful for the public health area regarding which criteria have the greatest agreement, considering the importance of the diagnosis of overweight and obese in Brazilian adolescents for the prevention of diseases associated with this condition. The results found in the present study could be used by health pro-fessionals in choosing the method of classiication of BMI most appropriate for the population under investigation. In addition, it may prioritize the subgroups of adolescents most affected by overweight in lifestyle change strategies.
It was concluded that the three criteria for BMI classiication investigated showed different results, with WHO and Conde and Monteiro criteria being more approximate in terms of preva-lence and correlated factors when compared to IOTF criteria. According to WHO and Conde and Monteiro cutoff points, the factor associated with overweight in males and females was the age group of 17 to 19 years. According to WHO, Conde and Monteiro and IOTF cutoff points, girls in the post-pubertal stage were less likely to be overweight or obese.
References
1. Silva DAS. Sobrepeso e obesidade em crianças de cinco a dez
anos de idade beneiciárias do Programa Bolsa Família no estado de Sergipe, Brasil. Rev Paul Pediatr. 2011; 29(4):529-3Hind
K. Sedentary Time and Central Adiposity in Children. J Clin
Densitom. 2016; 19(3):264-265.
2. Onis MD. Prevenção do sobrepeso e da obesidade infantis. J
3. Eckel N, Meidtner K, Kalle-Uhlmann T, Stefan N, Schulze
MB. Metabolically healthy obesity and cardiovascular events:
A systematic review and meta-analysis. Eur J Prev Cardiol.
2016;23(9):56-66.
4. Ahrens W, Pigeot I, Pohlabeln H, De Henauw S, Lissner L, Molnár D, et al. Prevalence of overweight and obesity in European
chil-dren below the age of 10. Int J Obes. 2014;38(2):99-107.
5. Feferbaum R, Leone C, Casanova NR, Neri CP, Blanco CE, Allende SMA. 10-month anthropometric and bioimpedance evaluation of a nutritional education program for 7-to 14-year-old students. Rev Bras Cineantropom Desempenho Hum.
2012;22(3):283-290.
6. Burgos MS, Burgos LT, Camargo MD, Franke SIR, Prá D, Silva AMV. Relationship between anthropometric measures and car-diovascular risk factors in children and adolescents. Arq Bras
Cardiol. 2013;101(4):288-296.
7. Cole TJ, Lobstein T. Extended international (IOTF) body mass index cut offs for thinness, overweight and obesity. Pediatr Obes.
2012;7(4):284-294.
8. Cole TJ, Bellizzi MC, Flegal KM, Dietz WH. Establishing a
standard deinition for child overweight and obesity worldwide: international survey. Bmj. 2000;320(7244):1240-1246.
9. Conde WL, Monteiro CA. Body mass index cutoff points for evaluation of nutritional status in Brazilian children and
adoles-cents. J Peatr. 2006;82(4):266-272.
10. Onis MD, Onyango AW, Borghi E, Siyam A, Nishida C, Siekmann J. Development of a WHO growth reference for school-aged children and adolescents. Bull World Health Organ.
2007;85(9):660-667.
11. Clemente APG, Santos CDL, Benedito-Silva AA, Sawaya, AL.
Índice de massa corporal de adolescentes: comparação entre diferentes referências. Rev Paul Pediatr. 2011;29(2):171-7.
12. Dumith SC, Farias Júnior JC. Sobrepeso e obesidade em
crian-ças e adolescentes: comparação de três critérios de classiicação baseados no índice de massa corporal. Rev Panam Salud Publica. 2010;28(1):30-35.
13. Pelegrini A, Silva DAS, Gaya ACA, Petroski, EL. Comparison of
three criteria for oveweight and obesity classiication in Brazilian adolescents. Nutr J. 2013;12(1):5-13.
14. Valerio G, Balsamo A, Baroni MG, Brufani C, Forziato C, Grugni
G, et al. Childhood obesity classiication systems and cardio
-metabolic risk factors: a comparison of the Italian, World Health
Organization and International Obesity Task Force references. Ital
J Ped. 2017;43(1):19
15. Lee RL, Lee PH, Sze DM, Chien WT. Anthropometric proile of
Hong Kong children and adolescents: the Wellness Population of
Youth Study. JASH In press 2017.
16. Atlas Brasil [página na Internet]. Atlas de Desenvolvimento
Humano do Brasil, 2013 [acessado em 10 de fevereiro de 2017]. Disponível em: http://www.atlasbrasil.org.br/2013/.
17. Marfell-Jones M, Olds T, Stewart A, Carter J. ISAK: Potchefstroom: International Standards for Anthropometric Assessment. 2006. 18. Brasil - Associação Brasileira de Empresas de Pesquisa. Critério
de classiicação econômica brasil. São paulo: ABEP 2010.
19. Tanner JM. Growth at adolescence; with a general consideration of the effects of hereditary and environmental factors upon
growth and maturation from birth to maturity. Oxford: Blackwell Scientiic; 1962.
20. Matsudo SMM, Matsudo VKR. Validade da autoavaliação na
determinação da maturação sexual. RBCM. 1991;5(2):18-35.
21. Ekelund U, Luan JA, Sherar LB, Esliger DW, Griew P, Cooper A, et al. Moderate to vigorous physical activity and sedentary time and cardiometabolic risk factors in children and adolescents.
JAMA. 2012;307(7):704-712.
22. Ozmun JC, Gallahue DL. Motor development. Adapted Physical Education and Sport. 6ª ed. 2016; 375.
Corresponding author
*Diego Augusto Santos Silva
Federal University of Santa Catarina, Sports Centre, Research Center in Kinan-thropometry and Human Performance, University Campus, Trindade, Postal code 88040-900, Florianopolis, Santa Catarina, Brazil.
Email: diegoaugustoss@yahoo.com.br
Manuscripted received on August 22, 2017
Manuscripted accepted on September 25, 2017
Motriz. The Journal of Physical Education. UNESP. Rio Claro, SP, Brazil