Artigo
*e-mail: [email protected]
LOW COST ANALYZER FOR THE DETERMINATION OF PHOSPHORUS BASED ON OPEN-SOURCE HARDWARE AND PULSED FLOWS
Pablo Gonzáleza, Nicolás Pérezb and Moisés Knochena,*
aQuímica Analítica, Facultad de Química, Universidad de la República, 11800 Montevideo, Uruguay bCentro Universitario de Paysandú, Universidad de la República, Ruta 3 km 363, 60000 Paysandú, Uruguay
Recebido em 22/09/2015; aceito em 08/12/2015; publicado na web em 17/02/2016
The need for automated analyzers for industrial and environmental samples has triggered the research for new and cost-effective strategies of automation and control of analytical systems. The widespread availability of open-source hardware together with novel analytical methods based on pulsed flows have opened the possibility of implementing standalone automated analytical systems at low cost. Among the areas that can benefit from this approach are the analysis of industrial products and effluents and environmental analysis. In this work, a multi-pumping flow system is proposed for the determination of phosphorus in effluents and polluted water samples. The system employs photometric detection based on the formation of molybdovanadophosphoric acid, and the fluidic circuit is built using three solenoid micropumps. The detection is implemented with a low cost LED-photodiode photometric detection system and the whole system is controlled by an open-source Arduino Uno microcontroller board. The optimization of the timing to ensure the color development and the pumping cycle is discussed for the proposed implementation. Experimental results to evaluate the system behavior are presented verifying a linear relationship between the relative absorbance and the phosphorus concentrations for levels as high as 50 mg L-1.
Keywords: phosphorus; analyzer; pulsed flows; open-source.
INTRODUCTION
Phosphorus is the 12th element in abundance in the Earth’s crust.1 Its compounds are distributed in rocks and minerals, and can be found in living beings. It is essential for life, but unlike other essential elements, its cycle is limited to terrestrial and aquatic ecosystems.1 Phosphorus compounds, obtained from phosphate rocks, are used in agriculture as fertilizers and in industry, for instance as a component of detergents.
Hence the analytical determination of phosphorus compounds in different matrixes, both natural and industrial is an important subject that is often reported in the literature. Quality control of manufactured goods such as fertilizers or detergents requires the determination of contents of phosphates. On the other hand, high levels of phosphorus and other nutrients in water bodies may cause the phenomenon of eutrophication, often referred to as “algal bloom”, characterized by a fast and uncontrolled growth of phytoplankton.2,3 Fertilizers and detergents containing phosphates are amongst the main sources of pollution by phosphorus, which can reach surface water bodies via runoffs as well as industrial and urban wastes. Thus monitoring the levels of phosphorus and other nutrients in industrial effluents and sewage systems is necessary in order to keep under control the pos-sible pollution originating from these sources.
A literature search can show a large number of methods proposed for the determination of phosphorus, based on different techniques such as UV-visible spectrophotometry,4,5 fluorescence,6,7 and chemi-luminescence.8,9 UV-visible spectrophotometry is probably the most often used technique for this purpose. Several classical and well--known reactions are employed, usually proceeding via formation of phosphomolybdate, such as the phosphomolybdenum blue4,10,11 and molybdovanadophosphoric acid12,13 methods. The former presents an absorption maximum about 880 nm and is more sensitive, while the latter is characterized by an absorption maximum about 315 nm
and is usually chosen when higher concentration ranges are to be determined.
Given the increase in the number of samples to be analyzed, there is a need for a higher analytical productivity, hence of faster analytical methods capable of providing better information for decision making. Analytical automation has experienced an outstanding evolution in the last decades, partly due to the introduction of different techni-ques of flow analysis, such as segmented flow analysis (SFA) by Skegg in 1957,14 and especially since the inception of flow injection analysis (FIA) in the decade of 1970.15,16 This technique has experienced a remarkable evolution and is routinely used for the determination of phosphorus in water.17 Later developments in the instrumentation used in flow analysis have led to the introduction of innovative flow techniques such as sequential injection analysis (SIA),18 multicom-mutated flow analysis (MCFA)19 and multisyringe flow analysis (MSFA),20 where different strategies of sample introduction and fluid handling are exploited in order to obtain the best possible figures of merit for a given application, emphasizing high sample throughput and minimum reagent consumption.
these devices exhibit satisfactory analytical figures of merit thus many systems based on the use of MPFA have been proposed to solve a wide array of analytical problems. Compared with other flow techniques, multi-pumping exhibits significant advantages such as unmatched flexibility in the operation along with the possibility of binary sampling.19 Modifications in the operation of the system, such as changes in the volumes of samples or reagents, or order of additions of reagents can often be made just through changes in the software responsible for the activation of the different pumps, without the need of physically changing the manifold. Some of these advantages are shared with multicommutated flow analysis, but multi-pumping offers yet one more, namely the possibility of changing the flow rate of each pump channel by software independently and at any given time. Multi-pumping has been explored for the determination of many different analytes in a wide array of industrial, pharmaceutical and environmental matrices.23,24 A recent review discusses the advantages and limitations of pulsed flows in analytical systems.25
Different to basic classical FIA methods, that can be implemented with simple devices and even be operated manually; advanced flow techniques such as SIA, multi-commutation and multi-pumping require mandatorily the use of computer control. Software controls the activation of each actuator (syringe pump, rotary valve, solenoid valve or solenoid pump) and provides the exact timing necessary for the analytical process.
Traditionally, this has been implemented by means of a personal computer or notebook fitted with an appropriate interface responsible for controlling the actuator. Individual actuators such as solenoid val-ves and solenoid pumps require a digital input/output (I/O) interface working at TTL-level voltages plus a voltage adaptor.
Needless to say, commercial analytical systems based on the mentioned flow techniques are scarce, expensive, and adaptation for a particular determination may be difficult. Thus the development of low cost systems presents a challenge for researchers.
The trend towards portable and in situ autonomous instruments based on flow analysis has called the attention to different strategies for the control of the analytical systems, such as the use of dedicated microcontroller units (MCUs) instead of a PC or notebook. Currently there is a wide range of low cost powerful microcontrollers available which can be used for system control as well as data acquisition and processing.
While open-source26 software has been around for some time, in the last few years the concept of open-source hardware has entered into scene providing the analytical chemist some new resources for the development of automated systems. Open-source hardware entails the availability from many different sources of development boards for certain microcontrollers at very low costs, since no patents are involved. The use of open-source platforms allows the implementation of large scale sensors networks in projects conducted by universities or NGOs concerned with the environmental protection.
In this work we present the complete design and the optimization of an automated multi-pumping analytical system for the determi-nation of soluble inorganic phosphorus based on the molybdovana-dophosphoric acid chromogenic reaction. The aim is to develop an integrated automated analytical system based on low-cost components for determination of phosphorus (and eventually other target subs-tances) in different kinds of samples including industrial products, polluted surface water and industrial effluents. For this purpose the use of open-source hardware was investigated.
The core of the system is an open-source Arduino MCU board27 that controls both dosage of the reactive and the acquisition and processing of the data. The fluidic system uses 3 solenoid micro-pumps and one solenoid valve. The photometric detection system is based on a light-emitting diode (LED) and a photodiode operating
in the visible range. The entire system can operate autonomously, autonomy being limited by the size of the reservoirs and the wa-stewater tank to avoid contamination of the watercourse with the chemical waste.
EXPERIMENTAL
Reagents and samples
All reagents were of analytical reagent grade. High purity (ASTM type I) water was obtained from a Millipore Direct-Q5 water purifier.
Potassium phosphate monobasic (Merck) was used for prepara-tion of standard 1 g-P L-1 standard solutions.
The chromogenic reagent was prepared by adding 2.14 g of ammonium molybdate tetrahydrate to 0.107 g of ammonium meta-vanadate in 100-mL of water; then 29 mL concentrated hydrochloric acid was added and water added to make 300 mL.
Water samples were taken from brooks in the Montevideo area, filtered by 0.45-µm nylon membrane filter, spiked as necessary and analyzed the same day.
Flow system
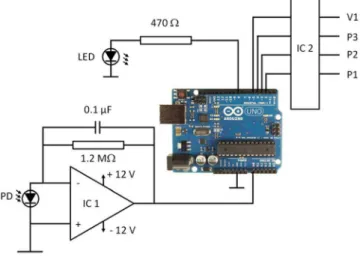
The flow manifold (Figure 1) was built around 3 12-volt solenoid micropumps (Cole Parmer, Vernon Hills, IL, USA, model 73120-10, nominal stroke volume 20 µL), each one for propelling the sample (or the standard solution), the molybdo-vanadate reagent and water used as carrier. A 12-V solenoid valve (NResearch, West Caldwell, NJ, UA, model 161T031) was used to switch the input of pump P3 between sample and standard, thus ensuring that the same pump is used for both.
Connections and mixing coils were made from stock 0.8-mm (internal diameter) Teflon PFA tubing. A cross-shaped connector and a mixing coil completed the manifold.
The detection system was built around a glass flow cell (1-cm path length, internal volume 250 µL), a 5-mm high-brightness light--emitting diode (LED), with nominal wavelength 415 nm, and a sili-con photodiode as detector (Perkin Elmer, VTB1013). An operational
Figure 1. Diagram of the flow system. P1, P2, P3: solenoid micro pumps. V1:
amplifier used in the transimpedance mode provided a voltage signal proportional to the light intensity impinging the photodiode.
The LED was fed from one of the digital I/O ports of the board via a limiting resistor.
The system was controlled by an Arduino Uno board,27 based on the Atmel ATMega328P microcontroller, an open-source board with an 8-bit MCU running at 16 MHz. Software for the operation of the system was written in Arduino C language, debugged and compiled employing Arduino’s standard Integrated Development Environment (IDE) version 1.6.1. It was uploaded to the MCU from the same IDE via the USB port of the board.
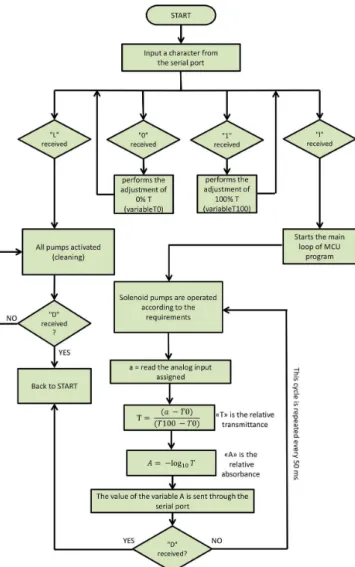
The solenoid pumps were activated by 3 sections of a ULN 2803 Darlington array, with TTL-level signals provided by 3 I/O digital ports of the board. The MCU also timed the activation and deactivation of the micropumps in order to obtain the desired average flow rates. The analog signal from the photodiode amplified by a TL081 operational amplifier was digitized by one of the analog-to-digital (A/D) inputs of the board (10-bit resolution). Figure 2 shows the schematics of the electronics.
The 12-V solenoid micropumps were operated at the maximum rate recommended by the manufacturer (2 Hz), thus delivering an average flow rate of 2.4 mL min-1. For that purpose they were acti-vated with 150-ms “on” pulses followed by 350-ms “off” periods.
Methods
For the definition of the photometric scale the following su-broutine was invoked as needed. First, the LED was turned off and the dark signal (SD) was measured and memorized. Next, the LED was turned on and water was propelled through the system, and the reference (“100 %”) signal (SR) was measured and memorized. Then, every time the signal SX was measured the absorbance (A) of the fluid passing through the flow cell could be calculated as
Once the photometric scale was defined, absorbance values were measured at intervals of 50 ms and transferred via the USB port to a host notebook where data were plotted on screen by a routine pro-grammed in Matlab and stored as ASCII files on hard disk.
The time sequence for activation of the pumps is shown in Figure 3, and the flow diagram is presented in Figure 4.
Calibration process
Analytical calibration was carried out by injecting 400 µL of standard solutions in the range 0 to 50 mg-P L-1 and measuring the peak height (absorbance) of the transient signals corresponding to each injection. For assessing the linear range, up to 13 standard so-lutions of phosphate with known P concentrations plus a blank were used and the results transferred via the USB port to the host notebook were calculations including linear regression were carried out by the routine programmed in Matlab.
Once analytical linearity was confirmed, the system could be routinely calibrated with just two points, namely water blank and one standard solution. In this case the calibration process was carried out entirely by the MCU and the parameters of the calibration function stored in RAM for future use.
One important aspect for an autonomous chemical analyzer is the capability of performing not only the analytical process leading to the measurement of the response produced by a sample, but also the whole process of calibration, i.e. finding the mathematical cali-bration model (the calicali-bration function) and then applying the inverse function of the latter (the evaluation function) to find out the best estimate of the concentration of the analyte corresponding to a given sample. In chemical analysis calibrations require the measurement of several standard solutions with known concentrations of the analyte.
Figure 2. Schematics of the electronic circuit. IC1: TL081 operational
am-plifier. IC2: ULN 2803. PD: VTB1013 photodiode
Figure 3. Voltage signals applied to the pumps as a function of time. P1: carrier. P2: reagent. P3: sample or standard. For illustrative purposes the injection
However once the method has been validated in the laboratory using the proposed analyzer, and the linear calibration range has been clearly established, it is possible to perform routine calibrations with just two solutions, namely a blank and a standard. This simplifies to a large extent the calculations to be executed, avoiding the need to resort to regression analysis, thus enabling simpler and cheaper MCUs to be used. Furthermore it reduces the number of standard solutions to be stocked to just one. The use of a single standard however does not preclude the possibility of performing multi-point calibration if necessary, as different volumes of the standard solution (and hence different masses of analyte) can be processed thus generating a valid calibration curve. Hence in the present system a two-point self--calibration routine was included.
RESULTS AND DISCUSSION
From the beginning it was decided to use the method based on the formation of molybdovanadophosphoric acid (molybdenum yellow). Given that the system is proposed for the determination of soluble inorganic phosphorus in industrial samples, effluents or in polluted water bodies, the lower sensitivity of this method is not of concern. This method also has the advantage that the reagents are much more stable than those used in the phosphomolybdenum blue method. This is especially interesting for applications such as automated in situ analyzers as it makes unnecessary a frequent replenishment of the reservoirs. The chromophore formed presents maximum absorbance
around 310 – 315 nm. However, given the width of the absorption band the APHA method 5 as well as other compendial methods based on this chemistry usually measure the absorbance at wavelengths in the range 400 – 490 nm, presumably due to the wider availability of visible spectrophotometers. In principle, working at a wavelength close to the absorbance maximum would provide the best sensiti-vity and linearity. However, high-brightness LEDs emitting in the ultraviolet region are still less common and fairly expensive, and optical-glass flow cells do not have an appropriate transmittance at that wavelength, requiring the use of more expensive quartz cells instead. Also, response of common photodiodes is poor below 400 nm. Two different LEDs were tested, one with a nominal wavelength of 415 nm (rated at 3000 mcd) operated at 10 mA, and other with nominal wavelength of 360 nm (FG360-TO18BL010, Fox Group) operated at 20 mA. Despite the better closeness of the latter to the wavelength of maximum absorbance, when compared to the 415 nm LED the results were poor in terms of signal to noise ratio. The absorptivity of the chromophore is low at 415 nm, however the signal to noise ratio was much higher allowing more satisfactory overall results to be attained, hence the 415 nm LED was chosen as light source.
Optimization
The reaction between orthophosphate and molybdate in the pre-sence of vanadate is slow. When carried out batchwise a minimum waiting time of 10 minutes is recommended before reading.4 Thus in this system a stop-flow stage was included in the process. To study the influence of the duration of this stage in the amplitude of the signals and hence in sensitivity, stop-time values of 0, 1, 2, 3 and 4 minutes were programmed and the experiment repeated in duplicate injecting a 40 mg-P L-1 phosphorus standard solution. Average amplitudes were respectively 0.14, 0.39, 0.46, 0.48 and 0.48. As a compromise between sensitivity and sample throughput a stop-time of 1 minute was chosen. Afterwards, sample volume was optimized. For this purpose, using a standard solution containing 20 mg P L-1, pumping times of 5, 10, 15 and 20 seconds, equivalent to nominal sample volumes of 200, 400, 600 and 800 µL were programmed. Signal amplitudes incre-ased slightly when changing from 200 to 400 µL, while the increase was negligible beyond this point. Thus a pump time of 10 seconds equivalent to a sample volume of 400 µL was chosen.
Analytical figures of merit
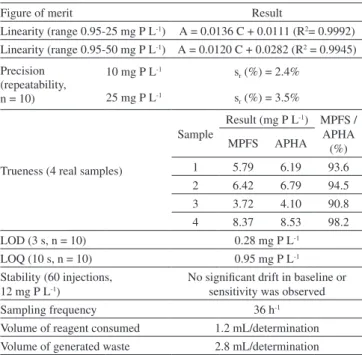
The analytical performance of the system was assessed by stu-dying the following figures of merit of the method: linearity, precision (repeatability), trueness, detection and quantification limits, stability, sampling frequency and volume of waste generated. Linearity was evaluated by means of a 13-point calibration curve in the range 0 – 50 mg P L-1. Precision (repeatability) was assessed at 2 concentration levels (10 and 20 mg P L-1) as the relative standard deviation of 10 successive determinations. Trueness was studied by comparing the results obtained when analyzing 4 real water samples by both the proposed method and the reference method (APHA 4500-P C).4 Limits of detection and quantification were calculated as 3s/b and 10s/b respectively, s being the standard deviation of 10 measurements of a blank and b the slope of the linear calibration curve.
Results are presented in Table 1.
Linearity of the method (evaluated by visual inspection and values of coefficient of determination, R2) was satisfactory up to 50 mg P L-1, although better fit was attained in the range up to 25 mg P L-1. Precision, trueness as well as detection and quantification limits were found appropriate for a method to be applied to water samples with high phosphorus concentrations.
Stability, assessed in a test involving about 2 hours of continuous work did not show significant drift in baseline or in sensitivity (peak heights). This period of time is enough to perform a calibration and measure a series of samples hence the performance was deemed satisfactory.
The system was evaluated from the point of view of the fitness for the intended purpose. In order to comply with current concepts of green chemistry, analyzers should consume as little reagents as possible and also generate the least possible volume of waste. Under conditions of routine operation, the proposed system would typically perform a calibration consisting of the determination of one blank and one standard, followed by one sample. Assuming duplicate de-terminations this would consume 7.2 mL of reagent and slightly less water, and would produce less than 17 mL of waste.
One of the main goals of this work was to evaluate the use of an open-hardware microcontroller board for the combined task of data acquisition and system control. The cost of these boards is very low (around € 25 for the original boards and a few dollars for the
com-patible counterparts). The MCU also performs the A/D conversion necessary for data acquisition, which further contributes to simplify the system. The use of an MCU allows the use of an embedded system which may be eventually suitable for field deployment and unattended operation. The Arduino platform chosen simplified not only the design but also the programming of the necessary routines. The wide availability of accessory boards providing additional me-mory, communications and other services make possible to devise low-cost standalone systems. Research continues in order to assess the viability of this approach for the construction of a network of analyzers for monitoring different water bodies for various analytes.
CONCLUSIONS
An open-source microcontroller board was used successfully for the construction of an automated analyzer. The system performed in a dependable and reproducible way, providing results whose figures of merit were fit for the purpose. The MCU could be programmed not Table 1. Figures of merit of the analytical method for the determination of phosphorus when performed in the proposed system
Figure of merit Result
Linearity (range 0.95-25 mg P L-1) A = 0.0136 C + 0.0111 (R2= 0.9992)
Linearity (range 0.95-50 mg P L-1) A = 0.0120 C + 0.0282 (R2 = 0.9945)
Precision (repeatability, n = 10)
10 mg P L-1 s
r (%) = 2.4%
25 mg P L-1 s
r (%) = 3.5%
Trueness (4 real samples)
Sample
Result (mg P L-1) MPFS /
APHA (%) MPFS APHA 1 5.79 6.19 93.6 2 6.42 6.79 94.5 3 3.72 4.10 90.8 4 8.37 8.53 98.2 LOD (3 s, n = 10) 0.28 mg P L-1
LOQ (10 s, n = 10) 0.95 mg P L-1
Stability (60 injections, 12 mg P L-1)
No significant drift in baseline or sensitivity was observed Sampling frequency 36 h-1
Volume of reagent consumed 1.2 mL/determination Volume of generated waste 2.8 mL/determination
only for the basic operation of the flow system but also to perform the analytical calibration and to use in order to provide concentration results.
It is concluded that multi-pumping flow systems, under control of open-source microcontroller boards can be used successfully for the development of automated analyzers. This encourages further development towards the design of low-cost analytical systems capable of unattended operation.
ACKNOWLEDGMENTS
The authors thank Programa de Desarrollo de Ciencias Básicas (PEDECIBA) for support. MK wishes to thank Agencia Nacional de Investigación e Innovación (ANII) for a grant and Universidad de la República (UdelaR) for partial financial support.
REFERENCES
1. Sapek, A; Sapek, B. In Phosphorus, in Elements and Their Compounds in the Environment; Merian, E.; Anke, M.; Ihnat, M.; Stoeppler, M., eds.; 2nd ed., Wiley-VCH: Weinheim, 2004, chap. 4.
2. Sullivan, P. J.; Agardy, F. J.; Clark, J. J. J.; The Environmental Science of Drinking Water, Elsevier: Amsterdam, 2005.
3. Chorus, I.; Bartram, J.; Toxic Cyanobacteria in Water: A guide to their public health consequences, monitoring and management. E & FN Spon: London, 1999.
4. Marczenko, Z; Balcerzak, M.; Separation, Preconcentration and Spec-trophotometry in Inorganic Analysis, Elsevier: Amsterdam, 2000. 5. Clesceri, L. S.; Greenberg, A. E.; Eaton, A. D.; Standard Methods for the
Examination of Water and Wastewater, 20th ed., American Public Health
Association: Washington DC, 1998, method 4500-P C.
6. Kirkbright, G. F.; Narayanaswamy, R.; West, T. S.; Anal. Chem. 1971, 43, 1434.
7. Zhang, B.; Beck, H. P.; Anal. Lett. 2001, 34, 2721.
8. Yaqoob, M.; Nabi, A.; Worsfold, P. J.; Anal. Chim. Acta 2004, 510, 213. 9. Morais, I. P. A.; Tóth, I. V.; Rangel, A. O. S. S.; Talanta 2005, 66, 341. 10. Murphy, J.; Riley, J. P.; Anal. Chim. Acta 1962, 27, 31.
11. Crouch, S. R.; Malmstadt, H. V.; Anal. Chem. 1967, 39, 1084. 12. Quinlan, K. P.; DeSesa, M. A.; Anal. Chem. 1955, 27, 1626. 13. Michelsen, O. B.; Anal. Chem. 1957, 29, 60.
14. Skeggs, L. T.; Am. J. Clin. Pathol. 1957, 28, 311. 15. Ruzicka, J.; Hansen, E.; Anal. Chim. Acta 1975, 78, 145.
16. Advances in Flow Analysis; Trojanowicz, M., ed.; Wiley-VCH: Wein-heim, 2008.
17. Motomizu, S.; Li, Z.-H.; Talanta 2005, 66, 332.
18. Ruzicka, J.; Marshall, G. D.; Anal. Chim. Acta 1990, 237, 329. 19. Reis, B. F.; Giné, M. F.; Zagatto, E. A. G.; Lima, J. L. C.; Lapa, R. A.;
Anal. Chim. Acta 1994, 293, 129.
20. Cerdà, V.; Estela, J. M.; Forteza, R.; Cladera, A.; Becerra, E.; Altimira, P.; Sitjar, P.; Talanta 1999, 50, 695.
21. Lapa, R. A. S.; Lima, J. L. F. C.; Reis, B. F.; Santos, J. L. M.; Zagatto, E. A. G.; Anal. Chim. Acta 2002, 466, 125.
22. Weeks D. A.; Johnson, K. S.; Anal. Chem. 1996, 68, 2717.
23. Lima, J. L. F. C.; Santos, J. L. M.; Dias, A. C. B.; Ribeiro, M. F. T.; Zagatto, E. A. G.; Talanta 2004, 64, 1091.
24. Santos, J. L. M.; Ribeiro, M. F. T.; Dias, A. C. B.; Lima, J. L. F. C.; Zagatto, E. A. G.; Anal. Chim. Acta 2007, 600, 21.
25. González, P.; Knochen, M.; Sasaki, M. K.; Zagatto, E. A. G.; Talanta 2015, 143, 419.