Ar
ti
cl
e
*e-mail: [email protected]
Application of Simplex Optimization in the Development of an Automated online
Preconcentration System for Manganese Determination
Queila O. dos Santos, Cléber G. Novaes, Marcos A. Bezerra,* Valfredo A. Lemos, Islania Moreno, Douglas G. da Silva and Leandro dos Santos
Universidade Estadual do Sudoeste da Bahia, Núcleo de Química Analítica da Bahia (NQA), Laboratório de Química Analítica (LQA), Campus de Jequié, 45.506-191 Jequié-BA, Brazil
Um procedimento automatizado foi desenvolvido para determinação de quantidades traços de manganês provenientes de folhas de vegetais e águas de rio utilizando espectrometria de absorção atômica com chama (FAAS) após a pré-concentração em linha deste metal usando uma minicoluna de Amberlite XAD-4 modiicada com 2-aminotiofenol. O sistema de pré-concentração baseia-se na extração em fase sólida do metal na minicoluna e eluição com ácido clorídrico 0,30 mol L-1, seguido
de sua determinação. As variáveis associadas ao desempenho do sistema de pré-concentração, tais como, pH, vazão de amostragem e concentração do eluente foram otimizadas utilizando um simplex básico como técnica multivariada. O método desenvolvido gerou um fator de enriquecimento de 14 vezes atingindo um limite de detecção (3 σ
B) de 2,0 mg L-1 e precisão expressa como desvio
padrão relativo de 2,2% (%RSD, n = 10; 30,00 mg L-1). O procedimento foi aplicado para a
determinação de manganês em águas de rio coletada na área urbana de Jequié/Bahia. A exatidão do procedimento foi veriicada usando-se materiais de referência certiicados (folhas de macieira, NIST 1515 e folhas de espinafre, NIST 1570). O procedimento desenvolvido foi aplicado para a determinação de manganês em folhas de vegetais (cebolinha, espinafre, couve-lor e repolho).
An automated procedure was developed to determine trace amounts of manganese from vegetal leaves and river waters using lame atomic absorption spectrometry (FAAS) after online preconcentration of this metal using an Amberlite XAD-4 minicolumn modiied with 2-aminothiophenol. The preconcentration system is based on the solid-phase extraction of the metal into the minicolumn and elution with 0.30 mol L-1 hydrochloric acid, followed by its
determination. Variables associated with the preconcentration system performance, such as pH, sampling low rate and eluent concentration were optimized using a basic simplex as multivariate technique. The developed method provides an improvement factor of 14 along with limit of detection (3σB) of 2.0 µg L-1, and precision expressed as a 2.2% relative standard deviation
(RSD%, n = 10, 30.0 µg L-1). The procedure was applied to determine manganese in river waters
collected from urban area of Jequié/Bahia. The accuracy of the procedure was checked by analysis of two certiied reference materials (apple leaves, NIST 1515 and spinach leaves, NIST 1570). The developed procedure has been applied for manganese determination in vegetal leaves (chive, spinach, caulilower and cabbage).
Keywords: vegetal leaves, natural waters, simplex optimization, manganese, automated online
preconcentration
Introduction
Determination of trace metals in some samples such as vegetal leaves and natural waters at low concentrations is still a challenging task despite the availability of sensitive analytical intrumental techniques. Methods for separation of analytes from interferents in the complex matrices and selective
preconcentration are frequently necessary.1 Several online
preconcentration techniques have been proposed to determine metals in various environmental samples, including knotted reactor,2 cloud-point extraction,3 coprecipitation4 and solid
phase-extraction.5,6 Thus, automatization of preconcentration
The simplex method, was irst suggested by Spendley et al.9 This method is referred to as basic simplex method, and,
in its present form was a regular igure whose number of point is deined by k+1, being k the number of variables that must be optimized and that correspond with dimensions of space. Thus, in case of two variables, k = 2, the simplex will be a triangle, three variables, k = 3, it will be a tetrahedron and in case of more dimensions, a hypertriangle.
The procedure begins by the choice of k+1 points (k is the number of dependent variables), and evaluation of the response at each, and continually forming new simplexes by relecting the point giving the least favorable response in the hyperplane of the remaining points.
The basic algorithm works as follows: (1) generate the initial simplex according with speciic factors; (2) run the experiments at the initial simplex coordinates; (3) decide from the responses which vertex represents the best (B), the next-to-best (N), and the worst (W) response; (4) calculate the new experimental point by R=P+(P-W), where P is the centroid of the face remaining if the worst vertex (W) has been eliminated from the full simplex.
The centroid is calculated using the equation 1:
(1)
where n is the number of variables, i the index of the worst vertex to be eliminated and j is the index of the considered vertex.10,11,12
Simplex design methodology has been applied to optimize some analytical methods, such as solid-phase microextraction coupled to CG-MS for polycyclic aromatic hydrocarbons determination in water samples,13
determination of amphetamine, amphetamine analogues, cocaine, and heroin in illicit tablets using capillary zone electrophoresis,14 amoxicillin and clavulanic
acid determination using sequential injection analysis with a diode-array spectrophotometer,15 separation and
determination of vitamins A and E using micellar liquid chromatography,16 kinetic determination of nabumetone, a
non-steroidal anti-inlammatory drug, by means of micellar-stabilized room temperature phosphorescence,17 flow
injection analysis system for tartaric acid determination in wines18 and ion-pair reversed phase high performance liquid
chromatographic analysis of 4-(2-pyridylazo) resorcinol chelates of Co(II), Ni(II) and Cr(III).19
Our research group has developed automated preconcentration system for metals determination using, as examples, cloud-point extraction where metal ions are complexed in a mixture of the reagent 2-[2′
-(6-methyl-benzothiazolylazo)]-4-bromophenol (Me-BTABr) and Triton X-114. After separation, the micellar phase is trapped
in a minicolumn with a iltering material.20 Another example
is the manganese preconcentration using two mini-columns packed with 4-(5′-bromo-2′-thiazolylazo)orcinol (Br-TAO)
loaded polyurethane foam.21
This work shows the irst application of a solid-phase functionalized by our research group (Amberlite XAD-4 modified with 2-aminothiophenol, AT/XAD-XAD-4) for manganese preconcentration and also presents the use of a basic algorithm simplex design to optimize an automated system for determination of this metal by FAAS.
Advantage of AT/XAD-4 resin as solid-phase is in the low backpressure generated by solid-phase used avoiding disruption of connections. Furthermore, the functionalized polymer has the advantage of reducing the leaching of the complexing reagent from solid support, increasing the column lifetime when compared to loaded sorbents. Simplex optimization was applied in this study because its advantages in comparison to other experimental design such as the simplicity and good responses for automated systems.
Experimental
Absorbance measurements were taken using a FAAS Perkin-Elmer Instruments (Norwalk, CT, USA) model AAnalyst 200. It was equipped with a manganese hollow cathode lamp and an air-acetylene lame. The instrumental parameters were as follows: 279.5 nm wavelength, 15.0 mA lamp current and 0.5 nm spectral resolution. The low rates of acetylene, air and nebulizer were 2.0, 13.5 and 5.0 mL min-1,
respectively. Deuterium lamp background correction was used. A Digimed DM 20 (Santo Amaro, SP, Brazil) pH meter was used to monitor the pH of the solutions. Sample digestion was carried out by using a Parr Instrument model 4749 (Moline, IL, USA). Acid digestion bombs enclosing a chemically inert Telon sample cup of 23 mL were used for sample treatment.
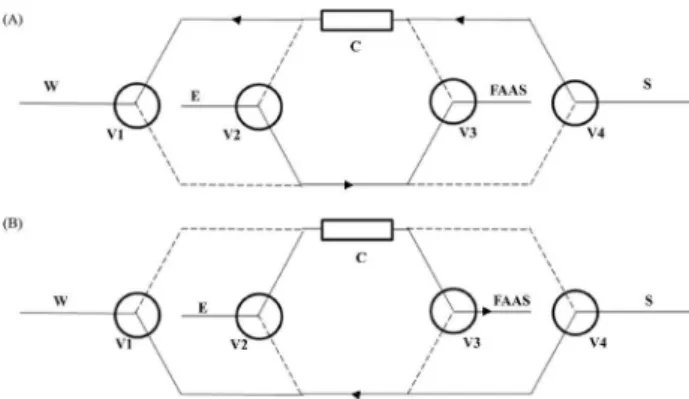
The online preconcentration system is illustrated in Figure 1. The system consisted of a multichannel peristaltic pump model 200/4 from Millan (Colombo, Paraná, Brazil) furnished with silicone tubes to propel the liquids and four three-way direct lift solenoid valves (Vernon Hills, IL, USA) to select the preconcentration and elution steps. Solenoid valves were controlled by a microcomputer running software written in Turbo Pascal 4.0. A laboratory-made mini-column packed with DHB-XAD-4 was inserted into the online system.
Reagents and solutions
All chemicals used were of analytical grade. Reference manganese solutions at the µg L-1 level were prepared by
diluting a 1000 µg mL-1 stock solution (Merck, Darmstadt,
Germany). Hydrochloric acid solutions were prepared by direct dilution of the concentrated solution (Merck) with deionized water. Acetate (pH 3.8-5.8), phosphate (5.8-7.5), borate (pH 7.5-9.0) and ammonia (pH 9.0-10.0) buffer solutions were used to adjust the pH of the manganese solutions. Hydrochloric acid solutions were prepared by diluting a stock solution of Suprapur quality (Merck).
The functionalized resin AT-XAD-4 was synthesized by using the following reagents: 2-aminothiophenol (Merck), aluminum chloride (Vetec, Rio de Janeiro, RJ, Brazil), nitrobenzene (Merck), octanol (Merck) and methylene chloride (Vetec). AmberliteXAD-4 (speciic surface area 330 m2 g−1 and bead size 20-60 mesh), a PS-DVB copolymer,
was purchased from Aldrich (Milwaukee, WI, USA).
Synthesis of AT-XAD-4 resin and minicolumn preparation
The sorbent AT-XAD-4 was prepared by a procedure described previously for similar resins.22 A 3 g amount of
Amberlite XAD-4 was chloromethylated by mixing the copolymer beads with dry 20 mL methylene chloride and 10 mL octanol. Anhydrous, pulverized aluminium chloride (7 g) was added in small increments to the mixture. The system was reluxed at 90 οC. The reaction was stopped
after 24 h and iltered. The resin beads were cleaned with water, acetone, 1:1 v/v aqueous hydrochloric acid and again with water. The chloromethylated beads were iltered off and dried for storage. The dried chloromethylated copolymer was suspended in a mixture of 30 mL nitrobenzene and 2.0 g 2-aminotiophenol. Then the system was reluxed for 72 h at 70 οC under continuous stirring. The mixture was
iltered, and the resin was washed twice with 1:1 v/v aqueous
hydrochloric acid, and water, respectively. The inal product was heated in ethanol for 2 h, iltered and dried in air.
A cylindrically shaped polyvinyl chloride minicolumn (3.50 cm × 4.0 mm i.d.) was packed with 100 mg of the AT-XAD-4 resin. Plastic foams were ixed at both ends of the minicolumn to prevent material losses. The minicolumn was washed with 2.0 mol L-1 nitric acid solution and
deionized water until the efluent was acid free.
Sample preparation
Samples of river waters were collected directly from the urban area of Jequié/Bahia by the bottle immersion in the water stream. Polyethylene lasks used were previously decontaminated with nitric acid solution (10% v/v) and rinsed with ultrapure water. Samples were iltered using a membrane (0.45 µm pore diameter) through a vacuum system after sampling to remove suspended particulate material. Later, these samples were acidiied to pH 2 with nitric acid and stored at 6 οC.
Plant samples (0.1 g) were digested by adding 4.0 mL of 1:1 v/v nitric acid solution to the sample. A Telon cup was placed in a Parr 4781 digestion bomb and heated in a microwave system for 1 min at 265 W. Blank samples were prepared analogously. Sub-samples were spiked with a known amount of the analyte. After cooling at room temperature, the bomb was opened carefully in a fume cupboard. Sodium hydroxide and an appropriate buffer solution were used to adjust the pH of the inal digests. The mixture was inally diluted to 25 mL with double deionized water. These solutions were analyzed immediately after preparation.
Multivariate optimization
The procedure was optimized by the simplex design methodology using the basic algorithm. Three variables were regarded as experimental variables (pH, sampling low rate and eluent (HCl) concentration) due their great importance in the automated online preconcentration system. Initial experimental values that consist of the tetrahedron vertices of the irst simplex igure were chosen with the aim of attaining the optimum values quickly. In all optimization process a 50 mg L-1 manganese solution and
a preconcentration time of 1 min were used.
Results and Discussion
Optimization procedure
The variables expected to have the greatest effect on the automated manganese preconcentration system were Figure 1. Schematic diagram of the automated low system used to
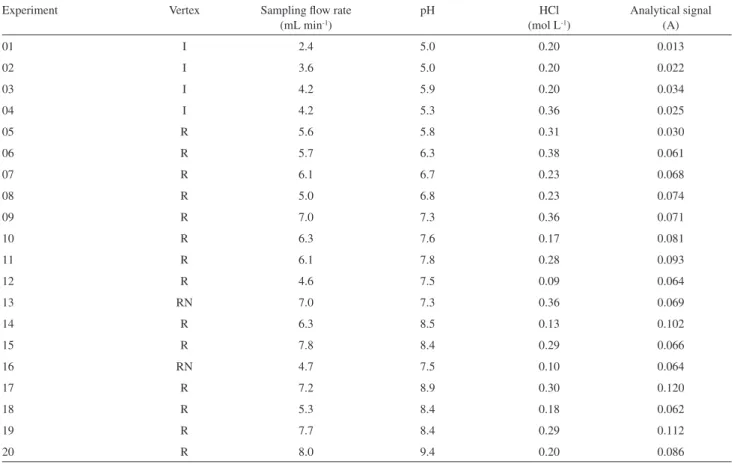
sampling low rate, pH and eluent (HCl) concentration and they were used for the optimization step. The initial simplex design was consisted of four vertices (one more than the number of variables) and it was established by the initial values (represented by the letter I in Table 1). The experiments described by the initial simplex design were performed and their analytical signal (absorbance) values are also presented in Table 1. The simplex igures were moved in the direction given by the rules of the basic algorithm.11 Thus, the worst vertex was rejected and
the new simplex was established by calculating the next relection vertex.
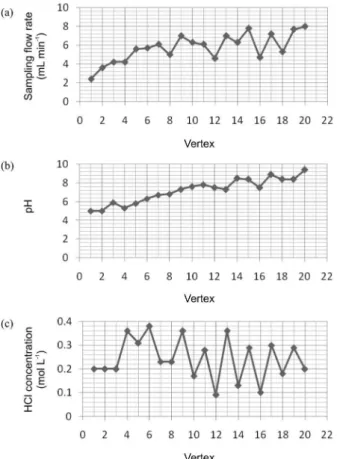
Figures 2(a), (b) and (c) show the values of the three parameters as a function of the vertex number. The sampling low rate and pH proiles present trends to higher values when the vertices are dislocated to the optimal region showing the great influence of these variables in the preconcentration process. However, HCl concentration showed considerable variation but no obvious trend.
The experiments were then performed using the established vertices until no further improvement in the analytical signal was observed, as shown in Figure 3. As it can be seen, the highest absorbance value was obtained
at vertex 17. Thus, the optimum conditions of experiment 17 (7.2 mL min-1 for sampling low rate, 8.9 for pH and
0.30 mol L-1 for HCl concentration) were selected to
establish the analytical characteristics for the automated system.
Analytical characteristics
Under optimum working conditions and using 1 min as preconcentration time, the analytical igures of merit obtained for the automated online solid-phase extraction system for Mn are summarized in Table 2. The regression curve obtained from the preconcentration process was A = 0.00223 CMn + 0.0093, where A is the absorbance and CMn is the manganese concentration in solution, in µg L-1. It was observed that lack of it was not signiicant
(p-value = 0.8516 > 0.05 for a 95% conidence level) for this regression. Conventional analytical curve (without preconcentration) resulted in the following equation: A = 0.000159 CMn + 0.0048. This equation was obtained under optimum conditions of the spectrometer. Again, lack of it was not signiicant for this regression (p-value = 0.4695 > 0.05).
Table 1. Values obtained from simplex optimization
Experiment Vertex Sampling low rate
(mL min-1)
pH HCl
(mol L-1)
Analytical signal (A)
01 I 2.4 5.0 0.20 0.013
02 I 3.6 5.0 0.20 0.022
03 I 4.2 5.9 0.20 0.034
04 I 4.2 5.3 0.36 0.025
05 R 5.6 5.8 0.31 0.030
06 R 5.7 6.3 0.38 0.061
07 R 6.1 6.7 0.23 0.068
08 R 5.0 6.8 0.23 0.074
09 R 7.0 7.3 0.36 0.071
10 R 6.3 7.6 0.17 0.081
11 R 6.1 7.8 0.28 0.093
12 R 4.6 7.5 0.09 0.064
13 RN 7.0 7.3 0.36 0.069
14 R 6.3 8.5 0.13 0.102
15 R 7.8 8.4 0.29 0.066
16 RN 4.7 7.5 0.10 0.064
17 R 7.2 8.9 0.30 0.120
18 R 5.3 8.4 0.18 0.062
19 R 7.7 8.4 0.29 0.112
20 R 8.0 9.4 0.20 0.086
The enrichment factor was calculated as the ratio of the slopes of the linear section in calibration graphs for preconcentration and direct aspiration, respectively.25 An
enrichment factor of 14 was obtained for this system. The concentration eficiency (CEF) was deined as the product of the enrichment factor and the sample frequency, expressed in min-1. The consumptive index
(CI) was also calculated. This parameter was deined as the volume of the sample consumed to achieve a unit of
EF.25 It was calculated by the ratio of the sample volume,
in milliliters, and EF.
The calibration graph for manganese was linear up to 100 µg L-1. The limit of detection (LOD) was calculated
from the calibration curve, as LOD = 3 s / m, where s was the standard deviation of 12 measurements of a reagent blank, and m was the slope of the calibration curve. The limit of quantiication (LOQ) was calculated as LOQ = 10 s/m. From these equations, LOD and LOQ were found to be 2.0 and 6.8 µg L-1, respectively. The precision,
assessed as the relative standard deviation (R.S.D.) of Mn determination was obtained by measuring the analytical signal for 10 cycle times at levels of 50 and 100 µg L-1
Mn. The R.S.D. obtained were 6.3% (50 µg L-1) and 5.4%
(100 µg L-1). Memory effect was not observed using the
developed procedure probably because a 0.30 mol L-1
solution was enough to clean the inner walls of tubes and connections from preconcentration system.
Robustness study24,25 was carried out using Placket
Burman design 23-1 (Table 5). For this manganese
preconcentration system, modiications in the optimum value for sampling low rate above 2.8% have signiicant effects on the signal (see Pareto Graph in Figure 4). On the other hand, modiications in the optimum values for pH Figure 2. Evolution of the variables levels values with the trials deined
by the simplex design method, (a) sampling low rate, (b) pH and (c) eluent concentration.
Figure 3. Evolution of analytical signal with the trials deined by the simplex design method.
Table 2. Analytical characteristics of the automated online preconcentration system for manganese determination using AT/XAD-4
Limit of detection (LOD) 2.0 µg L-1
Limit of quantiication (LOQ) 6.8 µg L-1
Precision 6.3% (50 µg L-1); 5.4% (100 µg L-1)
Enrichment factor 14
Concentration eficiency 12 min-1
Consumptive index 0.51 mL
Sampling frequency 51.3 h-1
Table 5. (a) Modiication levels from optimum value and (b)
Plackett-Burman 23-1 design for robustness study of the preconcentration system
for manganese determination
(a)
Variable +1 0 −1
SFR (mL min-1) 7.0 (−2.8%) 7.2 7.4 (+2.8%)
pH 8.6 (−3.4%) 8.9 9.2 (+3.4%)
[HCl] (mol L-1) 0.29 (−3.4%) 0.30 0.31 (−3.4%)
(b)
SFR (mL min-1) pH [HCl] (mol L-1) Absorbances
−1 −1 −1 0.119/0.122
1 −1 1 0.118/0.119
-1 1 1 0.121/0.121
1 1 −1 0.119/0.120
SFR: Sampling low rate.
Table 4. Determination of manganese in river waters and spike tests
(µg L-1, n = 3)
Sample Added Found Recovery (%)
River water 1 0 19.2 ± 0.2
-20.0 40.2 ± 0.8 105
River water 2 0 13.8 ± 0.1
-20.0 32.5 ± 0.4 94
River water 3 0 67.6 ± 0.5
-20.0 88.1 ± 0.2 103
and eluant concentration below 3.4% have none signiicant effects on the system performance.
Accuracy and application
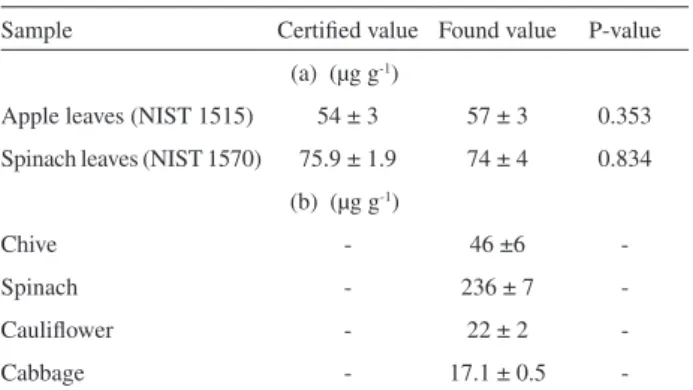
Manganese was determined in two standard reference materials (spinach leaves, NIST 1570 and apple leaves, NIST 1515) in order to evaluate the accuracy of the developed procedure. These samples were digested using the procedure described previously. Table 3 presents the results of this experiment. The manganese contents established by the present procedure agreed well with the certiied values. The results indicate the effectiveness and accuracy of the procedure.
The proposed procedure was applied to determine manganese in vegetal leaves (chive, spinach, caulilower and cabbage) and also river waters collected from Jequié city urban area. Results are presented in Table 3 and 4. Analysis of variance (ANOVA) was applied to these two groups of results. For a conidence level of 95%, p-values have demonstrated that there are none signiicant differences between these groups (p-value > 0.05).
Results demonstrate the applicability of the proposed online system to determine manganese in these matrices. Considering the mass of the food, the limit of detection of the procedure is 1.0 µg g-1.
Conclusions
The use of a basic simplex design method allowed the easy and fast optimization of an automated online preconcentration system for manganese determination in river water and vegetal leaves. The automation of the procedure diminished the errors associated with the operation of manual valves normally used in these kinds of systems and increased the FAAS performance, presenting analytical characteristics that allow manganese determination at low concentration levels. The developed system is simple, rapid, easy to use, selective, and with adequate sensitivity. The manganese contents found in the analyzed matrices are at an acceptable level, suggesting that these foods are adequate for human consumption. The developed method is presented as a good alternative for the routine determination of manganese in vegetal leaves and river waters samples.
Acknowledgments
Authors acknowledge the inancial support of Fundação de Amparo à Pesquisa do Estado da Bahia (FAPESB), Conselho Nacional de Desenvolvimento Cientíico e Tecnológico (CNPq) and Pró-Reitoria de Pesquisa e Pós-Graduação (PPG) from Universidade Estadual do Sudoeste da Bahia (UESB).
References
1. Granado-Castro, M. D.; Galindo-Riaño, M. D.; Vargas, M. G.; Spectrochim. Acta, Part B 2004, 59, 577.
2. Souza, A. S.; Santos, W. N. L.; Ferreira, S. L. C.; Spectrochim. Acta, Part B 2005, 60, 737.
Table 3. Determination of manganese in (a) standard reference material and (b) vegetal samples (n = 3)
Sample Certiied value Found value P-value
(a) (µg g-1)
Apple leaves (NIST 1515) 54 ± 3 57 ± 3 0.353 Spinach leaves (NIST 1570) 75.9 ± 1.9 74 ± 4 0.834
(b) (µg g-1)
Chive - 46 ±6
-Spinach - 236 ± 7
-Caulilower - 22 ± 2
3. Lemos, V. A.; Baliza, P. X.; Carvalho, A. L.; Oliveira, R. V.; Teixeira, L. S. G.; Bezerra, M. A.; Talanta 2008, 77, 388.
4. Saracoglu, S.; Soylak, M.; Peker, D. S. K.; Elci, L.; Santos, W. N. L.; Ferreira, S. L. C.; Lemos, V. A.; Anal. Chim. Acta 2006,
575, 133.
5. Teixeira, L. S. G.; Bezerra, M. A.; Lemos, V. A.; Santos, H. C.; Jesus, D. S.; Costa, A. C. S.; Sep. Sci. Technol. 2005, 40, 2555. 6. Bezerra, M. A.; Santos, W. N. L.; Lemos, V. A.; Korn, M. G.
A.; Ferreira, S. L. C.; J. Hazard. Mater. 2007, 148, 334. 7. Sousa, A. S.; Brandão, G. C.; Santos, W. N. L.; Lemos, V. A.;
Ganzarolli, E. M.; Bruns, R. E.; Ferreira, S. L. C.; J. Hazard. Mater. 2007, 141, 540.
8. Ferreira, S. L. C.; Lemos, V. A.; Santelli, R. E.; Ganzarolli, E.; Curtius, A. J.; Microchem. J. 2001, 68, 41.
9. Spendley, W.; Hext, G. R.; Himsworth, F. R.; Technometrics
1962, 4, 441.
10. Bruns, R. E.; Scarminio, I. S.; Barros Neto, B.; Statistical Design, Chemometrics, Elsevier: Amsterdam, 2006.
11. Lundstedt, T.; Seifert, E.; Abramo, L.; Thelin, B.; Nyström, A.; Pertensen, J.; Bergman, R.; Chemom. Intell. Lab. Syst. 1998,
42, 3.
12. Massart, D. L.; Vandeginste, B. G. M.; Buydens, L. M. C.; De Jong, S.; Lewi, P. J.; Smeyers-Verbeke J.; Handbook of Chemometrics and Qualimetrics: Part A; Elsevier: Amsterdam, 1997.
13. Cortazar, E.; Zuloaga, O.; Sanz, J.; Raposo, J. C.; Etxebarria, N.; Fernández, L. A.; J. Chromatogr., A 2002, 978, 165.
14. Dahlén, J.; von Eckardstein, S.; Forensic Sci. Int. 2006, 157, 93.
15. Pasamontes, A.; Callao, P.; Chemom. Intell. Lab. Syst. 2006, 83, 127.
16. Momenbeik, F.; Momeni, Z.; Khorasani, J. H.; J. Pharm. Biomed. Anal. 2005, 37, 383.
17. Pulgarín, J. A. M.; Molina, A. A.; Pardo, M. T. A.; Anal. Chim. Acta 2005, 528, 77.
18. Silva, H.; Álvares-Ribeiro, L. M. B. C.; Talanta 2002, 58, 1311. 19. Srijaranai, S.; Burakham, R.; Deming, R. L.; Khammeng, T.;
Talanta 2002, 56, 655.
20. Lemos, V. A.; David, G. T.; Microchem. J. 2010, 94, 42.
21. Lemos, V. A.; Novaes, C. G.; Bezerra, M. A.; J. Food Compos. Anal. 2009, 22, 337.
22. Lemos, V. A.; Novaes C. G.; Lima A. S.; Vieira D. R.; J. Hazard. Mater. 2008, 155,128.
23. Danzar, K.; Currie, L. A.; Pure Appl. Chem. 1998, 70, 993.
Submitted: May 3, 2010