Article
J. Braz. Chem. Soc., Vol. 26, No. 12, 2520-2524, 2015. Printed in Brazil - ©2015 Sociedade Brasileira de Química 0103 - 5053 $6.00+0.00
A
*e-mail: [email protected]
Enhancement of Optical Absorption, Photoluminescence and Raman Transitions in
Bi
2O
3-GeO
2Glasses with Embedded Silver Nanoparticles
Maylon M. Martins,a Diego S. Silva,a,b Luciana R. P. Kassab,*,a Sidney J. L. Ribeiroc and
Cid B. de Araújod
aFaculdade de Tecnologia de São Paulo, CEETEPS/UNESP, 01124-060 São Paulo-SP, Brazil
bDepartamento de Engenharia de Sistemas Eletrônicos, Escola Politécnica da USP, 05508-900 São Paulo-SP, Brazil
cInstituto de Química, Universidade Estadual Paulista-UNESP, CP 355, 14870-90 Araraquara-SP, Brazil
dDepartamento de Física, Universidade Federal de Pernambuco, 50670-901 Recife-PE, Brazil
The influence of silver nanoparticles (Ag-NPs) on the optical properties of Bi2O3-GeO2 glasses
was investigated aiming the characterization of their potential for applications in photonic devices. The samples were prepared by the melt-quenching technique starting from high purity oxides
(GeO2, Bi2O3 and AgNO3). Heat-treatment during different times was performed to nucleate
Ag-NPs. A transmission electron microscope was used to confirm the presence of Ag-NPs and to determine their sizes and composition. The glass network was studied by spontaneous Raman scattering. The optical absorption spectra showed an absorption band at ca. 500 nm associated to the bismuth ions, and a 7-fold enhancement of absorption was observed in the samples with Ag-NPs. Photoluminescence (PL) spectra were obtained by exciting the samples with a 808 nm laser. Maximum enhancements of ca. 100% of the PL band centered at 1300 nm and ca. 70% of the Raman spectrum were observed due to the nucleation of the Ag-NPs. The enhanced optical response of the samples with Ag-NPs is attributed to the growth of the local field on the isolated bismuth ions and clusters that are located in the vicinity of the nanoparticles. The results illustrate
the large potential of Bi2O3-GeO2 with Ag-NPs to be used in photonic devices.
Keywords: heavy metal oxide glass, silver nanoparticle, germanate glass, infrared photonic device
Introduction
Heavy metal oxide (HMO) glasses are attracting large attention because of their linear and nonlinear optical properties that make them ideal candidates for applications such as ultrafast optical switches, optical limiters and active photonic devices.1-18 In general, besides low optical
absorption in the visible and in the near-infrared (NIR) regions, the HMO glasses present high index of refraction (ca. 2.0), low cutoff phonon energies (ca. 800 cm-1),
large polarizability, large resistance to moisture and good thermal stability that allow the fabrication of optical fibers. Particularly, the glasses containing bismuth oxide (Bi2O3) deserve large attention because of the broadband
photoluminescence (PL) from 1000 to 1600 nm, due to bismuth (Bi) ions.12-17 Ren etal.,14,15 for instance, reported
efficient optical amplification in the region 1272-1348 nm
using Bi-doped magnesium-germanate,14 and Bi-doped
germano-silicate glasses,15 and Dianov et al.18 demonstrated
laser action between 1150 and 1300 nm in a Bi-doped
aluminosilicate fiber.18 The NIR broadband emission
was also observed in a Bi-doped soda-lime silicate,16 and
chalcogenide glass.17 Therefore new possibilities for optical
communications using optical fibers containing bismuth in comparison with the results already reported with rare-earth ions doped fibers are envisaged.
In the present work we investigate the influence of silver nanoparticles (Ag-NPs) on the optical properties of Bi2O3-GeO2 glasses. The main motivation for this work
was to obtain a composite material with enhanced optical properties in comparison with the well-known Bi2O3-GeO2
Martins et al. 2521 Vol. 26, No. 12, 2015
scattering cross-section due to the presence of the Ag-NPs. In the Experimental section we describe the methods and techniques used for fabrication and characterization of the glasses. In the Results and Discussion section we report on the structural and optical properties of the samples. Finally, in the Conclusions, we present a summary of the results.
Experimental
The samples investigated were fabricated using the melt-quenching method with the starting composition (in mol%): 89.6GeO2-9.6Bi2O3-0.8AgNO3. The reagents were
melted in an alumina crucible for 1 h at 1200 ºC, quenched in a preheated brass mold, annealed at 420 ºC during 1 h (to avoid internal stress) and cooled to room temperature inside the furnace. After this procedure, the samples were polished and cut in order to have parallel faces. The samples prepared with AgNO3 were heat-treated (HT) during 1, 12
and 24 h at 420 °C to thermally reduce the Ag+ ions to Ag0
and to nucleate the Ag-NPs. The melting temperature of 1200 ºC was chosen based on our previous experiments that showed higher NIR luminescence when compared to the emission from the samples melted at 1100 ºC. Samples with composition (in mol%): 86GeO2-14Bi2O3 and
80.4GeO2-19.6Bi2O3 were also prepared, without Ag-NPs,
and melted at 1100 ºC and 1200 ºC, for comparison with the optical response of the glass containing Ag-NPs.
A 200 kV transmission electron microscope (TEM) was used to determine the sizes and shapes of the Ag-NPs. Energy dispersive X-ray spectroscopy was performed during the TEM analysis in order to confirm the presence of Ge, Bi and Ag-NPs. Electron diffraction measurements were performed to determine the crystalline structure
of Bi NPs according to JCPDS-ICDD data base.19 For
these measurements the samples were milled, mixed with distilled water, and partially decanted. The floating part was
taken by using a metallic screen and analyzed by TEM. The linear optical absorption spectra were measured with a spectrophotometer operating from 350 to 1600 nm. The PL measurements were made by exciting the samples with a 808 nm continuous-wave diode laser (maximum power: 200 mW). A spectrometer, attached to a photomultiplier and a computer, was used to analyze the PL signals. Spontaneous Raman scattering measurements using a laser operating at 532 nm were performed to study the glass network. All measurements were made with the samples at room temperature.
Results and Discussion
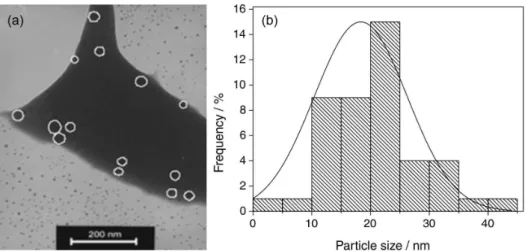
The TEM images obtained for samples HT during 1 h showed the presence of Ag-NPs with average diameter of ca. 20 nm. One representative TEM image is shown in Figure 1a and the size distribution of the NPs is shown in Figure 1b.
Figure 2 shows energy dispersive spectroscopy (EDS) results that confirm the presence of Ge, Bi and Ag in the samples. The features corresponding to the Cu K line are Figure 1. (a) TEM image of 89.6GeO2-9.6Bi2O3-0.8AgNO3 (mol%) glass with Ag-NPs, heat treated during 1 hour at 420 °C; (b) size distribution of the Ag-NPs.
Figure 2. EDS spectrum of the 89.6GeO2-9.6Bi2O3-0.8AgNO3 (mol%)
due to the grid where the sample is placed for the TEM measurements.
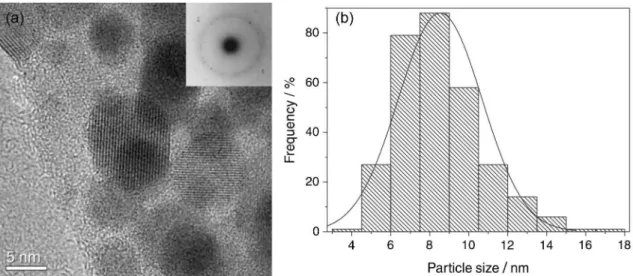
Figure 3a shows a TEM image of Bi NPs that present rhomboedral structure in agreement with literature.19 This
measurement was made with samples without Ag-NPs. The inset of Figure 3a shows the pattern that was used to calculate the diffraction indices (104 and 110) of the Bi structure according to the JCPDS-ICDD data base.20 The
Bi NPs size distribution is presented in Figure 3b and shows average dimensions of ca. 9 nm. We recall that the formation of Bi NPs and Bi clusters due to electron beam irradiation in a TEM was previously reported.19 In the present study
this effect was observed several minutes after starting the irradiation; motion of Bi NPs was noted where the electron beam was focused as well as a tendency of coalescence.
The absorption spectra of the samples prepared with and without Ag-NPs are shown in Figure 4. Notice that the sample without Ag-NPs presents a band centered at ca. 500 nm related to divalent bismuth ions (Bi2+), as reported for other
Bi-doped glasses.21,22 The spectra of the samples with AgNO 3
in the starting composition present a large broadband in the blue-orange region with an amplitude that increases with the increase of the heat-treatment time. This behavior is due to the localized surface plasmons band associated to the Ag-NPs, but it is also possible that the Bi2+ located in
the vicinity of the Ag-NPs are also contributing due to the enhancement of their absorption transitions centered at ca. 500 nm. The 7-fold increase observed in the absorption band is an evidence of the large volume fraction of the Ag-NPs. The inset in Figure 4 illustrates the behavior of the samples without Ag-NPs, heat-treated during 1, 12 and 24 hours. It can be seen a small decrease of the Bi2+ absorption band as
reported for other bismuth doped glasses;21,23 this change is
negligible in comparison with the large increase observed for the samples with Ag-NPs.
Figure 5 presents the PL spectra of the samples excited at 808 nm. The strong band from 1000 to 1600 nm, centered at 1300 nm, is attributed to the Bi+ luminescence centers. A
red-shift of the NIR band in the samples with Ag-NPs can be observed in Figure 5a. For the sample HT during 1 h the NIR band shifted to ca. 1250 nm, whereas for longer heat treatment times the band shifted to ca. 1220 nm. This effect is probably related to changes of the local environment of bismuth in the glass structure, due to the nucleation of Ag-NPs. Analogous behavior was observed in previous work23 where a shift of the NIR band was attributed to
changes in the glass structure.
Figure 3. (a) TEM image of 89.6GeO2-9.6Bi2O3-0.8AgNO3 (mol%) glass without Ag-NPs. The Bi particles observed were formed several minutes after
the exposition to the electron beam irradiation. The inset shows the diffraction pattern that confirms the rhombohedral structure of bismuth; (b) size distribution of the Bi particles.
F i g u r e 4. R o o m t e m p e r a t u r e a b s o r p t i o n s p e c t r a o f t h e 89.6GeO2-9.6Bi2O3-0.8AgNO3 (mol%) glass. The inset shows the behavior
Martins et al. 2523 Vol. 26, No. 12, 2015
Figure 5b shows the results for GeO2-Bi2O3 glasses
prepared without Ag-NPs, melted at 1100 and 1200 ºC. Notice that the samples melted at 1200 ºC present larger NIR emission that indicates a larger number of Bi+ centers.
This was the reason for the choice of the 1200 ºC melting temperature in the present work.
Figure 5a exhibits ca. 100% enhancement of the PL intensity at ca. 1300 nm when a comparison between the
sample HT during 1 h and the sample without Ag-NPs is made. The PL enhancement is attributed to the local field growth in the vicinity of the Ag-NPs. For the samples HT during longer times quenching was observed probably due to the larger number of Ag-NPs nucleated and the reduction of the distances between the Ag-NPs and the luminescence centers. The PL quenching should not be attributed to the oxidation of Bi+ because the change observed in the samples
without Ag-NPs HT during 12 and 24 h is negligible, as illustrated by Figure 5c.
Figure 6 presents the Raman spectra for the samples with and without Ag-NPs. The shoulder in the region from 200 to 300 cm-1 may be attributed to the asymmetric
motion of Bi atoms that are simultaneously half-bridged and half-nonbridged to oxygen (O–Bi-O).24,25 The band
at ca. 430 cm-1 isassigned to the symmetric stretching
of bridged oxygen in bisecting the Ge-O-Ge plane in
predominantly six-membered rings.26 The Raman band
centered at 815 cm-1 is related to the asymmetric vibration
of the nonbridging oxide structures, Ge-O− and B-O. The
Raman signal due to the GeO− vibration is expected to be
dominant in the present case.23 For the samples with Ag-NPs,
the maximum enhancement of ca. 70% was observed due to the enhanced local electromagnetic field in the interface between the Ag-NPs and the dielectric medium, the so-called surface enhanced Raman scattering (SERS) effect.27
Conclusions
This is the first report that shows the influence of silver nanoparticles on the absorption spectrum, near-infrared luminescence and Raman vibrational modes of the Bi2O3-GeO2 glass. The results show that this glass
containing Ag-NPs has large potential to be used for F i g u r e 5. ( a ) P h o t o l u m i n e s c e n c e ( P L ) s p e c t r a o f t h e
89.6GeO2-9.6Bi2O3-0.8AgNO3 (mol%) glass excited at 808 nm, for
different heat-treatment intervals. The sample without Ag-NPs is shown for reference; (b) results of 90.4GeO2-9.6Bi2O3, 86GeO2-14 Bi2O3 and
80.4GeO2-19.6Bi2O3 glasses (mol%), without Ag-NPs, melted at 1100 and
1200 ºC; (c) behavior of the PL spectra for the sample without Ag-NPs
color filters in the blue-orange spectral region as well as for devices requiring intense and large bandwidth luminescence in the 1200-1600 nm region. The 7-fold increase observed for the linear absorption band in the blue-orange region and the ca. 100% enhancement in the NIR luminescence demonstrate the important role of Ag-NPs for the optical performance of this material. Surface enhanced Raman scattering due to the influence of the Ag-NPs was also observed.
Acknowledgements
We acknowledge financial support by the Conselho Nacional de Desenvolvimento Científico e Tecnológico (CNPq) and Fundação de Amparo a Ciência e Tecnologia do Estado de Pernambuco (FACEPE). The work was performed in the framework of the National Institute of Photonics (INCT de Fotônica) project. We acknowledge the Nanotechnology National Laboratory (LNNano), CNPEM-Campinas/Brazil, for the HR-TEM measurements, and Laboratório de Micoreletrônica/EPUSP, for the Raman measurements.
References
1. Sun, H. T.; Fujii, M.; Sakka, Y.; Bai, Z.; Shirahata, N.; Zhang, L.; Miwa, Y.; Gao, H.; Opt. Lett. 2010, 35, 1743.
2. Meng, X. G.; Qiu, J. R.; Peng, M. Y.; Chen, D. P.; Zhao, Q. Z.; Jiang, X. W.; Zhu, C. S.; Opt. Express2005, 13, 1628. 3. Hasegawa, T.; Nagashima, T.; Sugimoto, M.; Opt. Commun.
2005, 250, 411.
4. Kassab, L. R. P.; da Silva, D. S.; de Almeida, R.; de Araújo, C. B.; Appl. Phys. Lett.2009, 94, 101912.
5. Kassab, L. R. P.; da Silva, D. S.; de Araújo, C. B.; J. Appl. Phys. 2010, 107, 113506.
6. Manzani, D.; de Araújo, C. B.; Boudebs, G.; Messaddeq, Y.; Ribeiro, S. J. L.; J. Phys. Chem. B2013, 117, 408.
7. Oliveira, T. R.; Falcão-Filho, E. L.; de Araújo, C. B.; da Silva, D. S.; Kassab, L. R. P.; da Silva, D. M.; J. Appl. Phys. 2013,
114, 073503.
8. de Araújo, C. B.; da Silva, D. S.; de Assumpção, T. A. A.; Kassab, L. R. P.; da Silva, D. M.; The Sci. World J.2013, 385193.
9. da Silva, D. S.; Naranjo, L. P.; Kassab, L. R. P.; de Araújo, C. B.; Appl. Phys. B2012, 106, 1015.
10. Rulkov, B.; Ferin, A. A.; Popov, S. V.; Taylor, J. R.; Razdobreev, I.; Bigot, L.; Bouwmans, G.; Opt. Express2007,
15, 5473.
11. Fujimoto, Y.; Nakatsuka, M.; Appl. Phys. Lett.2003, 82, 3325. 12. Peng, M.; Qin, J.; Chen, D.; Meng, X.; Yang, L.; Jiang X.;
Zhu, C.; Opt. Lett.2004, 29, 1998.
13. Peng, M.; Qiu, J.; Chen, D.; Meng, X.; Zhu, C.; Opt. Lett. 2005,
30, 2433.
14. Ren, J.; Wu, B.; Jiang, X.; Dong, H.; Zeng, H.; Qin, J.; Appl. Phys. B2007, 88, 363.
15. Ren, J.; Dong, H.; Zeng, H.; Hu, H.; Zhu, C.; Qin, J.; IEEE Photonics Technol. Lett.2007, 19, 1395.
16. Arai, Y.; Suzuki, T.; Ohishi, Y.; Morimoto, S.; Khonton, S.;
Appl. Phys. Lett.2007, 90, 261110.
17. Hughes, M. A.; Akada, T.; Suzuki, T.; Ohishi, Y.; Hewak, D. W.;
Opt. Express2009, 17, 19345.
18. Dianov, C. M.; Dvoyrin, V. V.; Mashinsky, V. M.; Umnikvov, A. A.; Yaskov, M. V.; Guryanov, A. N.; Quantum Electron. 2005,
35, 1083.
19. Sepulveda-Guzman, S.; Elizondo-Villarreal, N.; Ferrer, D.; Castro, A. T.; Gao, X.; Zhou, J. P.; Yacaman, M. J.;
Nanotechnology2007, 18, 335604
20. JCPDS International Centre for Diffraction Data 2003 PDF 85-1330; PCPDFWIN v. 24.
21. Guo, X.; Li, H. J.; Su, L. B.; Yu, P. S.; Zhao, H. Y.; Liu, J. F.; Xu, J.; Laser Phys. 2011, 21, 901.
22. Miller, A. E.; Nassau, K.; Lyons, K. B.; Lines, M. E.; J. Non-Cryst. Solids1988, 99, 289.
23. Jiang, X.; Su, L.; Guo, X.; Tang, H.; Fan, X.; Zhan, Y.; Wang, Q.; Zheng, L.; Li, H.; Xu, J.; Opt. Lett. 2012, 37, 4260. 24. Yu, Q.; Chen, F.: Xu, T.; Dai, S.; Zhang, Q.; J. Non-Cryst. Solids
2013, 378, 254.
25. Baia, L.; Kiefer, W.; Simon, S.; Ruman; Rep. Phys. 2004, 56, 430.
26. Durben, D. J.; Wolf, G. H.; Phys. Rev. B1991, 43, 2355. 27. Dousti, M. R.; Sahar, M. R.; Amjad, R. J.; Ghoshal, S. K.;
Awang, A.; J. Lumin.2013, 143, 368.
Submitted:June 27, 2015
Published online: July 31, 2015