QUÍMICA NOVA, 21(3) (1998) 361 STUDY OF THE OPTICAL PROPERTIES OF TeO2-PbO-TiO2 GLASS SYSTEM
Raul F. Cuevas, Ana M. de Paula, Carlos L.Cesar e Luiz C. Barbosa
Instituto de Física - Universidade Estadual de Campinas - CP 6165 - 13083-970 - Campinas-SP Oswaldo L. Alves
Instituto de Química - Universidade Estadual de Campinas - CP 6154 - 13083-970 - Campinas-SP
Recebido em 2/12/96; aceito em 18/2/97
We describe the preparation and some optical properties of high refractive index TeO2-PbO-TiO2 glass system. Highly homogeneous glasses were obtained by agitating the mixture during the melting process in an alumina crucible. The characterization was done by X-ray diffraction, Raman scattering, light absorption and linear refractive index measurements. The results show a change in the glass structure as the PbO content increases: the TeO4 trigonal bipyramids characteristics of TeO2 glasses transform into TeO3 trigonal pyramids. However, the measured refractive indices are almost independent of the glass composition. We show that third-order nonlinear optical susceptibilities calculated from the measured refractive indices using Lines’ theoretical model are also independent of the glass composition. Keywords: tellurite glass; non-linear glasses; high refractive index glass.
ARTIGO
INTRODUCTION
Tellurium oxide based glasses are potential materials for optical device applications due to their nonlinear optical properties. They show high refractive index, and consequently high third order nonlinear susceptibility χ(3), and high dielectric constant1,2. Also, they are transparent over the visible and near infrared regions. Kim et al3 have measured for a pure TeO2 glass a value of χ(3)=1.41x10⁻¹²esu, however it is not easy to obtain this pure glass. Some recent works have shown that the addition of TiO2.PbO and Nb2O5 increases the glass stability and refractive index4-7.In particular, the TeO2-PbO-TiO2- glass system have presented the highest χ(3) values, in the range from 2x10-12 to 4x10-12 esu5,6. Nonetheless, the dependence of the nonlinear properties on the concentration of the three components is not yet clearly established. The discrepancies in the measured
χ(3) values are still quite high, probably due to inhomogeneities in the glass5,6.
In this work we present a study of the properties of this glass system as a function of the PbO composition. We have synthesised (90-x)TeO2:xPbO:10TiO2 glasses with x=5, 10, 15, 20 and 25 mol%. We obtained high homogeneous glasses by agitating the mixture during the melting process. The glasses were characterized by means of X-ray diffraction (XRD), Raman scattering, optical absorption and linear refractive index measurements. Most of the measured properties show the already observed6,8 change in the glass structure as the PbO content increases: the TeO4 trigonal bipyramids characteristics of TeO2 glasses break into the TeO3 trigonal pyramids. Nonetheless, the measured refractive indices are almost independent of the glass composition. Calculated χ(3) values
using Lines' theoretical model9,10 are alson independent of the glass composition
EXPERIMENTAL
We studied a series of five (90-x)TeO2:xPbO:10TiO2 glass samples with 5, 10, 15, 20 and 25 mol%, which we denote as PTT1, PTT2, PTT3, PTT4, and PTT5, respectively (see Table 1). The materials used were reagent grade TiO2 (from Merck), TeO2 (from Merck) and PbO (from Riedel). A bath of 25 grams of the mixture for each composition was placed directly in an alumina crucible in an electric furnace. The mixture was agitated during the melting process in order to obtain homogeneous concentrations. Melting was achieved at a temperature of 900oC for 20 minutes. The melt was quenched between a pair of stainless steel plates and later annealed for 2 hours at 300oC. The samples were prepared in two forms: powder for the XRD, and approximately 1 mm thick slabs for the other measurements.
The glassy state was confirmed by X-ray diffraction analysis using CuKα radiation in a Shimadzu difractometer. The Raman spectra were measured using the argon ion laser lineat 514.5 nm at backscattering geometry and a triple Jobin-Yvonspectrometer with multichannel detection. The absorption measurements were obtained using a Perkin-Elmer Lambda 9 spectrophotometer.
For the refractive index measurements we used a manual Rudolph null ellipsometer (model 436) with a 150 W tungsten lamp as a light source. The desired wavelengths were selected by interference filters. The output power of the ellipsometer optics was measured with a commercial liquid-nitrogen-cooled InAs detector, whose signal was integrated by a lock-in
Table 1. Parameters used in the χ(3) calculations and the obtained values considering f = 1.72.
Glass Composition n fL Eo ld χ(3)
(mol %) at 1.907 µm (eV) (Å) (10-12 esu)
PTT1 5PbO-10TiO2-85TeO2 1.871 1.834 4.87 1.923 3.49
PTT2 10PbO-10TiO2-80TeO2 1.850 1.808 4.73 1.932 3.48
PTT3 15PbO-10TiO2-75TeO2 1.854 1.813 4.75 1.942 3.54
PTT4 20PbO-10TiO2-70TeO2 1.855 1.814 4.78 1.952 3.54
362 QUÍMICA NOVA, 21(3) (1998) amplifier. The use of a less noisy detector instead of the cooled
PbS detector supplied by the manufacturer has proved to be essential to achieve the experimental errors of 0.1%.
RESULTS AND DISCUSSIONS Glass Formation
The preparation procedure described in the experimental permitted us to obtain bubble free transparent glasses with high homogenity and a yellowish colour. All the compositions showed the XRD patterns typical for a glass phase presenting an halo near 2θ=22,5o.
Raman Spectra
The Raman spectra from the PTT glasses are presented in figure 1. We have observed the following features in the spectra: a band at 135 cm-1 which is assigned to the PbO vibrations8, a broad band around 478 cm-1 which is assigned to Te-O-Te bending modes11, whose intensity decreases as the PbO content increases. The two bands observed around 682 and 773 cm-1 have been assigned to the stretching vibrations of TeO4 trigonal bipyramids, characteristics of TeO2 glasses, and stretching vibrations of the TeO3 trigonal pyramids, respectively8,11. Note that as the PbO content increases the intensity of the TeO3 band increases with relation to that of the TeO4 band, and the TeO3 band is the most intense band for the samples PTT4 and PTT5. Also these bands shift slightly to lower Raman energy as the PbO concentration increases. There is also a weak band at about 300 cm-1 for PbO contents greater than 15 mol% which has been assigned to the bending vibrations of TeO3 trigonal pyramids with non-bridging oxygen. These results are consistent with the structural change observed for PbO:TeO2 glass systems, as the PbO content increases the TeO4 trigonal bipyramids break into TeO3 trigonal pyramids. Nonetheless this change is slower when compared to Li2O:TiO2:TeO2 glasses7. Yamamoto et al5, presented quantitative measurements of the Te coordination number in these two glass systems that showed this same trend.
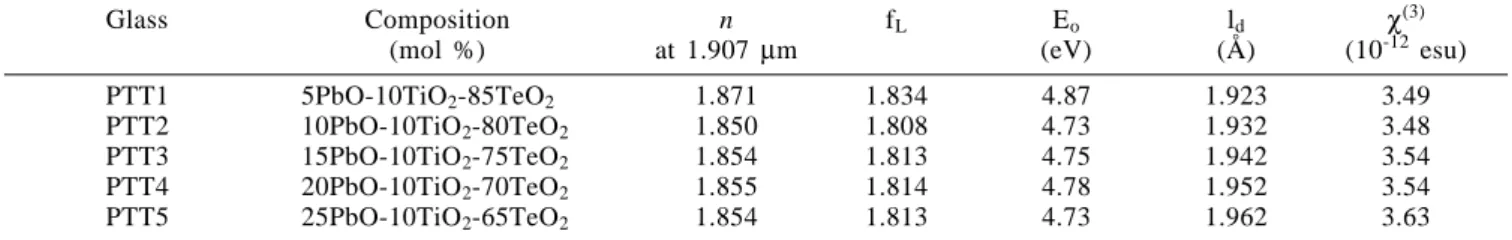
From the transmission curve we calculated the optical absorption coefficient α. In order to obtain the optical energy gap we plotted (α E)2 as a function of energy E, figure 2 shows the curves for the samples PTT1 and PTT2. The values of the optical energy gap were obtained from the extrapolation of the linear regions of the plots to (α E)2 = 0. The optical gap is at about 2.94 eV for all the PbO compositions.
Linear Refractive Index
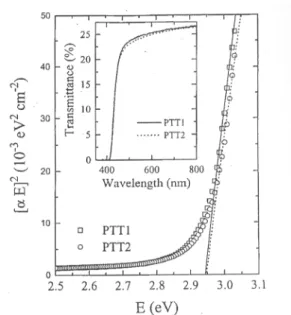
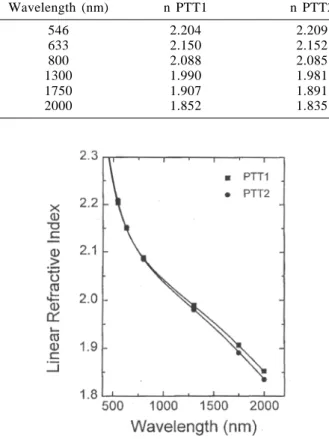
We have measured the linear refractive index, n, of the glasses for wavelengths centred at 546, 633, 800, 1300, 1750 and 2000 nm. The bandwidth of the used filters was of 70 nm. The values are listed in table 2, the experimental errors are about 0.1%. The figure 3 shows the linear refractive index dispersion, the solid lines are extrapolation curves. In figure 4 we plot the refractive index as a function of PbO content for all the measured wavelengths. Note that there is just a small change with the PbO content: the values for the PTT1 sample are slightly larger than for the other samples, at the high wavelength region. Also plotted in figure 4 are the linear refractive index data at 632.8 nm (crosses) from Yamamoto et al6. The values are comparable, however their results show an increasing trend with PbO content which we do not observe.
We have calculated Ed and Eo using the expression for n as a function of the energy E proposed by Wemple12: 1/(n2-1)= Eo/Ed-E2/EoEd), where Eo is the average excitation energy for electronic transition and Ed is the electronic oscillator strength related to dispersion. The Eo values (listed in table 1) will be used to calculate the nonlinear refractive index.
Nonlinear Refractive Index
To calculate the nonlinear refractive index we used Lines’ bond-orbital theory9,10, that considers the influence of cationic empty d-orbital on the glass nonlinear optical response. The contribution of the d-orbital to the nonlinear response is proportional to the decrease of the bond length between cation and anion ld and to the increase of the orbitals overlap 〈d|p〉. He studied a number of transparent transition-metal oxides and found that this contribution is negligible for bond lengths ld〉 2.3 Å, but increases rapidly as the bond length decreases and becomes
Figure 1. Raman spectra of the PTT glass system. The spectra were
arbitrarily shifted vertically for clarity.
Optical Absorption
We have measured the glass transmission in the wavelength range 250 to 1500 nm. The transmittance are shown in the inset of figure 2 for the samples PTT1 and PTT2, the curves are almost flat from 800 to 1500 nm. The curves for the other samples (PTT3 to PTT5) are indistinguishable from the PTT2 curve. The UV-Vis cut-off wavelength is at about 420 nm for all compositions.
Figure 2. Plot of (α E)2 as a function of energy for the PTT glass
QUÍMICA NOVA, 21(3) (1998) 363
n2
( )
av =25 f 3fL 3l
d
2
(
n2−1)
E S 6n ES 2−h2ω2
(
)
4 10-13esu
(
)
(1)where fL=(n2+2)/3 is the Lorentzian local field enhancement factor9, n is the long-wavelength limit value of the refractive index, Es in eV is the effective Sellmeier energy gap which takes in account the contributions of the sp and d orbitals, and ld in Å
is the bond length for the ternary glass. The Sellmeier gap is in practice equal to Eo in Wemple’s equation12, values are listed in table 1. The bond lengths for the ternary glasses were estimated using the method proposed by Nassau13, with the Pb-O, Ti-O and Te-O bond lengths as 2.24 Å, 1.96 Å and 1.91 Å, respectively10. Also, we use the following equation9 to convert n2 into χ(3):
χ( )3
(
−3ω,ω,ω,ω)
= n3πn2
( )
av(
esu)
(2)The estimated χ(3) at the wavelength of 1.907 µm (the wavelength for the measured data of Yamamoto et al6) are given in table 1 and plotted in figure 5 (circles), for the PTT glasses. Note that the results are almost independent of the PbO content. To compare our results with the data of Yamamoto et al6 (triangles) we have used f=1.72, we chose to make the values of χ(3) equal to the experimental value for the PbO content of 25 mol%. This f value is close to the value of 1.9±0.1 obtained by Lines10 for transition-metal oxides dominated by d-band response. This is an indication that Lines’ model, which assumes that the high nonlinear optical response is due to virtual excitations from the cationic sp levels to vir-tual d levels, is valid for TeO2 based glasses. Kim et al3 have already shown that this model can be used for a TeO2 pure glass, where the most probable optical transition is the electron transfer from 2pπ orbitals of the Oxygen to the empty non-bonding 5d orbitals of Tellurium. We have also shown that this model holds for the Li2O:TiO2:TeO2 glass system7.
It should be pointed out that for the Li2O:TiO2:TeO2 glass system the refractive index and χ(3) decrease as the TeO
2 is substituted by the Li2O, due to the change of TeO4 trigonal bibyramids into TeO3 trigonal pyramids. One would then expect that slower structure change in the PbO:TiO2:TeO2 glasses would result in a slow decrease in the refractive index. Nonetheless the measured values are almost independent of the PbO content. Thus, the presence of the PbO should increase the refractive index to compensate the decrease due to the glass structure change.
CONCLUSIONS
We present highly homogeneous TeO2-PbO-TiO2 glasses with high refractive index. It was found that the Raman peaks to depend on the PbO content. On contrast, the UV-Vis cut-off, optical gap and the linear refractive index were found to be almost independent of the PbO content. These trends are consistent with a glass structure change, with TeO4 trigonal bipyramids breaking into TeO3 trigonal pyramids as the PbO content increases. The almost constant refractive indices may be explained by two Table 2. Measured refractive index as function of wavelength for the PTT glasses.
Wavelength (nm) n PTT1 n PTT2 n PTT3 n PTT4 n PTT5
546 2.204 2.209 2.208 2.207 2.208
633 2.150 2.152 2.153 2.151 2.152
800 2.088 2.085 2.085 2.086 2.084
1300 1.990 1.981 1.983 1.981 1.983
1750 1.907 1.891 1.892 1.893 1.892
2000 1.852 1.835 1.835 1.836 1.834
Figure 3. Linear refractive index as a function of the wavelength for
the PTT glass system. The squares are for the PTT1 sample and circles for the PTT2. The results for the PTT3, PTT4 and PTT5 are indistinguishable from those for the PTT2 glass. The lines are extrapolation curves.
Figure 4. The linear refractive index of the PTT glass system as a
function of the PbO content. The wavelengths in nm are indicated at the right side of the plot. The crosses are the data of Yamamoto et al6.
dominant for ld 〈 2.0 Å. The nonlinear optical response was obtained using a variational method to describe the effect of an applied electric field ƒEx along the bond direction x in the
364 QUÍMICA NOVA, 21(3) (1998) contributions acting in opposite directions. The PbO itself
increases the refractive index, however the increase in PbO content also increases the breaking of TeO4 trigonal bibyramids into TeO3 trigonal pyramids, which decreases the refractive index. Nonetheless the χ(3) values are larger than the pure TeO
2 glasses.
ACKNOWLEDGEMENT
The authors acknowledge the Conselho Nacional de Desen-volvimento Científico e Tecnológico (CNPq), Fundação de
Figure 5. Third order susceptibility χ(3) as a function of the PbO
content for the PTT glass system. The circles represent the data from Yamamoto et al6., and the squares are our calculated values.
Amparo à Pesquisa do Estado de São Paulo (FAPESP), Pro-grama de Apoio ao Desenvolvimento Científico e Tecnológico (PADCT) and the Telecomunicações Brasileiras S/A (Telebras) for financial supports.
REFERENCES
1. Inoue, S. and Nokui, A.; Proceedings of the Int. Conf. on Sciece and Technology of New Glasses, ed. Sakka S. and Soga, N.; Tokyo, 1991, p. 77.
2. Nasu, H.; Ibara, Y. and Kubodera, K.; J. Non-Cryst. Solids 1989, 110, 229.
3. Kim, S.-H.; Yoko, T. and Sakka, S.; J. Am. Ceram. Soc. 1993, 76, 2486.
4. Nasu, H., Matsuhita, O.; Kamyia, H.; Kobayashi, H. and Kubodera, K.; J. Non-Cryst. Solids 1990, 124, 275. 5. Nasu, H.; Matsuhita, O.; Kamyia, H.; Kobayashi, H. and
Kubodera, K.; Jpn. J. Appl. Phys. 1992, 31, 3899. 6. Yamamoto, H.; Nasu, H.; Matsuoka, J. and Kamiya, K.;
J. Non-Cryst. Solids 1994, 170, 87.
7. Cuevas, R. F.; Barbosa, L. C.; De Paula, A. M.; Liu, Y.; Reinoso, V. C. S.; Alves, O. L.; Aranha, N. and Cesar, C. L.; J. Non-Cryst. Solids 1995, 191, 107.
8. Khatir, S.; Romain, F.; Portier, J.; Rossignol, S.; Tanguy, B.; Videau, J. J. and Turrel, S. J.; J. Mol. Struct. 1993, 298, 13.
9. Lines, M. E.; Phys. Rev. B 1990, 41, 3372; Phys. Rev. B 1990, 41, 3383.
10. Lines, M. E.; Phys. Rev. B 1991, 43, 11978.
11. Sekiya, T.; Mochida, N.; Ohtsuka, A. and Tonokawa, M.; J. Non-Cryst. Solids 1992, 144, 128.
12. Wemple, S. H.; J. Chem. Phys. 1977, 67, 2151. 13. Nassau, K.; Electron. Lett 1981, 17, 769; Bell. Syst. Tech.