Article
Printed in Brazil - ©2017 Sociedade Brasileira de Química0103 - 5053 $6.00+0.00*e-mail: [email protected]
Non-Invasive Detection of Adulterated Olive Oil in Full Bottles Using Time-Domain
NMR Relaxometry
Poliana M. Santos,a Flávio Vinicius C. Kock,b Maiara S. Santos,b Carlos Manuel S. Lobo,b André S. Carvalhob and Luiz Alberto Colnago*,c
aDepartamento Acadêmico de Química e Biologia, Universidade Tecnológica Federal do Paraná,
Rua Deputado Heitor de Alencar, 5000, 81280-340 Curitiba-PR, Brazil
bInstituto de Química de São Carlos, Universidade de São Paulo, Avenida Trabalhador
São Carlense, 400, 13566-590 São Carlos-SP, Brazil
cEmbrapa Instrumentação, Rua XV de Novembro, 1452, 13560-970 São Carlos-SP, Brazil
A fast procedure using time-domain nuclear magnetic resonance (TD-NMR) to detect olive oil adulteration with polyunsaturated vegetable oils in filled bottles is proposed. The 1H transverse
relaxation times (T2) of 37 commercial samples were measured using low-field nuclear magnetic
resonance (LF-NMR) spectrometer and a unilateral nuclear magnetic resonance (UNMR) sensor. Results obtained with LF-NMR revealed better feasibility when compared with the UNMR sensor, with higher signal-to-noise (S/N) ratio and larger difference in the T2 decays. Principal
component analysis (PCA) exhibited tight and well-separated clusters of pure olive oil (OO), pure soybean oil (SO), and blends of OO/SO (adulterated samples). Soft independent modeling of class analogies analysis (SIMCA) classification model indicated that five brands of olive oil commercialized in Brazil were adulterated with polyunsaturated fatty acids, further confirmed by high-resolution NMR. Overall, LF-NMR provided a fast procedure for screening olive oil authenticity directly in the sealed bottles.
Keywords: time-domain NMR,low-field NMR, adulteration, olive oil
Introduction
Olive oil stands out as the most expensive edible oil and
is among the most frequently adulterated food products.1,2
Olive oil is often adulterated with cheaper vegetable oils, including soybean, corn, sunflower, cotton, hazelnut,
peanut, palm and many others.1-4 Such practice is unfair
not only to consumers, but also to the honest farmers and olive oil industries. Therefore, the detection of olive oil adulteration has driven the development of rapid, reliable, non-destructive, non-invasive and cost effective analytical procedures that could be applied at any stage of the distribution chain.
Currently, almost all analytical instrumental methods are used to detect olive oil adulterations. Gas and liquid chromatography either coupled or not with mass
spectrometry have been the standard analytical methods.5,6
However, these methods are laborious (extensive sample
preparation/derivatization), time consuming, and quite expensive. Consequently, several alternative methods have been proposed, including vibrational spectroscopies (UV-Vis, near infrared (NIR), middle infrared (MIR) and
Raman), electrochemical and high- and mid-resolution 1H,
13C and 31P nuclear magnetic resonance (NMR) methods.7-10
Although these methods have become an attractive alternative due to the ability to analyze samples with little or no sample preparation, they do not allow the analysis in a completely non-invasive fashion. Recently, the feasibility of time-domain nuclear magnetic resonance (TD-NMR) to detect olive oil adulteration in a non-invasive way was
explored by Xu et al.4 In their study, a low cost unilateral
NMR sensor (magnet and surface coil) was applied to detect
olive oil adulteration with sunflower or red palm oil.The
procedure based on a two-dimensional (2D) pulse sequence
that separates the 1H transverse relaxation time (T
2) and
signals using different echo times to encode the diffusion
effect on the T2 decay.
In this paper, the advantages and limitations of rapid, non-invasive TD-NMR procedure to detect olive oil adulteration with polyunsaturated vegetable oils in intact original bottle were investigated. The performance of low-field nuclear magnetic resonance (LF-NMR) spectrometer and unilateral nuclear magnetic resonance (UNMR) sensor were compared in order to obtain a procedure for field applications, i.e., analyses by dealer and consumer in distribution centers and grocery stores.
Experimental
Samples
Corn, canola, sunflower, soybean, hazelnut and olive oil samples were used in this study. All samples were acquired at local stores in the city of São Carlos, SP, Brazil, totaling 37 commercial oil brands from eight different countries (Brazil, Chile, Italy, Spain, Portugal, Greece and Argentina). The samples were stored and analyzed at
23.0 ± 0.5 °C.
The fatty acid contents were determined by gas chromatography (GC) in a system (Shimadzu GC-14B model) equipped with flame ionization detector (FID). The GC separation was evaluated in the omega wax 250 capillary column. The analysis method required the conversion of the triglycerides contained in the olive and soybean oil samples into their corresponding fatty acid
methyl esters (FAME) through transesterification.11
NMR analysis
TD-NMR analysis in the LF-NMR spectrometer
The 1H transverse relaxation time (T
2) measurements
were performed in a 0.23 Tesla SLK-IF-1399 NMR spectrometer (Spinlock Magnetic Resonance Solution, Cordoba, Argentina). The LF-NMR spectrometer was equipped with a permanent magnet Halbach array with 10 cm bore and probe with solenoid coil. The spectrometer was connected to the Apollo console (Tecmag, Houston,
TX, USA). The T2 relaxation curves were evaluated using
Carr-Purcell-Meiboom-Gill (CPMG) pulse sequence with
π/2 pulse width of 35 µs, time between echoes of 0.5 ms,
1000 echoes, and a recycle delay of 1 s. Four scans were accumulated to increase the signal-to-noise (S/N) ratio, with total measurement time in the order of 1 s.
TD-NMR analysis in the UNMR sensor
The homemade UNMR sensor, operating at 24.3 MHz
for 1H nucleus, was used to collect the T
2 relaxation curves.
The UNMR sensor was assembled using four axially magnetized NdFeB alloy blocks (2.54 × 2.54 × 1.27 cm) in a classical steel yoke and connected to an Apollo
console (Tecmag, Houston, TX, USA).12 The T
2 relaxation
curveswere evaluated using a CPMG pulse sequence with
π/2 pulse width of 3 µs, time between echoes of 0.1 ms,
1000 echoes, and a recycle delay of 1 s. Five hundred scans were accumulated in order to increase the S/N ratio, with total measurement time in the order of 5 s.
1H high-resolution NMR analysis
1H high-resolution NMR (1H NMR) analyses were
performed in a 14.1 Tesla Ascend 600 NMR spectrometer (Bruker, Germany) equipped with a 5 mm probe. The
spectra were acquired using 30° pulses, acquisition time of
4.63 s (32k points), recycle delay of 4 s, and accumulation of 4 transients. Before the analyses, the samples were
dissolved in CDCl3.
Data analysis
The T2 relaxation curves collected in the LF-NMR
spectrometer and in the UNMR sensor were normalized (as to the maximum amplitude of the first echo) and analyzed by exponential fitting, inverse Laplace transform (ILT), principal component analysis (PCA), and soft independent
modeling of class analogies(SIMCA).
The exponential fitting of the T2 relaxation curves was
performed by mono- and bi-exponential functions available
in Origin® software, version 9.1 (OriginLab, Northampton,
MA, USA). The ILT was performed using the method
described by Borgia et al.13
PCA was used to find the main variations in the full
T2 relaxation curve decays, whereas SIMCA was used to
develop classification models based on oil type. PCA and
SIMCA models were performed in Pirouette® software,
version 4.5 (Infometrix Inc., Woodville, WA, USA). Before
the analyses, the T2 relaxation curves were mean-centered.
The 1H spectra obtained in the high-resolution NMR
spectrometer were analyzed using topspin software, version 3.2 (Bruker, Germany). The areas of the signals at 2.3 (attributed to oleic acid) and from 5.5 to 5.9 ppm (assigned to linoleic acid) were calculated and the ratio was determined and used to investigate the presence of polyunsaturated fatty acids in olive oil and other oil
samples.3 Ratios lower than 0.2 indicated low contents of
Results and Discussion
Comparison of the performances of UNMR sensor and LF-NMR spectrometer
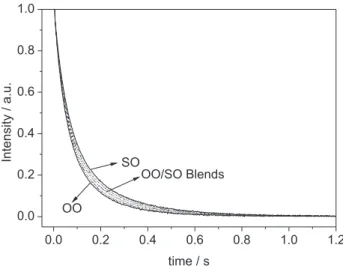
Figure 1 shows the T2 relaxation curves of pure olive
oil (OO) and soybean oil (SO) samples obtained by CPMG pulse sequence using the UNMR sensor (Figure 1a) and the LF-NMR spectrometer (Figure 1b). Although five hundred relaxation curves were average in UNMR signals the S/N ratios were approximately ten-fold lower than those obtained with LF-NMR spectrometer. This large reduction
in the S/N ratio in the T2 relaxation times measured in the
UNMR sensor could be associated with the strong static
magnetic field gradient, 10 T m-1, which restricted the
analysis to a very thin slice (approximately 0.1 mm) of the sample at 5 mm from the sensor surface. Conversely, the relaxation curves in the LF-NMR spectrometer provided higher S/N ratio and much shorter (five-fold) measuring time due to the good magnetic field homogeneity over a
large portion of the bore volume.14 In the Halbach array,
the magnetic field was perpendicular to the cylinder axis, allowing the use of sensitive solenoid coils to excite and detect NMR signals.
Moreover, no differences in the T2 values were observed
between OO and SO samples analyzed in the UNMR
sensor. In this sensor, the T2 relaxation time was also
dependent on the self-diffusion coefficient (D) due to the
high inhomogeneity of the magnet. T2 and D had opposite
effects on the decay, reducing the difference between the two oils. On the other hand, the analysis performed in the
LF-NMR showed a visible difference in the T2 relaxation
times of the two oils (Figure 1b).
For field applications, safety requirements denote an additional problem. The strong magnetic fields used in
NMR spectrometers might attract metallic pieces and lead to serious accidents. In this sense, the limitations and advantages of the UNMR sensor and the LF-NMR spectrometer for field application were investigated. Results showed that the UNMR sensor, at distance of 1 cm from the surface, attracted a medium size plier (300 g) by the tip, imposing a force of approximately 100 N. This is equivalent to an increase of more than twenty five times the plier weight. Conversely, the attracting force of the permanent magnet Halbach array is minimal (1 N at 1 cm from the entrance of the magnet bore). These results indicate that only professional personnel should use the UNMR sensor, whereas the Halbach magnet could be used in field applications without any risks for the analyst.
Given these results, the development of a non-invasive screening method for the detection of adulterated olive oil was evaluated using only the LF-NMR spectrometer.
Analysis ofoil samples using the LF-NMR spectrometer
Figure 2shows thenormalized T2 relaxation decays
of OO, SO, and OO/SO blends (adulterated samples). Table 1 shows the fatty acid composition of OO and SO as determined by gas chromatography. The OO/SO blends were prepared by the addition of SO into OO in order to obtain samples with 12.5, 25.0, 50.0 and 75.0% of adulteration. OO sample showed the fastest decay
(shortest T2), whereas SO sample led to the longest
decay (longest T2), indicating a short T2 relaxation
with increasing OO concentrations. This variation in T2
values could be associated with the differences in oil viscosity, which in turn is dependent on the major fatty acids present in the oil. The composition of OO and SO differed significantly in terms of unsaturated fatty acids
Figure 2. The normalized T2 relaxation curves of (OO) (solid line), OO/SO
blends comprising 25, 50 or 75% of SO (dashed lines), and SO (solid line). Figure 1. T2 relaxation curves of olive oils (OO) (black line) and soybean
with eighteen carbons (C18): OO was shown to be rich in monounsaturated oleic acid (C18:1) whereas SO was rich in polyunsaturated linoleic (C18:2) and linolenic (C18:3) acids (Table 1). The viscosity of fatty acids comprising the same number of carbons decreased with an increase
in fatty acid unsaturation.15
Inverse Laplace transform (ILT) of the T2 relaxation
curves, using regularization parameter α = 1, of OO,
1:1 OO/SO blend, and SO samples are shown in Figure 3. The relaxation spectra showed two strong peaks for each sample, indicating the presence of two proton components
in the fatty acid chains.16 T
2,1 (weak peak close to 0.012 s)
did not show difference among the samples. On the
other hand, T2,2 values ranged from 0.044 (OO sample)
to 0.056 s (SO sample), while T2,3 values ranged from
0.148 (OO sample) to 0.214 s (SO sample). Similar T2
values were obtained from an exponential fitting.
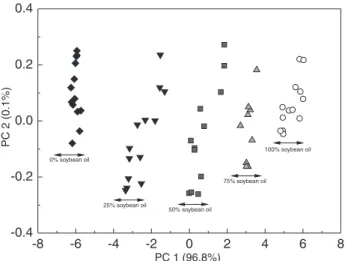
PCA was performed on the maximum normalized
T2 relaxation curves (Figure 4). The first principal
component (PC1) explained 96.8% of the data variation and clearly discriminated the samples (OO/SO blends) according to the adulteration level. The second principal component (PC2) explained most of the remaining data variation (3.2%). The easy separation of the samples based on the adulteration level implies that the application of TD-NMR
for distinguishing OO from OO/SO is simple and, as a result, the method may be applied in commercial samples.
Non-invasive screening of commercial samples
A procedure used to check oil adulteration relies upon the determination of the ratio between the areas corresponding
to the signals at 2.3 and 4.9-5.4 ppm, obtained by 1H NMR.4
Figure 5a shows the results obtained for the 37 commercial oil samples. Samples 1-4 were corn, canola, sunflower, and soybean commercial oils. samples 5-7 were commercial blends of olive oil and soybean, canola, sunflower and corn oils. Sample 8 was hazelnut oil, and samples 9-37 are extra virgin olive oils from different countries.
According to the results (Figure 5a), a ratio higher than 0.2 was observed for the samples 1-7, indicating high contents of polyunsaturated fatty acids. This is in agreement with the analyzed samples (soybean, sunflower, corn, canola, etc.). Most of the commercial extra virgin olive oil and hazelnut oil samples showed ratios lower than 0.2, expect for the olive oil samples 14, 20, 29, 30 and 36. This result suggests a possible adulteration with soybean oil or other polyunsaturated oils.
Due to the high cost of this analysis, a new procedure
based on the correlation of T2 values with the presence
of polyunsaturated fatty acids in olive oils was proposed.
Although the ILT spectra (Figure 3) showed three T2
Table 1. Fatty acid content percentage of olive and soybean oils as determined by gas chromatography
Oleic acid C18:1
Linoleic acid C18:2
Linolenic acid C18:3
Palmitic acid C16:0
Stearic acid C18:0
Olive oil 79.2 2.7 0.6 12.9 3.2
Soybean oil 24.8 52.3 9.6 8.1 4.2
-8 -6 -4 -2 0 2 4 6 8
-0.4 -0.2 0.0 0.2 0.4
0% soybean oil
25% soybean oil
50% soybean oil
75% soybean oil
PC 2 (0.1%)
PC 1 (96.8%)
100% soybean oil
Figure 4. PCA score plot of the full T2 relaxation curves of pure olive
oil (), blends of olive and soybean oils comprising 25 (), 50 () or 75% () of soybean oil, and pure soybean oil ().
components for all oil samples, the best results were
obtained by applying a mono-exponential fitting to the T2
relaxation curves. The obtained results can be observed in Figure 5b. The polyunsaturated oils and blends of olive
oil and polyunsaturated oils (samples 1 to 7) showed T2
values higher than 0.11 s. Most of the commercial extra
virgin olive oil and hazelnut oil samples showed T2 values
below 0.11 s, indicating low polyunsaturated fatty acid contents. However, samples 14, 20, 29, 30 and 36 showed
T2 values greater than 0.11 s, suggesting adulteration with
polyunsaturated oils.
Another alternative is the use of chemometric analysis to develop unsupervised and supervised models using the
raw T2 relaxation curves. As demonstrated elsewhere in
the literature, chemometric analysis of relaxation data has
shown better correlations than fitting procedures.16 The
37 T2 relaxation curves of the commercial oil samples
were first studied using PCA. The first two principal components (PC1 and PC2) explained, together, 97.8% of the data variation. PCA score plot (Figure 6) showed
three clusters: (i) samples 1-7 that, according to the
manufacturer’s labeling, were polyunsaturated oils (corn, canola, sunflower, soybean or blends of olive oil and
soybean, canola, sunflower, and corn oils); (ii) samples 14,
20, 29, 30 and 36 that, based on their labels, were extra
virgin olive oil, but showed T2 higher than 0.11 s (Figure 5);
(iii) hazelnut (sample 8) and olive oil samples (9-13, 15-19,
21-28, 31-35 and 37). The hazelnut oil is indicated by a square symbol in Figure 6.
The SIMCA model obtained with the 37 T2 relaxation
curves of the commercial oil samples showed a good separation between the polyunsaturated oil and olive oil samples, and interclass distance (ICD) of 3.25. The
SIMCA classification performance showed that 100 and 83% of the commercial oil samples were correctly classified as polyunsaturated and olive oil, respectively. Only five commercial olive oil samples were classified as polyunsaturated oil. This agrees with the results shown in Figure 5, where the same olive oil samples (14, 20, 29, 30,
and 36) showed ratios higher than 0.2 in 1H NMR and T
2
above 0.11 s in TD-NMR analyses. For the olive oil sample assigned by the number 29, similar result was reported by Instituto Adolfo Lutz (IAL) and Fundação Ezequiel Dias (Funed), as described by the Brazilian Health Surveillance
Agency (ANVISA).17 No reports were found on the quality
and/or authenticity of the other samples.
Conclusions
These results corroborated the ability of TD-NMR to discriminate olive oil adulterated with high contents of polyunsaturated oil in intact commercial bottles. The only restriction is the oil bottled in metallic containers because of the radiofrequency attenuation. By comparing the performance of univariate and multivariate analyses, the multivariate one is simpler, faster and requires neither a mono- nor a multi-exponential fitting procedure. Overall, TD-NMR has the potential to be used for quality control purposes in different steps of the production chain as well as at any point of the distribution chain, standing out as an attractive procedure for field applications.
Acknowledgments
The authors would like to acknowledge the Brazilian agencies FAPESP (2011/11160-3, 2012/23169-8,
Figure 6. PCA score plot of the full T2 relaxation curves of ()
polyunsaturated, () olive, () hazelnut and () adulterated olive oil samples.
0 2 4 6 8 10 12 14 16 18 Sample number
20 22 24 26 28 30 32 34 36 38 0.0
0.1 0.2 0.3 0.4 0.07 0.08 0.09 0.10
H
ig
h
re
s
o
lu
ti
o
n
ra
ti
o
(b)
T2
/
s
(a)
Figure 5. Correlation of commercial oil samples with (a) T2 values
obtained by mono-exponential fitting of the T2 relaxation curves of 37
2013/03770-1 and 2014/22126-9), CNPq (380777/2014-2) and CAPES (1541262) for their financial support towards this research.
References
1. Moore, J. C.; Spink, J.; Lipp, M.; J. Food Sci. 2012, 77, 118. 2. Frankél, E. N.; J. Agric. Food Chem. 2010, 58, 5991. 3. Šmejkalová, D.; Piccolo, A.; Food Chem. 2010, 118, 153. 4. Xu, Z.; Morris, R. H.; Bencsik, M.; Newton, M. I.; Sensors
2014, 14, 2028.
5. Aparicio, R.; Aparicio-Ruız, R.; J. Chromatogr. A 2010, 881, 93. 6. Marriott, P. J.; Shellie, R.; Cornwell, C.; J. Chromatogr. A 2001,
936, 1.
7. Parker, T.; Limer, E.; Watson, A. D.; Defernez, M.; Williamson, D.; Kemsley, E. K.; TrAC, Trends Anal. Chem. 2014, 57, 147. 8. Vlachos, N.; Skopelitis, Y.; Psaroudaki, M.; Konstantinidou,
V.; Chatzilazarou, A.; Tegou, E.; Anal. Chim. Acta 2006, 573, 459.
9. El-Abassy, R. M.; Donfack, P.; Materny, A.; J. Raman Spectrosc. 2009, 40, 1284.
10. Torrecilla, J. S.; Rojo, E.; Domínguez, J. C.; Rodríguez, F.; J. Agric. Food Chem. 2010, 58, 1679.
11. Maria, M. R.; Colnago, L. A.; Forato, L. A.; Bouchard, D.; J. Agric. Food Chem. 2010, 58, 6562.
12. Perlo, J.; Casanova, F.; Blümich, B.; J. Magn. Reson. 2005, 176, 64.
13. Borgia, G.; Brown, R. J.; Fantazzini, P.; J. Magn. Reson. 2000, 147, 273.
14. Colnago, L. A.; Andrade, F. D.; Souza, A. A.; Azeredo, R. B. V.; Lima, A. A.; Cerioni, L. M.; Osán, T. M.; Pusiol, D. J.; Chem. Eng. Technol. 2014, 37, 191.
15. Berman, P.; Meiri, N.; Colnago, L. A.; Moraes, T. B.; Linder, C.; Levi, O.; Parmet, Y.; Saunders, M.; Wiesman, Z.; Biotechnol. Biofuels 2015, 8, 12.
16. Santos, P. M.; Côrrea, C. C.; Forato, L. A.; Tullio, R. R.; Cruz, G. M.; Colnago, L. A.; Food Control 2014, 38, 204.
17. http://www.portaldoconsumidor.gov.br/noticia.asp?id=28029, accessed in June 2016.
Submitted: April 19, 2016
Published online: June 21, 2016