Effect of Boride Incubation Time During the Formation of Fe
2B Phase
Bendaoud Mebareka*, Abdelbasset Benguelloulab, Abdelouahab Zanounc
Received: July 13, 2017; Revised: October 17, 2017; Accepted: October 18, 2017
Our present study focuses on the numerical simulation of the boronized layer growth kinetics on the iron substrate of the XC38 steel, the boronizing treatment is performed in a liquid medium composed of borax and silicon carbide. We mainly calculated the incubation time of the boronized layer formation. Aimed at estimating the boronizing treatment kinetics of XC38 steel, we initially used experimental data. The study was conducted to determine the law of borided layers growth and estimate the boron diffusion coefficient in the Fe2B layer. The diffusion coefficient obtained from this experiment is:
In order to calculate the incubation time of the Fe2B layer, we adapted the mathematical model,
which is based on the second law of Fick. This model takes into account the thermodynamic properties of the Fe-B phase diagram. The comparison of the results obtained by the simulation with those obtained experimentally verifies the validity of the theoretical study and a good agreement was obtained as well.
Keywords: Boronizing, Incubation time, Fe2B, Numerical simulation, Coefficient.
*e-mail: mebarekbendaoud@yahoo.fr
1. Introduction
Surface treatments are often a technical-economic solution to solve materials problems1. Different processes are applied
to treat the metals surfaces. They are related to the chemical composition and mechanical properties of the metal1,2.
Boronizing steels is a thermochemical treatment to improve the hardness (>1600 HV), the resistance to adhesive and abrasive wear and resistance to attack by acids and molten metals3. Boronizing is a boron diffusion process in
steel or other metals, generally performed between 850°C and 1050°C4,5.
There are three kinds of sources that provide the boron integrated in the substratum, solid (powder or paste), liquid (with or without electrolysis) and gaseous boron-rich atmospheres1-6. In a liquid or solid medium, borided layers are easily formed on the metal2. In industrial applications the
gaseous boronizing method requires complex equipment1.
Usually, boronizing leads to the formation of two kinds of iron bodies FeB and/or Fe2B, according to the Fe-B phase
diagram7,8. The FeB has an orthorhombic structure and its
boron content is 16 wt.%. The Fe2B has a tetragonal crystal
structure and its boron content is 8.83 wt.%9.
In this study, we prefer Fe2B over FeB, which is less
harder and more tougher than FeB iron boride, due to its thermal expansion coefficient, which is lower than; that of steel and allows development of compressive stresses on the substrate surface1-10.
The structure of Fe2B layer is saw-toothed and this is
typical in iron and low-carbon steels, from the fact that the diffusion coefficient in the Fe2B is highly anisotropic;
the diffusion is promoted in the grain direction [300]. The thickness and the quality of boronized layer during a boronizing treatment depend on the chemical composition of the medium in contact with the surface, as well as temperature and duration of treatment11.
On the theoretical level, there are several studies have been undertaken to study boronizing and several mathematical models have been developed12,13.
For instance the growth kinetics of borided layers were studied by empirical models based on Fick's laws14. This
allowed the characterization of FeB and Fe2B phases, and
the diffusivity of boron parameters.
In this paper, we numerically study the thermochemical boronizing of the XC38 steel dipped into a salt bath (70% borax 30% of silicon carbide) at temperatures between 850° C to 1050° C for 2, 4 and 6 hours15.
We proceed to calculate the diffusion coefficient from experimental data; this coefficient is used in the mathematical model to estimate the kinetics of boronizing the XC38 steel. We remind that the diffusion coefficient (D) of boron in the steel is a characteristic of a mobility to a defined temperature. This phenomenon associated with the atoms agitation will change with temperature in the same direction as the defect concentration and the entropy of the system.
aIbn Khaldoun University of Tiaret, BP 78 Zaaroura, Tiaret 14000, Algeria
bUniversity of Science and Technology of Oran, BP 1523 El M'Naouer, Algéria
cNational Polytechnic School Maurice Audin (ENPO-MA) of Oran, Algeria
.
exp
.
D
RT
j
m s
1 388
10
207 8
10
Fe B
4
3
2 1
2
#
#
We noticed that a very limited number of papers were cited about the effects of the incubation time on the formation of the boride layer. Thus, to calculate the incubation time of the Fe2B borided layer, we used the mathematical model
developed in reference16, the model is based on Fick's laws
and it does not take into consideration the incubation time of the boronized layer. In the present work, we improved the mathematical model considering the incubation time of the boronized layer as a parameter for calculating the thickness of the boronized layer.
2. Estimation of boron activation energy
The diffusion coefficient can be related with the processing time and the thickness of the boronized layer by Arrhenius expression17,18. To estimate the boron activation energy, we
must have a minimum of three treatment temperatures and thicknesses' values of the layer for each temperature. From the experimental data15, we can estimate the activation energy
of the diffusion of boron in the XC38 steel substrate using the equation (1):
(1)
The variable u represents the layer thickness (µm), D0 is the diffusion coefficient of boron (µm2/s), t is the time (s) of
boronizing, Q is the value of the activation energy measured in Joule/mole, R is the gas constant (R=8.314 Joule/mole.K) and T is the temperature in Kelvin.
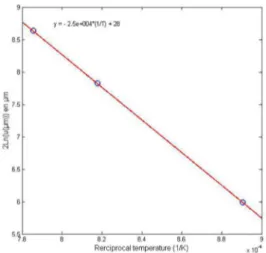
Figure 1 depicts the evolution of the thickness of the boronized layer (Fe2B) of the steel according to the reciprocal
temperature.
Using a linear regression (taking the natural logarithm of both sides of equation (1)), we can also deduce the activation energy of boron which is estimated at a value of 207.8 kJ/ mol. This activation energy is interpreted as the boron
diffusion through the direction [0 0 1] in the Fe2B phase.
Table 1 shows the Q values reported by other researchers. Table 1 compares the boron activation energies determined on the XC38 steel according to different methods of boronizing process. It is concluded that the estimated energy of activation in the case of XC38 steel can be compared to the values found in literature19. The values of these activation energies
depend on the chemical composition of the substrate and the boronizing process used.
Diffusion coefficients are very important parameters for the simulation, in both applications and calculations, it is always necessary to examine carefully if the nature of the coefficient of diffusion, or its numerical value selected responds well to the studied problem.
The diffusion coefficient values found in the literature show large variations, this leads to changes in the estimation of boron growth kinetics.
Assuming the Arrhenius relation for the diffusion process, a diffusivity of boron in Fe2B was obtained:
3. Mathematical model to calculate the
incubation time of the Fe
2B phase
3.1 The diffusion model
To calculate the incubation time of the boronized layer, we used the mathematical model16. This model is based on the
solution of Fick´s diffusion equation in a semi-infinite medium and on the assumption that the boronizing thermochemical treatment is a balancing process.
In this model the boronized layer Fe2B is formed instantly
at t=0 and immediately covers the surface (the incubation time is negligible τ=0). The model allows the estimation of the growth rate interface (Fe2B/γ-Fe).
The mathematical diffusion model is based on the phenomenological equations of Fick. The boron concentration profile is described by the solution of the diffusion equation given by Fick (2):
(2)
exp
u
D t
RT
Q
20
=
T
-
Y
Figure 1. Reciprocal temperature dependence of the boride layer thickness formed on XC38 steels after 2h.
Table 1. Comparison between the obtained values of activation energies of the boron.
Activation Energy
Q (kJ/mole) Boronizing method/steel Reference
157 Solid powder/XC38 Keddam et al.19
198 Solid powder/AISI 316 Campos et al.24
174.6 Liquid/AISI 316L Mebarek et al.26
239.4 paste boriding/AISIM2 Campos et al.27
215 Salt boriding/AISI 4140 Sen et al.25
207.8 Liquid/XC38 Present work
,
,
t
C x t
D
x
C x t
i
i i
2 2
2
2
2
2
=
Q
V
Q
V
. exp .
DFe B 1 388 104 207 8RT10j m s
3
2 1
2 #
#
Ci (x,t) represents the boron concentration at the depth x, t is the duration of the diffusion at temperature. T is the diffusion coefficient in m2s-1, i represents the phase (i =
FeB, Fe2B or Fe).
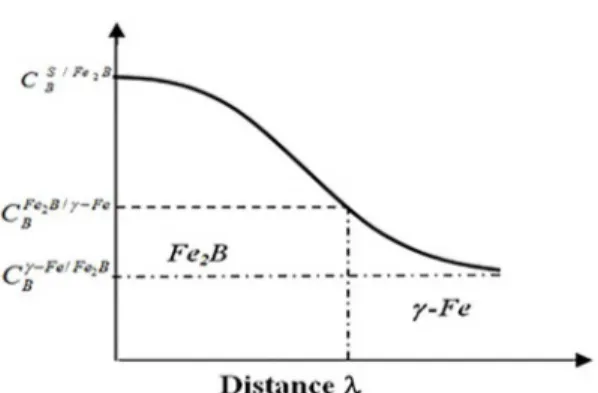
Figure 2 illustrates the boron concentration distribution along the depth of the control surface for a given temperature and under a boron potential which allows the formation of a single-phase Fe2B layer on the substrate.
The general solution of equation (2) for each phase i, is given by equation (3):
(3)
erf is the Gaussian error function, Ai and Bi are constants dependent on the initial conditions and limits. i = (Fe2B, γ-Fe).
In our diffusion model, it is considered that:
• The flow of boron atoms is perpendicular to the sample surface and the interface (Fe2B/γ-Fe) runs
parallel to the sample surface.
• The growth of the position of the interface according to time is parabolic.
• The boronized layer is thin compared to the thickness of the sample.
• The porosity effect does not exist in the surface of the material.
• The boron diffusion coefficients in different phases do not change in respect to the boron concentration. • The boronized layer Fe2B is formed instantly at t=0
and immediately covers the surface (the incubation time is negligible τ = 0).
Equation (2) subject to the following boundary conditions: • At initial condition and limits:
• At the interface:
C/
B
S Fe B2 : the boron concentration at the sample surface.
,
C / C /
B Fe B Fe
B Fe Fe B
2 c- c- 2 : boron concentrations in the Fe
2B
interface/austenite.
From equation (2) and (3), the boron concentrations in each phase are as follows:
(4)
(5)
erfc is the complementary error function erfc(x) = 1-erf(x). The mass balance equation for the Fe2B/γ-Fe interface
is obtained from the following equation:
(6)
(7)
Where k is the growth rate constant, λsim is the simulated
thickness of the boronized layer Fe2B and t the boronizing time.
After simplifying equation (6), we find:
(8)
Where:
To find a positive value of the growth rate constant (k), the solution of the non-linear Equation (8), f(k)=0 is carried out using a numerical method. This function is non-linear; it can be solved by the Newton-Raphson's numerical method.
The important parameters for the simulation are temperature, processing time, boron diffusivity in each phase and its concentration. For the Fe2B phase, we used the previously
determined diffusion coefficient.
For the γ-Fe phase, we used the diffusion coefficient found in Ref16. The boron concentrations in the interfaces Fe
2B/γ - Fe
and γ - Fe/Fe2B were taken from Refs
5-20:
3.2. Incubation time calculation
For the formation of the boronized layers Casdesus et al.21
proposed a description of the transformations taking place in the steel following the progressive diffusion of boron in
,
C x t
A
B erf
D t
x
2
i i i
i
=
+
Q
V
T
Y
Figure 2. Diagram of boron concentration profile (Fe2B layer). Fig.2. Diagram of boron concentration profile (Fe2B layer).
,
,
,
,
,
C x
t
C
t
C
C x
t
0
0
0
0
0
0
0
>
>
/B S Fe B2
3
=
=
=
=
=
=
R R R W W W,
,
,
C
t
C
/C
t
C
/Fe B sim B Fe B Fe
Fe sim B
Fe Fe B
2
2 2
m
=
cm
=
c
c
--
-Q
V
Q
V
, C x t C
erf D k
C C
erf xD t 2
2
/ / /
Fe B BS Fe B B Fe B Fe
BS Fe B
1 1 2 2 2 2 #
= + c-
-Q
T T
V
Y Y
,
C x t
erfc D k C erfc D t x 2 2 / Fe B Fe FeB 2 2 # = c c -Q T T V Y Y
C C C C
dt d
j j
2
1 / / / /
B S Fe B
B Fe B Fe
B Fe B Fe
B
Fe Fe B sim
Fe B Fe x sim
2 2 2 2
2
$ m
- + - =
-c c c
c m - - -- = S R Q Q W V VX
k t
simm
=
f k p k
erf D k p e erfc D k p e 2 2 2 0 Fe B Dk Fe Dk 0 1
4Fe B 2 4 Fe
2
2 2
2
# r #
= + + = c -c -Q T T T V Y Y Y R T SS SS SS S V X WW WW WW W
p
C
C
C
C
p
D
D
C
C
p
D
D
C
C
4
2
2
2
/ / / / / / / / B S Fe BB Fe B Fe
B Fe B Fe
B Fe Fe B
Fe B Fe B B
S Fe B B Fe B Fe
Fe B Fe B
Fe B Fe B
Fe Fe B
0
1
2
2 2 2 2
2 2 2 2 2 2 2
=
-
+
-=
-=
-c c c
c c c c - - -- -
-Q
Q
Q
Q
V
V
V
V
,
.%,
.%
C
/8 83
wt
C
/35
10
wt
B Fe B Fe
B
Fe Fe B 4
2 2
#
=
=
-the substrate, according to this mechanism, -the boron atoms released by the boronizing medium are adsorbed on the substrate surface then go into solution in the steel.
After some boron saturation and after a certain incubation time τ, which depends on the temperature of treatment22, the
first germs of Fe2B appear on the most reactive points of
the substrate surface (scratches, seals grains, dislocations ...) the incubation time corresponds to the onset of crystal Fe2B boride on the substrate surface.
After a certain time of incubation τ ≠ 0 as shown in23,24,
the crystals of the Fe2B phase form as needles, growing in
the crystallographic direction [0 0 2], parallel to the boron diffusion flow.
To calculate the incubation time, the mathematical model16
and experimental data15 have been used; the difference
between data obtained experimentally and by simulation allowed us to determine the incubation time, it is expressed by the following equation:
(9)
and
(10)
Where k is the growth rate constant, the variable λI
represents the thickness corresponds to the incubation time (µm), λsim is the simulated thickness with τ=0 and the λexp
thickness is experimentally obtained. τ: the incubation time of Fe2B formation.
t: the boronizing time.
T: the temperature of treatment.
From the two equations (9) and (10), we have the expression of incubation time:
(11)
4. Experimental Procedure
In order to test the validity of the present model, we used the results obtained from boronizing experiments on
XC38 steel taken from our own experimental data published recently15.
Samples of XC38 steel were selected for boronizing, whose nominal composition was C≈0.38,Cr<0.1,Cu<0.05, Ni≈0.045,Co≈0.17,Si≈0.34,Mn≈0.67wt.% and balance Fe). The electrochemical boronizing experiments were carried out in a liquid medium composed of 70% borax and 30% silicon carbide (70% of Na2B4O7 and 30% of SiC). The treatment was done at three different temperatures 850°C, 950°C and 1000 °C with three treatment times 2, 4 and 6 h.
The formation of the Fe2B boride was confirmed by
optical microscope observations.
5. Results and Discussion
We used the previous mathematical model16, which
does not consider the incubation time. For a boron concentration at the surface of 8.91wt.% , We get the values of the constants of the simulated growth rate for different temperatures (Table 2).
From Table 2, we note that the variation of the growth rate constant increases if the temperature of treatment increases as well and the diffusion process is very fast.
From the growth rate constant previously determined, we calculate the thickness of the boronized layer (λsim).
This simulation model can predict the boron depth-concentration profiles for each phase.
Table 3 shows the simulated values of the incubation time of the Fe2B phase as a function of time (t) and processing
temperature (T) (equation 11); note that the incubation time of Fe2B layer formation decreases when the temperature
increases.
From the table 3 we note that the formation time incubation decreasing with the increasing temperature.
Based on the experimental observations of Brakman et al.9, it was shown that the incubation time τ decreases with
increasing temperature.
Figure 3 shows the variation of incubation time calculated in function of the temperature for 2hours treatment time.
To consider the effect of incubation times for the borides formation, the temperature-dependent function B(T) was incorporated in our model.
,
t T
k t
expI sim exp
m
Q
V
=
Q
m
-
m
V
=
R
-
m
W
,
t T
k
I
m
Q V
=
x
,
t T
k
k t
f
f
t
0
0
exp exp
2
1
1 2
x
=
-
m
=
--
m
-Q
V
R W RQ
V
Q
V
WTable 2. Evolution of the absolute value of the growth rate constant according to temperature (τ = 0).
Température °C 750 800 850 900 950 1000 1050
k (µm.s-1/2) 0.1481 0.2275 0.3365 0.480 0.6672 0.9037 1.1960
Table 3. The values of the simulated incubation time of the Fe2B boronized layer (τ).
T(°C)/t(h) experimental value of layer thickness (µm) Simulated incubation time (s)
2 4 6 8 2 4 6 Average
850 °C 20.0 30.0 38.0 56.0 217.39 320.19 389.96 309.18
950 °C 50.0 77.0 96.0 124 65.56 14.07 6. 34 28.66
The parameter B (T) given by equation (12) depends only on the temperature which has been used by several studies to estimate the thickness of the boronized layer24,
this parameter does not have a physical dimension. It can be approximated by a linear equation:
(12)
B T
Q
V
=
S
1
-
x
t
X
Figure 3. Incubation time according to the temperature for 2h.
Table 4. Simulated values of the parameter B (T) according to temperature.
T(°C)/t(h) B(T)
2h 4h 6h 8h
850 °C 0.792 0.853 0.880 0.896
950 °C 0.936 0.955 0.963 0.968 1000 °C 0.962 0.973 0.978 0.981
Figure 4. The B (T) Parameter as a function of temperature for 2hours treatment period.
Table 5. The thickness of the boronized layer simulated with the equation (13) and the thickness obtained by using the experimental data.
T(°C)/t(h)
Layer thickness Fe2B (µm)
Experimental simulated by using B(T) function
2h 4h 6h 2h 4h 6h
850 °C 20 30 38 23.41 33.11 40.55
950 °C 50 77 96 53.22 75.26 92.17
1000 °C 74.5 108 128 76.68 108.4 132.8
U
=
kB T
Q V
t
Figure 5. Comparison of the simulated thickness (sim1), (sim2)
measured for different temperatures.
Table 4 shows the simulated values of the parameter B(T) according to temperature, we note that B (T) increases when the temperature increase.
The variation parameter B(T) as a function of temperature for 2 hours treatment period is plotted in Figure 4, the variation of this parameter is estimated with a linear equation.
The boride incubation time for forming the Fe2B layer
on the iron substrate, was incorporated in the mathematical formulation of the simulation model in order to evaluate the growth rate constant at the Fe2B phase.
The equation (7) giving the simulated thickness of the Fe2B boronized layer, can be rewritten in the following way:
(13)
Table 5 shows the simulated values of the boronized layer thickness according to B(T); we find a good agreement between the experimental data and the calculated ones.
Figure 5 depicts the evolution of the boronized layer thickness, simulated with both methods. The first (sim 1) does not consider the incubation time of the Fe2B layer, and
it allows us to calculate the thickness with the assumption that the Fe2B layer forms instantly at t=0 and immediately
covers the steel, the second method (sim 2) is calculated based on the incubation time of the Fe2B layer.
Comparing the results, given by the numerical simulation with experimental data, the medium error generated from model was 2.8 µm.
From Figure 5 we note that the result of simulation (sim 2) considers the effect of the boride incubation time (τ) during the formation of Fe2B layer were in good agreement
with the experimental data.
For the temperature 1000°C we note that the simulation (sim1) coincides with the results of the simulation (sim 2), this is interpreted as the incubation time decreases when the temperature increases which the incubation time is negligible for a temperature more than 1000° C.
6. Conclusion
In this work, we developed a mathematical model based on the second law of Fick to simulate the incubation time of the Fe2B boronized layer formation obtained by boronizing the
XC38 steel. From a kinetic point of view, the thicknesses of borided layers follow a parabolic law. Basing on experimental results, the boron activation energy was estimated as 207.8 kJ/mol for XC38 steel.
Using this numerical simulation, we can estimate the incubation time and calculate the thickness of boronized layer considering the incubation time.
We see through this work that the incubation time for the formation of the boronized layer is very important to calculate the thickness of the Fe2B boronized layer, and the incubation time
decreases when the temperature increases, and it is negligible for temperatures more than 1000 ° C. The results obtained in this work clearly show the influence of these parameters.
The Comparison between the simulation result and the experimental data allows us to confirm the validity of our model.
The accuracy of the simulation results depends highly on a series of measurements obtained experimentally. To simulate the thickness values of boride layers with good exactness, it is necessary to increase the number of measurements.
7. References
1. Matuschka AG. Boronizing. Munich: Carl Hanser Verlag; 1980.
2. Sinha AK. Boriding (Boronizing) of Steels. In: ASM Handbook Volume 4 - Heat Treating. Materials Park: ASM International;
1990. p. 437-447.
3. Allaoui O, Bouaouadja N, Saindernan G. Characterization of boronized layers on a XC38 steel. Surface and Coatings Technology. 2006;201(6):3475-3482.
4. Yu LG, Chen XJ, Khor KA, Sundararajan G. FeB/Fe2B phase transformation during SPS pack-boronizing: Boride layer growth
kinetics. Acta Materialia. 2005;53(8):2361-2368.
5. Keddam M, Chentouf SM. A diffusion model for describing the bilayer growth (FeB/Fe2B) during the iron powder-pack
boronizing. Applied Surface Science. 2005;252(2):393-399.
6. Pertek A. Gas Boriding Conditions for the Iron Borides Layers
Formation. Materials Science Forum. 1994;163-165:323-328. 7. Popeau P. Diagramme d'équilibre alliages binaires. Techniques
de l'Ingénieur. 1986;M70(1):129.
8. Massalski TB, Okamoto H, Subramanian PR, Kacprzak L, eds. Binary Alloy Phase Diagrams. 2nd ed. Materials Park: ASM International; 1990.
9. Brakman CM, Gommers AWJ, Mittemeijer EJ. Boronizing of
Fe and Fe-C, Fe-Cr, and Fe-Ni alloys: Boride-layer growth
kinetics. Journal of Materials Research. 1989;4(6):1354-1370.
10. Kunst H, Schaaber O. The surface boriding of steel. Pt. 2. Growth mechanism and structure of intermediate and diffusion
layers. Härterei-Technische Mitteilung. 1967;22(4):275.
11. Ucar N, Aytar OB, Calik A. Temperature behaviour of the
boride layer of a low-carbon microalloyed steel. Materiali in Tehnologije. 2012;46(6):621-625.
12. Keddam M. A kinetic model for the borided layers by the paste-boriding process. Applied Surface Science. 2004;236(1-4):451-455.
13. Campos-Silva I, Ortiz-Domínguez M, Bravo-Bárcenas O, Doñu-Ruiz MA, Bravo-Bárcenas D, Tapia-Quintero C, et al. Formation and kinetics of FeB/Fe2B layers and diffusion zone
at the surface of AISI 316 borided steels. Surface and Coatings Technology. 2010;205(2):403-412.
14. Campos I, Oseguera J, Figueroa U, Garcia JA, Bautista O, Keleminis G. Kinetic study of boron diffusion in the
paste-boroding process. Materials Science and Engineering: A.
2003;352(1-2):261-265.
15. Bouaziz SA, Boudaoud N, Zanoun A. Boruration thermochimique
d'un acier C38 dans un bain de sels borax-SiC. Matériaux et Techniques. 2009;97(4):253-259.
16. Mebarek B, Bouaziz SA, Zanoun A. Simulation model to study the thermochemical boriding of stainless steel "AISI 316"
(X5CrNiMo17-12-2). Matériaux et Techniques.
2012;100(2):167-175.
17. Yang H, Wu X, Yang Z, Pu S, Wang H. Enhanced boronizing kinetics of alloy steel assisted by surface mechanical attrition treatment. Journal of Alloys and Compounds.
2014;590:388-395.
18. Genel K, Ozbek I, Bindal C. Kinetics of boriding of AISI W1
steel. Materials Science and Engineering: A. 2003;347(1-2):311-314.
19. Abdellah ZN, Keddam M, Chegroune R, Azouani O, Allaoui
O, Elias A. Characterization and boriding kinetics of C38
carbon steel: effect of the process time. Materiaux et Technique.
2012;100(3):271-278.
20. Hallemans B, Wollants P, Roos JR. Thermodynamic assessment
of the Fe-Nd-B phase diagram. Journal of Phase Equilibria.
1995;16(2):137-149.
21. Casadesus P, Frantz C. La boruration du fer et des aciers
par bombardement ionique avec le diborane. Les Mémoires
scientifiques de la Revue de Métallurgie. 1978;81-91. 22. Keddam M. Simulation of the growth kinetics of the (FeB/
23. Keddam M, Bouarour B, Nait Abdellah Z, Chegroune R. The effective diffusion coefficient of boron in the Fe2B layers
formed on the iron substrate. MATEC Web of Conference. 2013;3:01012.
24. Campos-Silva I, Ortiz-Domínguez M, Bravo-Bárcenas O, Doñu-Ruiz MA, Bravo-Bárcenas D, Tapia-Quintero C, et al. Formation and kinetics of FeB/Fe2B layers and diffusion zone
at the surface of AISI 316 borided steels. Surface and Coatings Technology. 2010;205(2):403-412.
25. Sen S, Sen U, Bindal C. The growth kinetics of borides formed on boronized AISI 4140 steel. Vacuum. 2005;77(2):195-202.
26. Mebarek B, Madouri D, Zanoun A, Belaidi A. Simulation
model of monolayer growth kinetics of Fe2B phase. Matériaux & Techniques. 2015;103(7):703-710.
27. Campos I, Torres R, Bautista O, Ramírez G, Zúñiga L. Effect